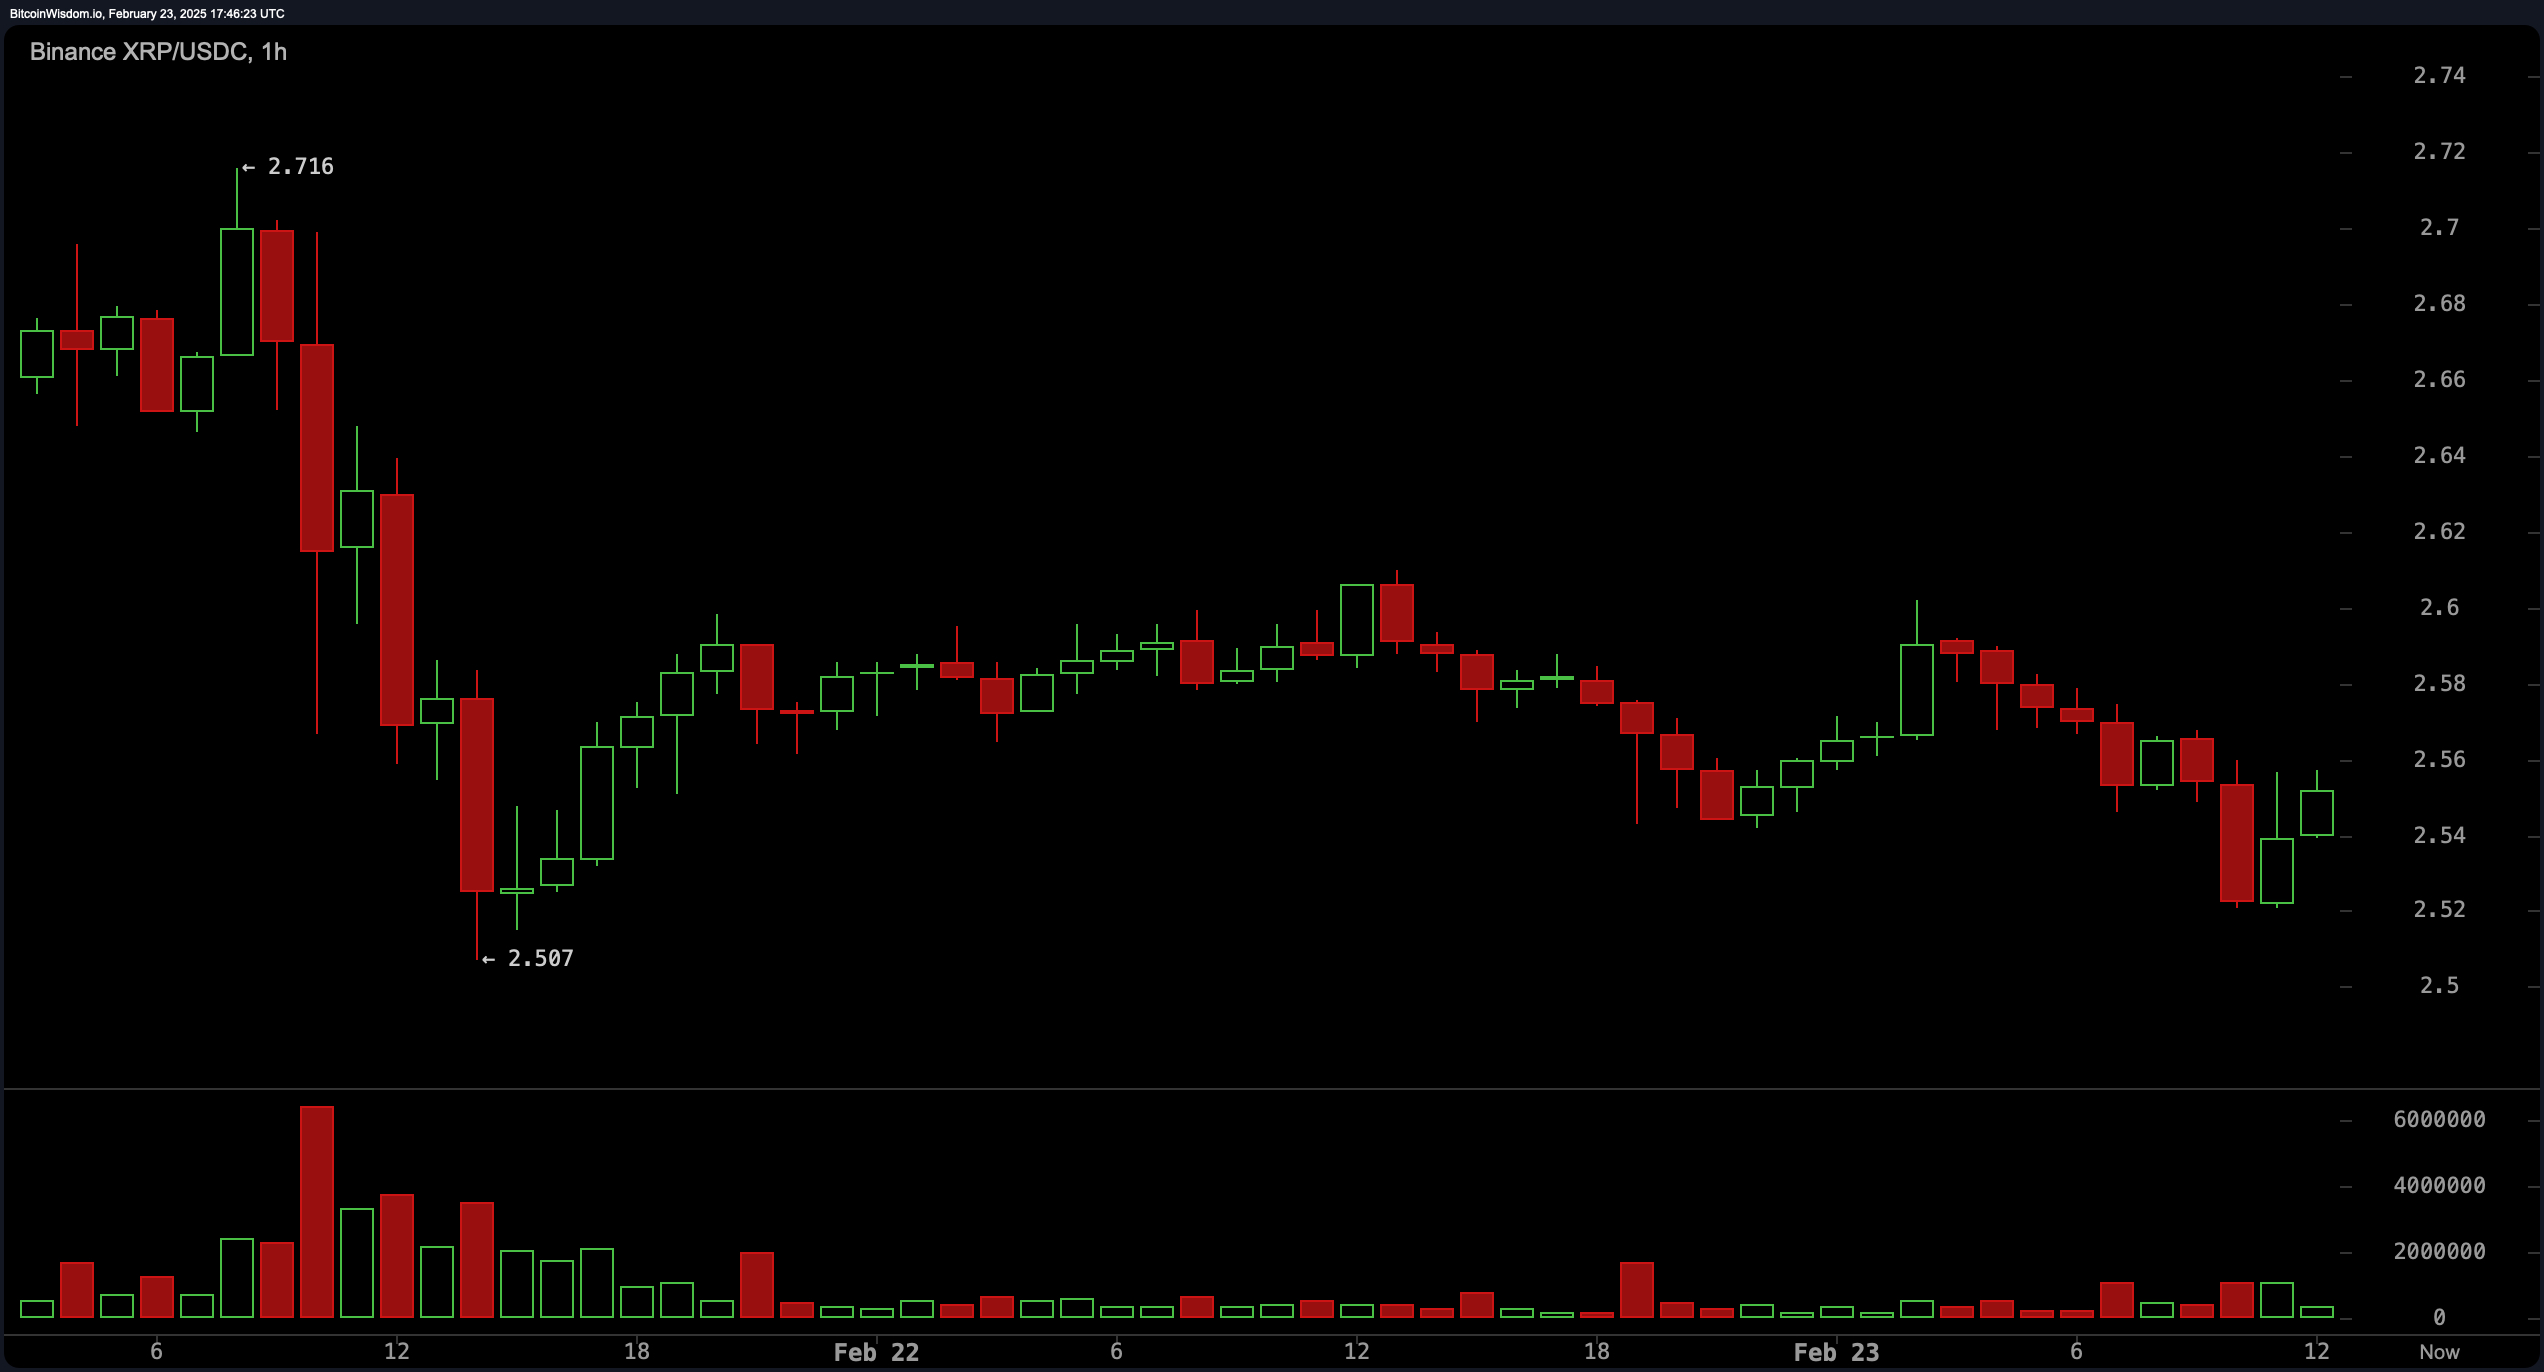
The 1-hour chart shows XRP maintaining a tight range, with low volume indicating uncertainty in direction. The price is oscillating between short-term support at $2.50 and resistance at $2.60, with attempts to break higher facing selling pressure. A breakout above $2.60 could push XRP toward $2.65 or $2.70, while failure to hold $2.50 may lead to a test of the $2.45–$2.40 region. The market remains indecisive, with traders watching for volume confirmation to support directional moves.

XRP/USDC via Binance 1H chart on Feb. 23, 2025.
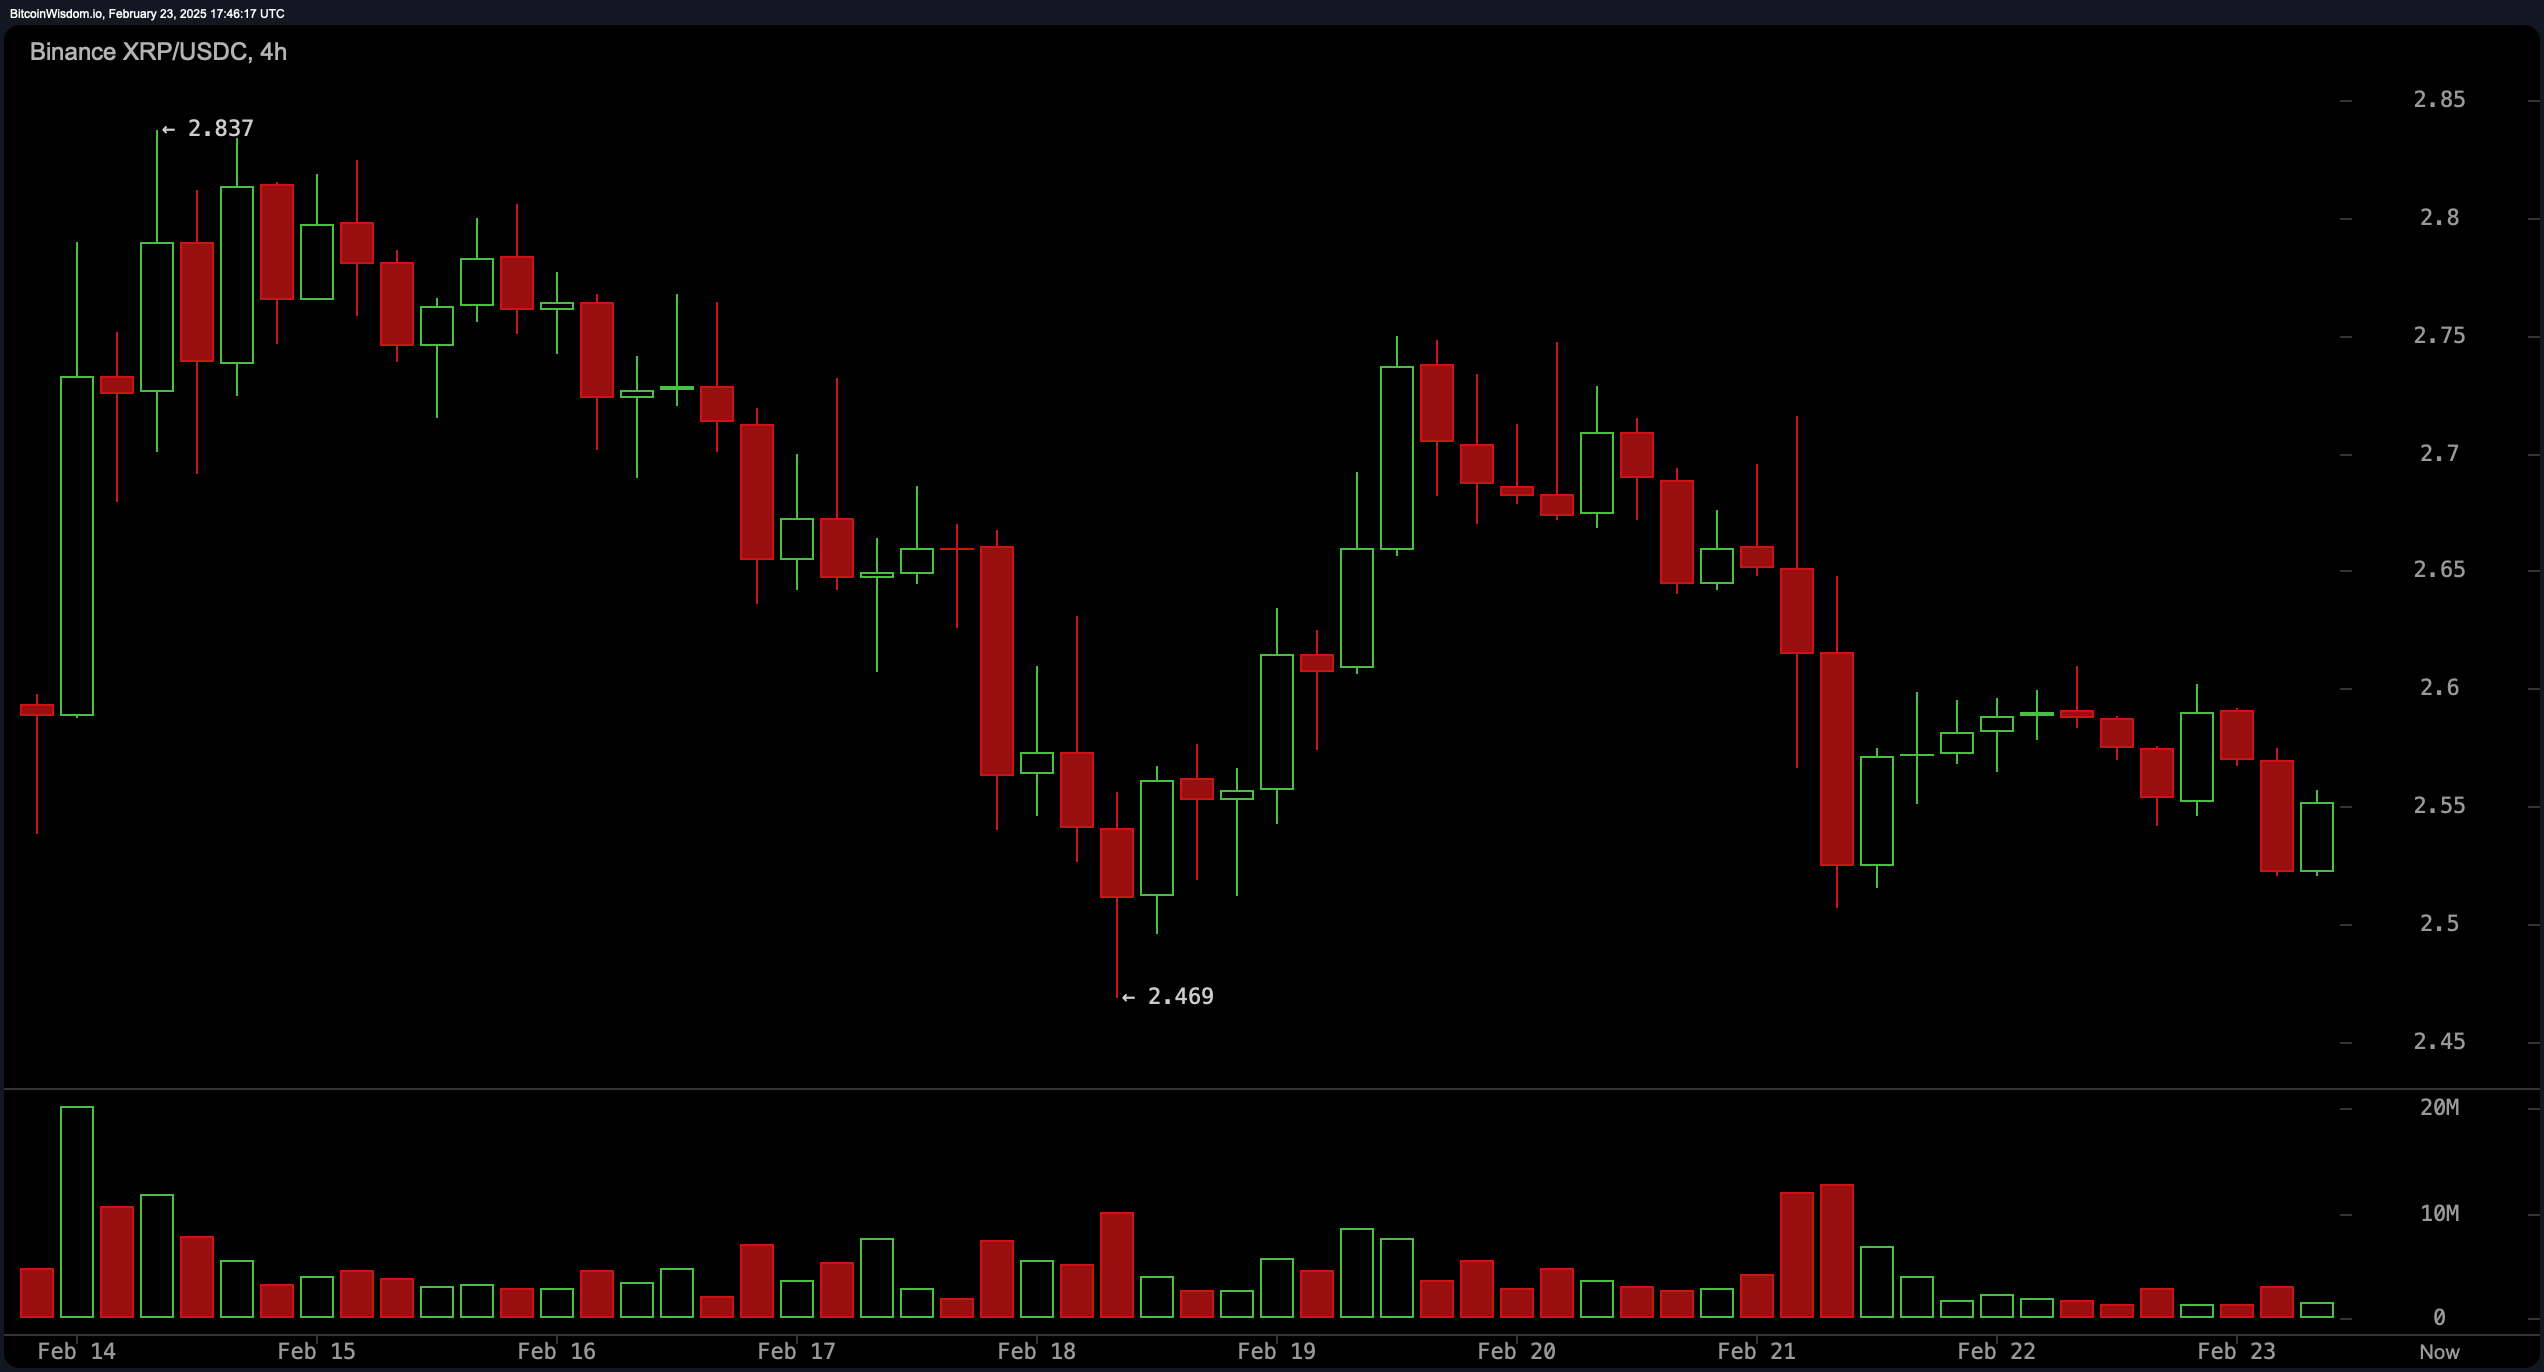
On the 4-hour chart, XRP has been making lower highs after recently topping out at $2.83, signaling weakening bullish momentum. A pullback to $2.46 was followed by an attempt at recovery, but volume remains low, reflecting a lack of strong buying interest. Resistance at $2.70 remains a key level, and failure to break above it could lead to a continuation of the downtrend. Support at $2.50 remains critical, and a breakdown below this level could trigger a decline toward $2.40.

XRP/USDC via Binance 4H chart on Feb. 23, 2025.
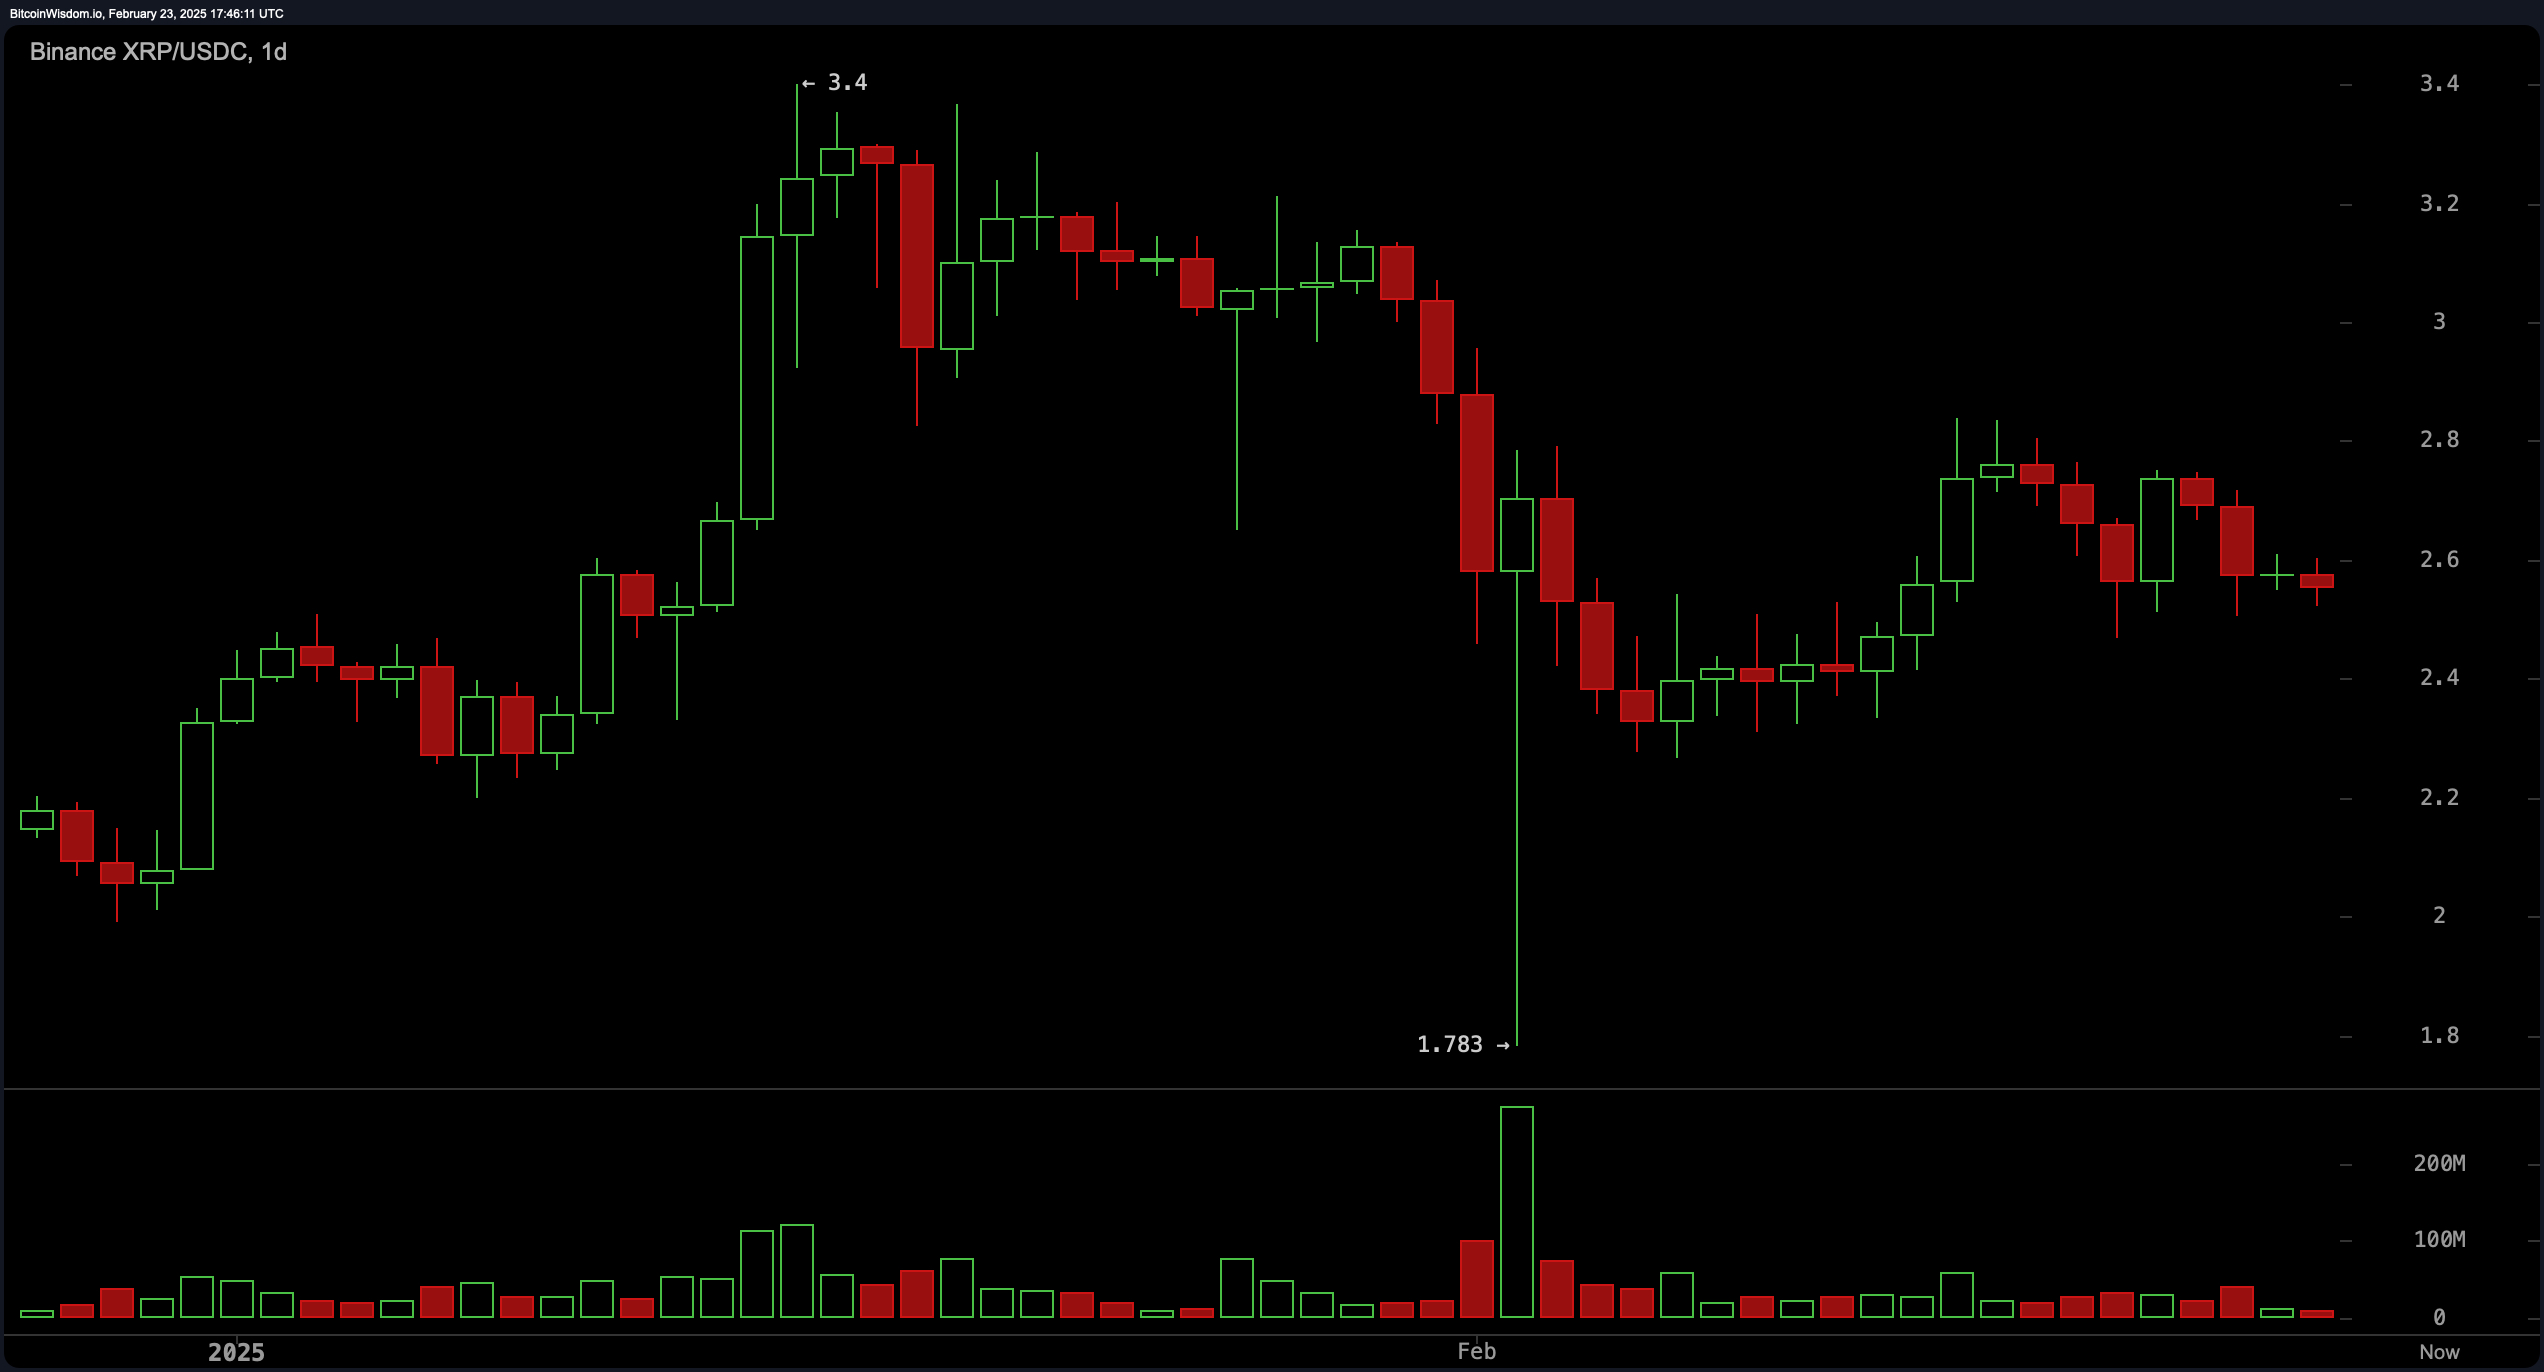
XRP’s daily chart suggests the crypto asset is consolidating after a strong bullish rally that peaked at $3.40 before a sharp correction to $1.78. The price is now trading between $2.40 and $2.70, with a neutral-to-bullish bias. A move above $2.70 could signal a potential recovery toward $3.00, while a break below $2.40 may confirm a shift to a bearish outlook. Volume spikes during recent sell-offs indicate caution, as buying pressure has not yet fully returned.

XRP/USDC via Binance 1D chart on Feb. 23, 2025.
Oscillators provide mixed signals, with the relative strength index (RSI) at 45.69 remaining neutral, alongside the Stochastic oscillator at 48.08 and the commodity channel index (CCI) at 6.99. The average directional index (ADX) at 29.87 suggests a lack of a strong trend, while the awesome oscillator remains slightly negative at -0.11. The momentum oscillator at -0.0048 signals a sell, while the moving average convergence divergence (MACD) at -0.0278 indicates a buy, highlighting conflicting signals.
Moving averages (MAs) show bearish pressure in the short term, with the exponential moving averages (EMAs) of 10, 20, and 30 periods at 2.60, 2.62, and 2.64 all in sell territory. The simple moving averages (SMAs) of the same periods follow a similar trend, except for the 20-period SMA at 2.54, which signals a buy. Longer-term indicators favor bullish sentiment, with the 100-period and 200-period EMAs and SMAs indicating a buy. This divergence suggests short-term caution while maintaining a positive long-term outlook.
Bull Verdict:
Despite short-term consolidation and mixed signals from oscillators, XRP’s long-term MAs remain bullish, indicating strength in higher time frames. If the price holds above $2.50 and breaks past $2.70, a move toward $3.00 and beyond is likely, reinforcing a bullish outlook.
Bear Verdict:
XRP faces strong resistance at $2.70 while short-term indicators lean bearish, with multiple MAs signaling sell pressure. If the price falls below $2.50 and breaks key support at $2.40, bearish momentum could accelerate, potentially pushing XRP back toward the $2.20–$2.00 range.
免责声明:本文章仅代表作者个人观点,不代表本平台的立场和观点。本文章仅供信息分享,不构成对任何人的任何投资建议。用户与作者之间的任何争议,与本平台无关。如网页中刊载的文章或图片涉及侵权,请提供相关的权利证明和身份证明发送邮件到support@aicoin.com,本平台相关工作人员将会进行核查。


