Table of Contents:
This week's large token unlock data;
Overview of the crypto market, a quick read on the weekly rise and fall of popular coins/fund flows in sectors;
Inflow and outflow of spot ETF funds;
Altcoin index continues to decline;
Key macro events and economic data forecasts for this week.
1. This week's large token unlock data;
This week, the unlocking situations of several projects were announced. Among them, MANTRA's token OM was unlocked on February 23, belonging to the DeFi sector, with a circulating market value of $7.39 billion. The unlocking amount was $18.35 million, with 2.42 million tokens unlocked, accounting for 0.3% of the circulating supply;
EigenLayer's EIGEN was unlocked on February 26, belonging to the Restaking sector, with a circulating market value of $490 million. The unlocking amount was $2.63 million, with 1.29 million tokens unlocked, accounting for 0.5%;
Ethena's ENA was unlocked on February 26, in the DeFi sector, with a circulating market value of $1.4 billion. The unlocking amount was $3.58 million, with 7.94 million tokens unlocked, accounting for 0.3%.
Fetchai's FET was unlocked on February 28, in the AI sector, with a circulating market value of $2.06 billion. The unlocking amount was $3.55 million, with 2.81 million tokens unlocked, accounting for 0.1%;
Celo's CELO was also unlocked on February 28, in the Layer1 sector, with a circulating market value of $240 million. The unlocking amount was $1.24 million, with 2.85 million tokens unlocked, accounting for 0.5%;
Mocaverse's MOCA was unlocked on February 28, in the Metaverse sector, with a circulating market value of $250 million. The unlocking amount was $5.79 million, with 44.2 million tokens unlocked, accounting for 2.3%;
Optimism's OP was unlocked on February 28, in the Layer2 sector, with a circulating market value of $1.81 billion. The unlocking amount was $35.1 million, with 31.34 million tokens unlocked, accounting for 1.9%.
Sui's SUI was unlocked on March 1, in the Layer1 sector, with a circulating market value of $10.37 billion. The unlocking amount was $89.93 million, with 26.69 million tokens unlocked, accounting for 0.9%;
ZetaChain's ZETA was also unlocked on March 1, in the Layer1 sector, with a circulating market value of $210 million. The unlocking amount was $14.22 million, with 45.29 million tokens unlocked, accounting for 6.6%;
dYdX's DYDX was unlocked on March 1, in the DeFi sector, with a circulating market value of $580 million. The unlocking amount was $6.91 million, with 8.72 million tokens unlocked, accounting for 1.2%. The unlocking situations of these projects may have varying degrees of impact on the related markets.
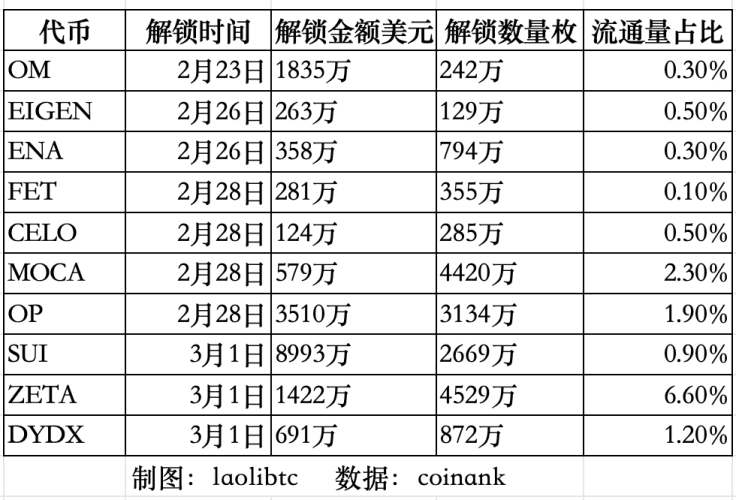
The above is in UTC+8 time. This week, pay attention to the negative effects brought by the unlocking of these tokens, avoid spot trading, and seek shorting opportunities in contracts. The chart is from CoinAnk data, where ZETA, SUI, and OP have larger proportions and scales of unlocked circulating supply, warranting more attention.
2. Overview of the crypto market, a quick read on the weekly rise and fall of popular coins/fund flows in sectors
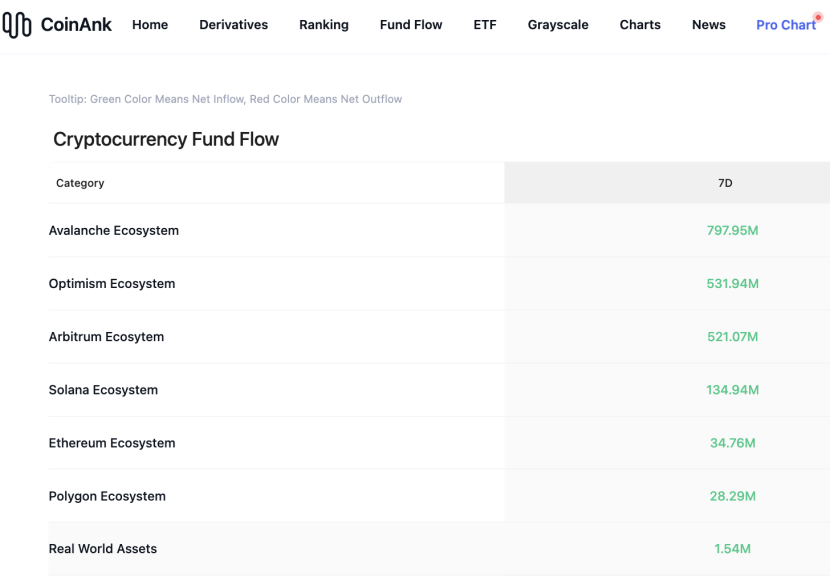
According to CoinAnk data, in the past 7 days, the crypto market, categorized by concept sectors, saw net inflows concentrated in several major areas including the Avalanche ecosystem, Optimism ecosystem, Arbitrum ecosystem, Solana ecosystem, Ethereum ecosystem, Polygon ecosystem, and RWA sector. In the past week, many tokens have also experienced rotational increases. The top 500 by market capitalization are as follows: S, FORT, LCX, STPT, RUNE, and ELA have relatively high increases and can continue to be prioritized for trading opportunities in strong tokens.
3. Inflow and outflow of spot ETF funds.
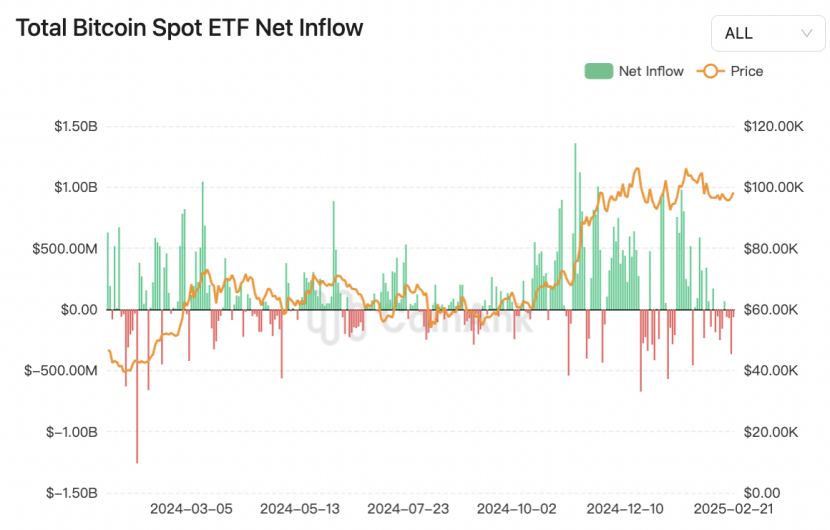
According to CoinAnk data, in the past week, the U.S. Bitcoin spot ETF saw a net outflow of $559 million. The Bitcoin spot ETF with the highest net inflow last week was the VanEck Bitcoin ETF HODL, with a weekly net inflow of $4.13 million, bringing its historical total net inflow to $871 million. The Bitcoin spot ETF with the highest net outflow last week was Fidelity's Bitcoin ETF FBTC, with a weekly net outflow of $166 million, currently having a historical total net inflow of $12.33 billion.
The total net asset value of Bitcoin spot ETFs is $110.795 billion, with an ETF net asset ratio (market value compared to total Bitcoin market value) of 5.88%. The historical cumulative net inflow has reached $39.556 billion.
We believe that observing the recent fund movements of U.S. Bitcoin spot ETFs from a structural differentiation perspective highlights the phased adjustments in strategies by institutional investors. Although there was an overall net outflow of $559 million last week, VanEck's HODL recorded a net inflow of $4.13 million against the trend, while Fidelity's FBTC saw a net outflow of $166 million, reflecting differing judgments on Bitcoin pricing logic among different institutions.
In the short-term fund game, the large outflow from FBTC may be related to institutional investors executing risk hedging strategies amid Bitcoin's high volatility, with some funds possibly shifting to traditional safe-haven assets like gold in response to the delayed macro environment of the Federal Reserve's interest rate cuts. The continued capital inflow into HODL (cumulative $871 million) indicates that small and medium-sized asset management institutions are using market corrections to position themselves at lower levels, with its low fee rate (0.25%) potentially becoming a key competitive advantage.
In terms of market structure characteristics, the current total net asset ratio of ETFs is 5.88% ($110.795 billion), which, although down from its peak, is still significantly higher than the 3.2% at the beginning of the year, demonstrating the resilience of the institutionalization process. The historical cumulative net inflow of $39.556 billion supports Bitcoin's anchoring effect as an alternative asset in portfolios.
It is noteworthy that this round of fund outflows has not been accompanied by a significant decrease in on-chain holdings, suggesting that the outflowing funds may come from secondary market arbitrage rather than long-term holders. If Bitcoin's price breaks through key resistance levels in the future, institutional funds may restart inflows, but caution is needed regarding the transmission effect of U.S. stock volatility on ETF fund flows. The current market is entering a phase of stock game dominated by institutions, and the phenomenon of liquidity stratification may intensify.
4. Altcoin index continues to decline.
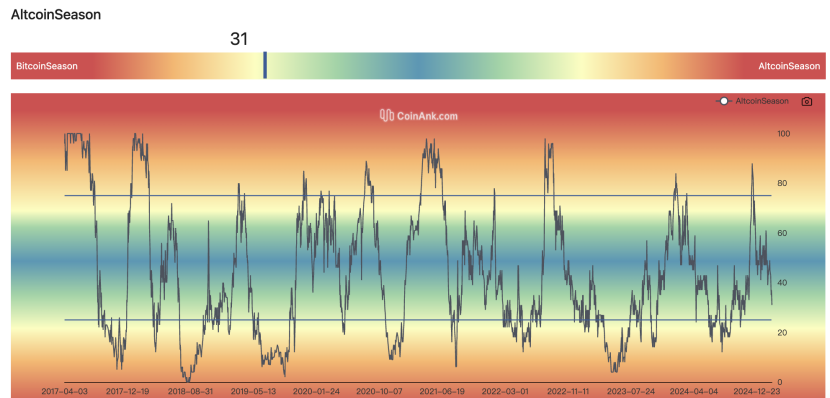
According to CoinAnk data, the Altcoin Season Index currently stands at 31, down 11 points from last week. This index shows that in the past 90 days, only about 31 projects among the top 100 cryptocurrencies by market capitalization have outperformed Bitcoin.
We believe that from the perspective of market cycles and fund rotation, the current decline of the Altcoin Season Index to 31 points (down 11 points from last week) reflects that the crypto market is still in a Bitcoin-dominated phase, with funds not yet migrating en masse to altcoins. This index measures the proportion of the top 100 altcoins that have outperformed Bitcoin in the past 90 days, with only 31% meeting the standard, far below the 75% threshold for altcoin seasons, indicating that investor risk appetite remains focused on core assets like Bitcoin.
In terms of short-term drivers, the index's decline may be related to the recent increase in market risk aversion. The slowdown in inflows to Bitcoin spot ETFs and regulatory uncertainties (such as the SEC's scrutiny of the securities nature of altcoins) have prompted some funds to flow back from high-beta altcoins to Bitcoin. Additionally, the supply-demand logic post-Bitcoin halving has reinforced its narrative as "digital gold," further squeezing the capital attractiveness of altcoins.
Structural contradictions are reflected in the increasing market differentiation: on one hand, although mainstream altcoin ecosystems like Ethereum continue to innovate (such as L2 scaling, RWA, etc.), their valuation recovery is constrained by the rising dominance of Bitcoin (currently around 53%-56%); on the other hand, the short-term explosion of speculative varieties like meme coins can boost market enthusiasm locally but fails to form sustainable ecological value support, instead exacerbating volatility risks.
For future trend judgments, the initiation of an altcoin season requires meeting two major conditions: first, a significant retreat in Bitcoin's dominance to release fund rotation space; second, large-scale capital inflows driven by new narratives (such as AI + blockchain, DePIN, etc.). The current growth in stablecoin liquidity and institutional positioning in ETH spot ETFs may serve as potential catalysts, but caution is needed regarding the liquidity siphoning effect caused by high leverage in the derivatives market. In the short term, the market may continue the differentiated pattern of "strong Bitcoin, weak altcoins," and attention should be paid to leading indicators such as the BTC/ETH exchange rate and net inflows of stablecoins.
5. Key macro events and economic data forecasts for this week.
From the timeline perspective, CoinAnk's macro event distribution for this week is as follows:
On Tuesday (February 27), attention should be paid to the speech by Dallas Fed President Logan (17:20) and the U.S. Conference Board Consumer Confidence Index (23:00). The former may reveal the Fed's latest attitude towards the pace of balance sheet reduction, while the latter may confirm whether consumer resilience continues.
On Wednesday (February 28), the focus will be on the speech by Fed Governor Barr (00:45) and Nvidia's earnings report (after market close). If Barr hints at an escalation of concerns regarding commercial real estate risks, it may impact the sentiment of financial stocks; if Nvidia's data center revenue shows a year-on-year growth rate exceeding 300%, it may reinforce the valuation logic of the AI industry chain.
On Thursday (February 29), the speech by Kansas Fed President Schmid and the Q4 GDP revision (21:30) will provide cross-validation. If the GDP is revised down alongside weak durable goods orders, it may shake the "no landing" expectations.
On Friday (March 1), a core event will occur—U.S. January Core PCE data (21:30). If the month-on-month increase remains at a high level of 0.4%, combined with hawkish statements from Cleveland Fed President Mester (02:15) and Philadelphia Fed President Harker (04:15), it may reignite expectations for no interest rate cuts in May, and U.S. Treasury short-term yields may break through the key level of 4.35%. Overall, the resonance effect of data and officials' speeches in the time dimension is significant; the market may maintain volatility before Thursday, with volatility expected to surge sharply after the PCE release on Friday.
The core of this week's macro events lies in the interplay between the Fed's policy path and inflation data, compounded by the disturbance of tech giants' earnings reports on market sentiment. First, the dense speeches from Fed officials (involving Logan, Barr, Schmid, and other voting members) may release divergent and consensus policy signals. Based on historical experience, recent official statements generally emphasize a cautious stance of "data dependence," but the internal division between doves and hawks may exacerbate market volatility. Special attention should be paid to voting members' interpretations of PCE data; if core inflation proves stickier than expected, it may reinforce the "higher for longer" interest rate expectations.
PCE, as the inflation indicator most emphasized by the Fed, has sub-items (such as service inflation, housing costs) that will directly affect the judgment of the timing for a shift in monetary policy. The market has already adjusted its expectations for interest rate cuts within the year; if data continues to deviate from the 2% target, it may trigger another rise in U.S. Treasury yields. Additionally, GDP revision values and durable goods orders will validate the resilience of the U.S. economy, supporting the "soft landing" narrative.
Nvidia's earnings report has become a bellwether for tech stocks. As a core supplier of AI computing power, its performance not only reflects the industry's prosperity but may also influence the market's assessment of the AI bubble. If revenue guidance exceeds expectations, it may boost the Nasdaq and alleviate market concerns about high valuations; conversely, if there are signals of inventory buildup or competitive pressure, it may trigger a pullback in the tech sector. Special attention should be paid to the growth rate of the data center business and the potential impact of domestic alternatives on its market share. Overall, this week's event chain will reshape the market's triple pricing logic regarding "interest rates-growth-tech cycle."
免责声明:本文章仅代表作者个人观点,不代表本平台的立场和观点。本文章仅供信息分享,不构成对任何人的任何投资建议。用户与作者之间的任何争议,与本平台无关。如网页中刊载的文章或图片涉及侵权,请提供相关的权利证明和身份证明发送邮件到support@aicoin.com,本平台相关工作人员将会进行核查。


