The U.S. President emphasized earlier at a White House press conference that the comprehensive tariffs on imported goods from Canada and Mexico will take effect as scheduled after a one-month delay, leading to increased market risk aversion. Meanwhile, due to the continued decline of tech stocks in Nasdaq futures and the strengthening of the yen caused by expectations of interest rate hikes from the Bank of Japan, concerns about risk aversion have arisen. As a result, Bitcoin began a new wave of decline around six o'clock this morning, dropping to around $90,850 by eight o'clock, marking a new low since January 13. Ethereum also plummeted, with the price at the time of writing being $87,812, down nearly 3.84% in the last 24 hours.
Bitcoin Four-Hour Chart
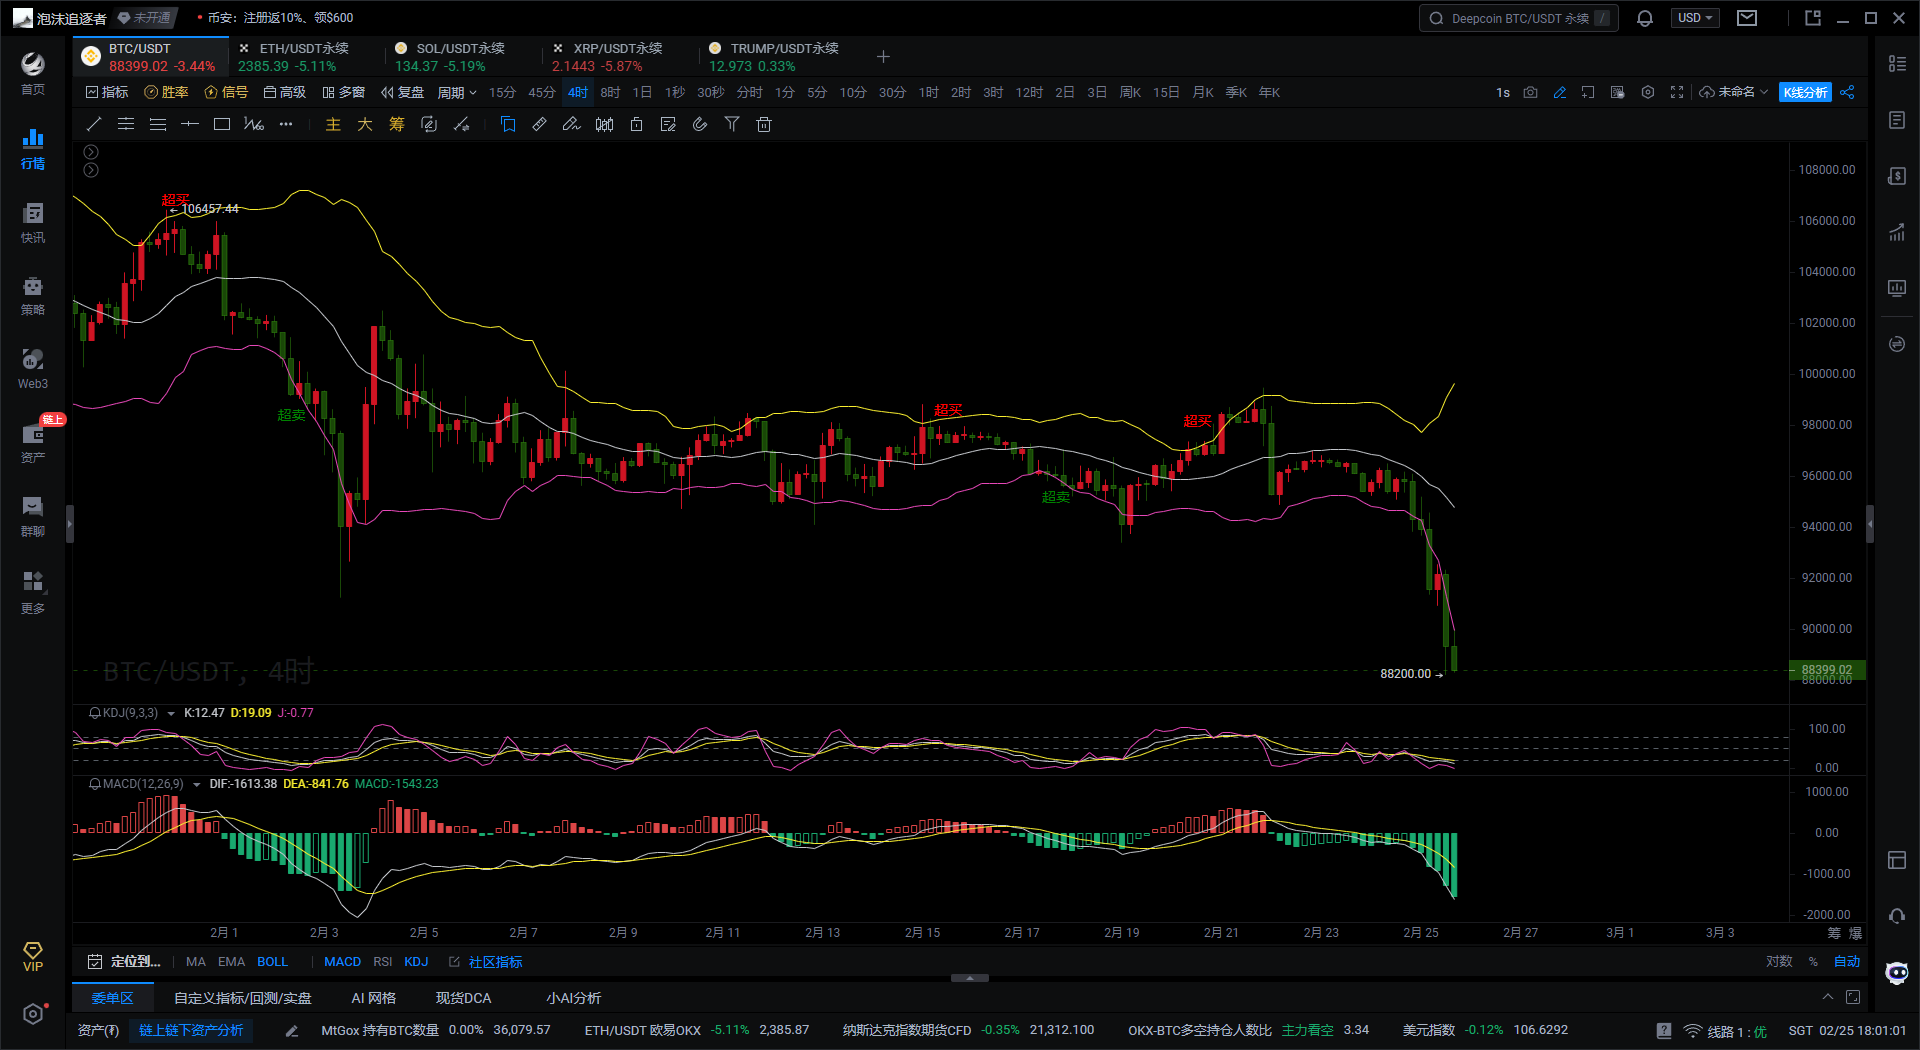
First, according to the Bollinger Bands indicator on the Bitcoin 4H chart, the market is showing a clear bearish trend, with the middle band continuously moving downward, reflecting the overall market trend. Recently, the price not only broke through the lower band but also moved downward at a rapid pace, indicating significant downward pressure in the market. Meanwhile, the narrowing of the Bollinger Bands suggests that market volatility may increase. As the price further explores lower levels, there is a possibility of increased volatility.
Second, based on the KDJ indicator on the Bitcoin 4H chart, both the K and D values are in the oversold zone, indicating that the market is currently at a relatively low price level. Notably, the K value is crossing above the D value, suggesting a potential rebound signal in the short term. Additionally, although the J value is in the negative zone, indicating significant downward pressure, the golden cross pattern of the KDJ indicator provides a short-term rebound opportunity. This signal may indicate that the market is about to experience a short-term price recovery.
Finally, according to the MACD indicator on the Bitcoin 4H chart, both the DIF and DEA lines are operating below the zero axis and continue to diverge downward, indicating that the bearish trend continues to dominate the market. Meanwhile, the green histogram of the MACD is continuously growing, further validating the market's downward trend. Unless a significant reversal signal appears, it is advisable not to blindly chase long positions for the time being.
Bitcoin One-Hour Chart
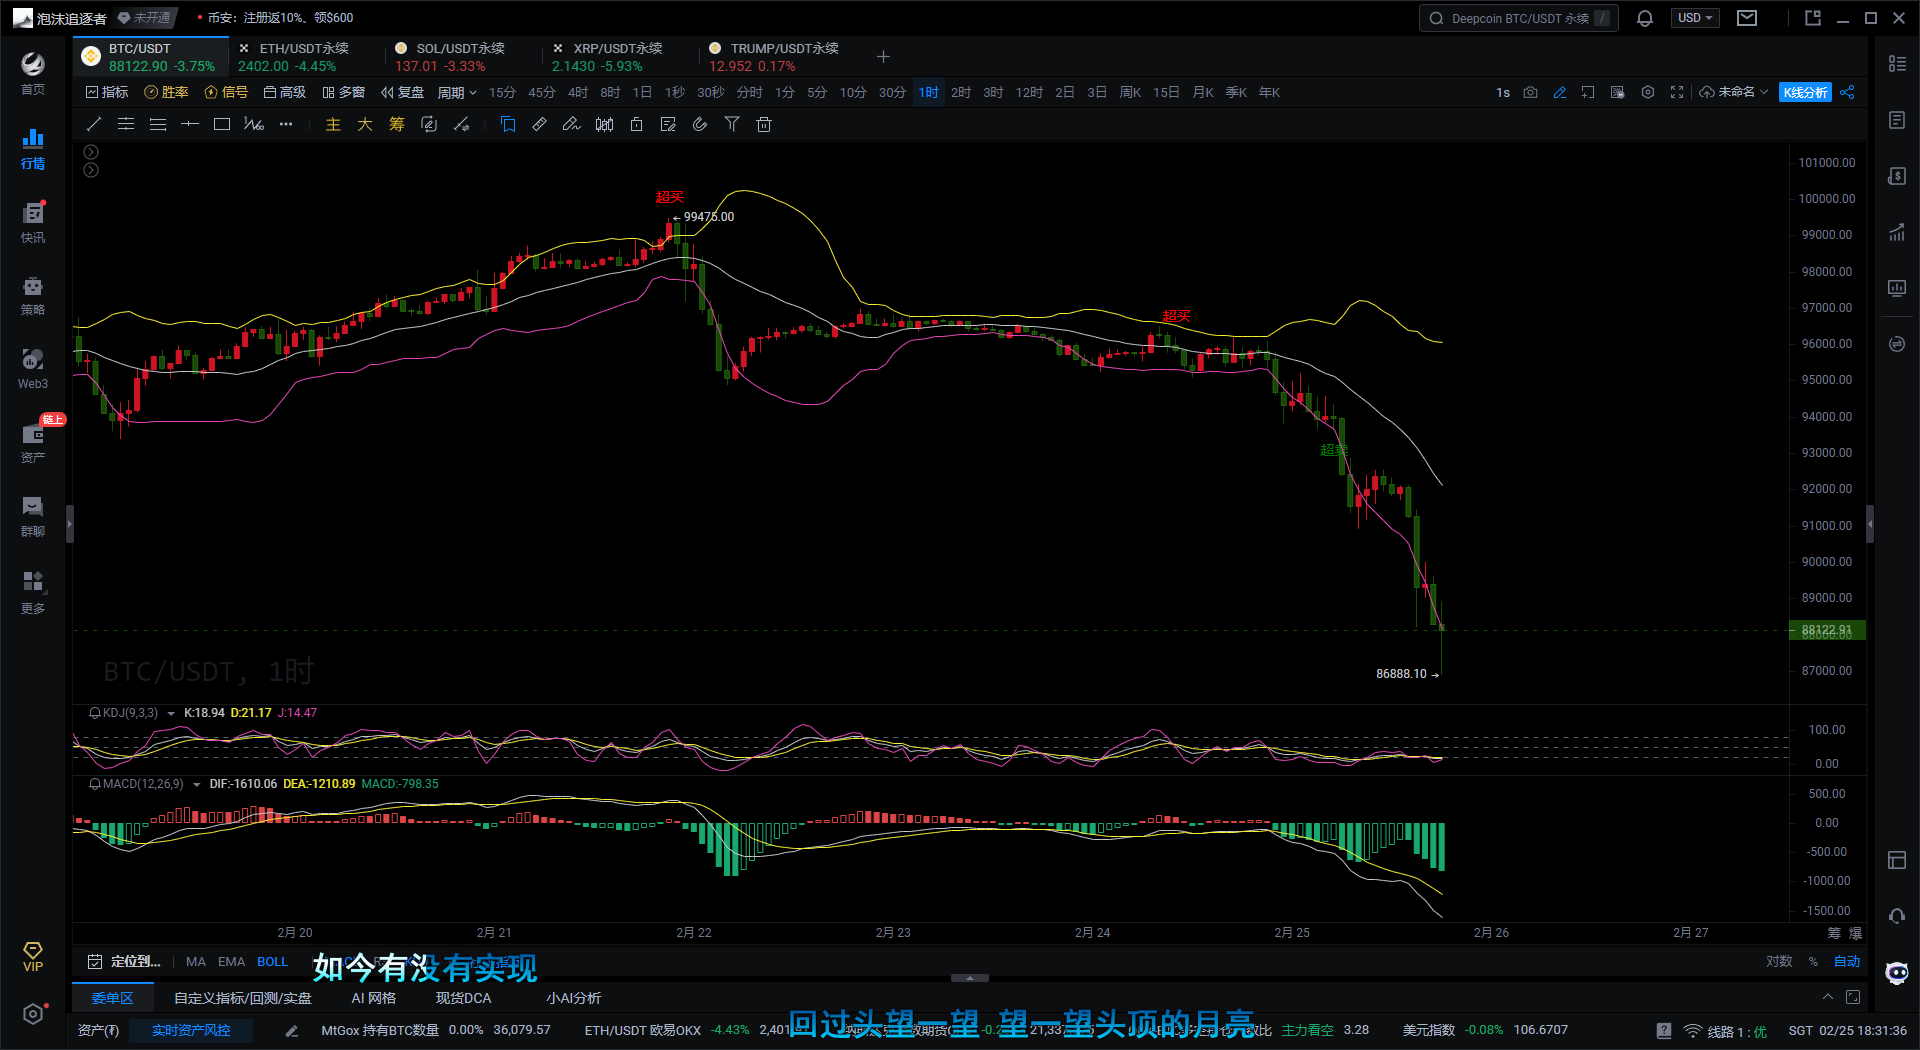
First, according to the Bollinger Bands indicator on the Bitcoin 1H chart, the middle band continues to move downward, and the price has broken through the lower band, clearly reflecting the bearish trend in the market. At the same time, the narrowing of the Bollinger Bands indicates that market volatility is decreasing, but this may only be temporary. As the price continues to decline, volatility may gradually increase, especially as the price approaches the lower band support.
Second, based on the KDJ indicator on the Bitcoin 1H chart, both the K and D values are currently in the oversold zone below 20, indicating that the market is temporarily leaning towards bearishness with significant selling pressure. However, the K value is attempting to cross above the D value, signaling a potential rebound in the short term. Meanwhile, the J value remains in the negative zone, indicating that downward pressure still exists. Overall, the golden cross signal of the KDJ suggests that the market may experience a slight rebound in the short term.
Finally, according to the MACD indicator on the Bitcoin 1H chart, both the DIF and DEA lines are operating below the zero axis and continue to show a downward trend, strongly indicating that the bearish trend in the market is very evident and strong. Meanwhile, the green histogram is gradually increasing, highlighting the dominance of selling power in the market. There are no signs of a shortening histogram, indicating that selling power may continue to maintain an advantage in the market, and the bearish trend may persist in the short term.
In summary, Bitcoin currently shows a clear bearish trend, with both the Bollinger Bands and MACD indicators indicating strong downward momentum. Although the KDJ shows a rebound signal in the oversold zone, it is highly likely that the bearish market will continue in the short term.
Therefore, the following suggestion is provided for reference: short Bitcoin at a rebound to $89,000-$89,300, targeting $87,000, with a stop loss at $90,000.
Instead of giving you a 100% accurate suggestion, it is better to provide you with the correct mindset and trend. After all, teaching someone to fish is better than giving them fish; the suggestion may earn you a moment, but learning the mindset will help you earn for a lifetime! The focus is on the mindset, grasping the trend, and planning the market layout and position. What I can do is use my practical experience to help you, guiding your investment decisions and management in the right direction.
Writing time: (2025-02-25, 18:00)

(Written by - Master Says Coin) Disclaimer: Online publication has delays, and the above suggestions are for reference only. The author is dedicated to research and analysis in the investment fields of Bitcoin, Ethereum, altcoins, forex, stocks, etc., with years of experience in the financial market and rich practical operation experience. Investment carries risks; please proceed with caution. For more real-time market analysis, please follow the official account Master Says Coin for discussion and exchange.
免责声明:本文章仅代表作者个人观点,不代表本平台的立场和观点。本文章仅供信息分享,不构成对任何人的任何投资建议。用户与作者之间的任何争议,与本平台无关。如网页中刊载的文章或图片涉及侵权,请提供相关的权利证明和身份证明发送邮件到support@aicoin.com,本平台相关工作人员将会进行核查。