Do not worry about having no friends on the road ahead; there are like-minded individuals on the investment journey. Good afternoon, everyone! I am the King of Coins from the Coin Victory Group. Thank you all for coming here to watch the King’s articles and videos, and I hope the brothers who have been following the King will return.
**Click the link to watch the video: **https://www.bilibili.com/video/BV1SSPLebEu2/
Bitcoin and Ethereum Market Analysis Report (February 26, 2025)
I. Overview of Market Dynamics
The current cryptocurrency market is in a recovery phase after significant volatility. Bitcoin initially stopped falling after a sharp drop to a low of $86,000 on February 25, while Ethereum rebounded after dipping to $2,280. Market sentiment is influenced by multiple factors, including technical support, institutional capital flow, and macroeconomic expectations. In the short term, attention should be paid to key support levels and the correlation with news events. The following analysis will cover technical indicators, market sentiment, on-chain data, and institutional perspectives.

II. In-Depth Analysis of Bitcoin (BTC)
Key Technical Signals
Monthly Support Battle: The current Bitcoin price is repeatedly contesting around $90,300 (MA5 monthly moving average). If it fails to hold this position, it may further test the weekly MA30 moving average support at $81,500.
Weekly Arc Top Pattern Verification: If the weekly level confirms an arc top pattern, the measured decline may exceed expectations, requiring consideration of changes in trading volume (increased volume during the right arc phase is a key signal).
Short-Term Rebound Signals: The 4-hour chart shows consecutive bullish candles and stability above the MA5 daily moving average. If it breaks through the $89,500 resistance, it may test the $93,000 pressure level; conversely, if it falls below $86,000, a second bottom test should be watched.
On-Chain Data and Capital Flow
Exchange Inventory: Recently, BTC inventory on exchanges has slightly increased by 2,000 coins, indicating some selling pressure remains, but the proportion of long-term investors' holdings is rising, and the distribution of chips is stabilizing.
Active Address Count: The number of daily active addresses on-chain is close to 1 million, the highest level since 2021, indicating increased market participation, but caution is needed regarding short-term speculative behavior that may lead to increased volatility.
Impact of News Events
GBTC Selling Pressure: The bankrupt FTX institution continues to reduce its GBTC holdings (cumulative sales worth $1 billion), which may indirectly pressure the BTC spot market.
Halving Cycle Effect: After the halving in 2024, market supply will tighten, but the current price has not fully reflected the supply-demand balance post-halving, requiring attention to miner selling dynamics.
III. Multi-Dimensional Analysis of Ethereum (ETH)
Technical Patterns and Key Indicators
Significance of Daily Long Lower Shadow: The lower shadow on February 25 shows strong buyer support near $2,280. If the daily closes above the MA256 moving average ($2,110), a rebound may begin; conversely, if it fails to hold, it may test the psychological level of $2,000.
Moving Average System Stalemate: The short-term MA5/MA10/MA20 moving averages are entangled in the $3,310-$3,330 range, indicating a balance of bullish and bearish forces. A breakout above $2,580 may trigger a corrective rally.
Weekly MA120 Contest: The current ETH price is oscillating around the MA120 weekly moving average. If it holds this position, it may recover above $2,800; if it breaks below, attention should be paid to the liquidation risks of DeFi protocols.
Gas Fees and Network Activity
Gas Fees Operating at Low Levels: Current gas fees are stable at 6-8 Gwei, the lowest level since August 2024, indicating alleviated network congestion, which may attract more DeFi protocol deployments.
DeFi Locked Value Rebound: TVL has increased to $50 billion (up 5% month-on-month), with low gas costs driving increased trading volume for protocols like Uniswap, but attention should be paid to Layer-2 diversion effects.
ETF and Institutional Expectations
ETH ETF Approval Expectations: If the Ethereum spot ETF is approved, institutional capital inflow may push prices to break historical highs ($4,108), but caution is needed regarding selling pressure after positive news is realized.
Institutional Rating Preferences: Mainstream institution 1confirmation predicts that ETH's market value will surpass BTC in the next five years, with its Layer-2 ecosystem and RWA (real asset tokenization) seen as core growth points.

IV. Market Correlation and Capital Rotation
BTC/ETH Correlation
Signs of Capital Rotation: Recently, there has been a net outflow of 210,000 ETH from exchanges, indicating that funds may be shifting to the altcoin market. If BTC stabilizes, ETH may benefit from the onset of Altseason.
Exchange Rate Fluctuations: If the ETH/BTC exchange rate breaks above 0.055, it may confirm ETH's relative strength; conversely, if it falls below 0.05, caution should be exercised regarding an overall market pullback.
Stablecoins and Liquidity
USDT Dominance: The total market value of stablecoins has stopped declining and is rebounding, with USDT accounting for over 70%, indicating an increased willingness of off-exchange funds to enter the market, but attention should be paid to the impact of the Federal Reserve's interest rate policy on liquidity.

V. Operational Strategies and Risk Warnings
Short-Term BTC Strategy
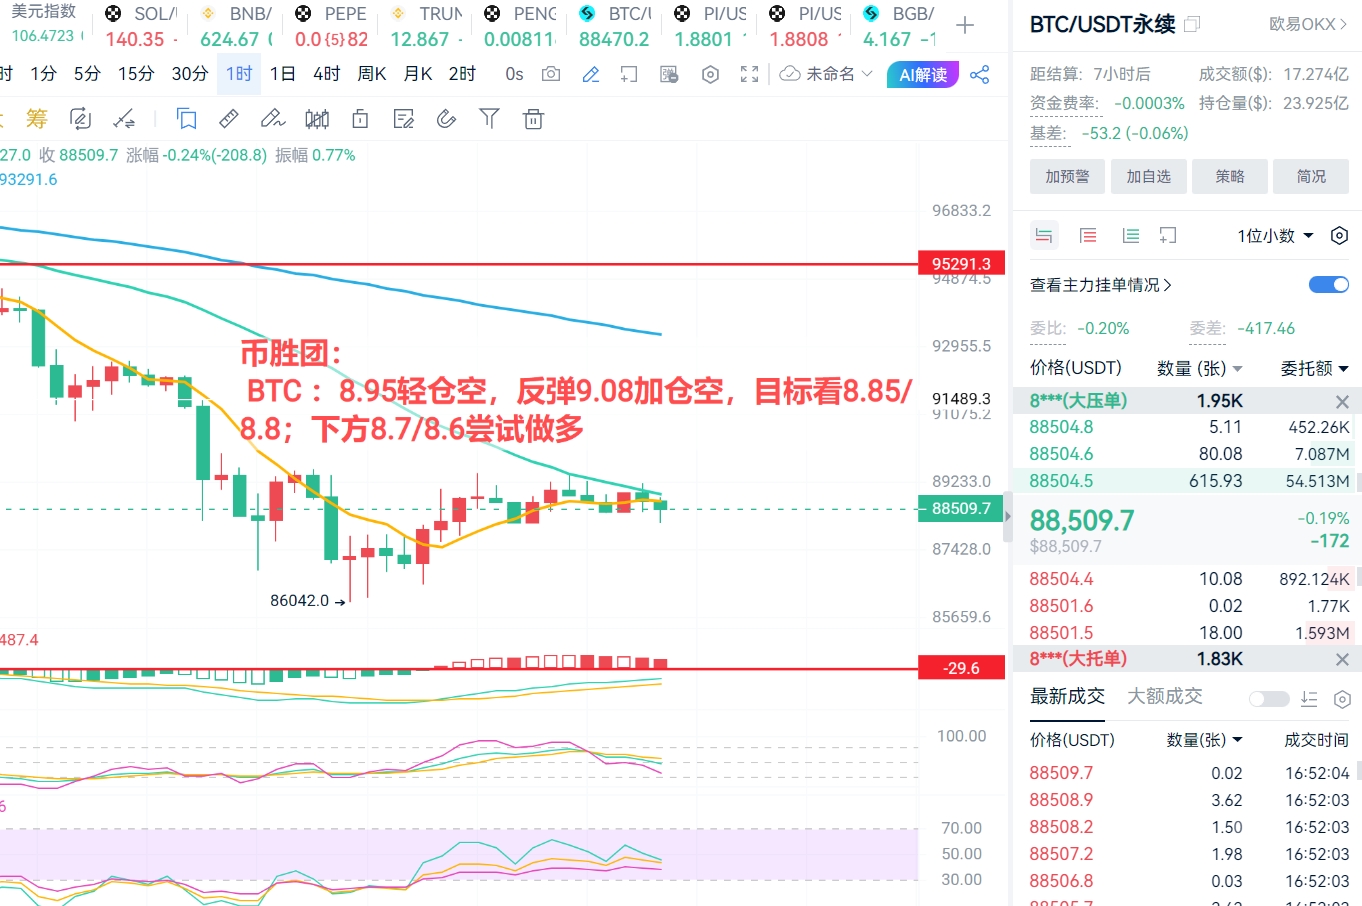
Short Position Range: Light short at $89,500, add to the position at $90,800, target $88,000; if it falls below $86,000, then observe.
Long Position Range: Attempt long at $87,000, stop loss at $85,000, target $91,000.
ETH Swing Opportunities
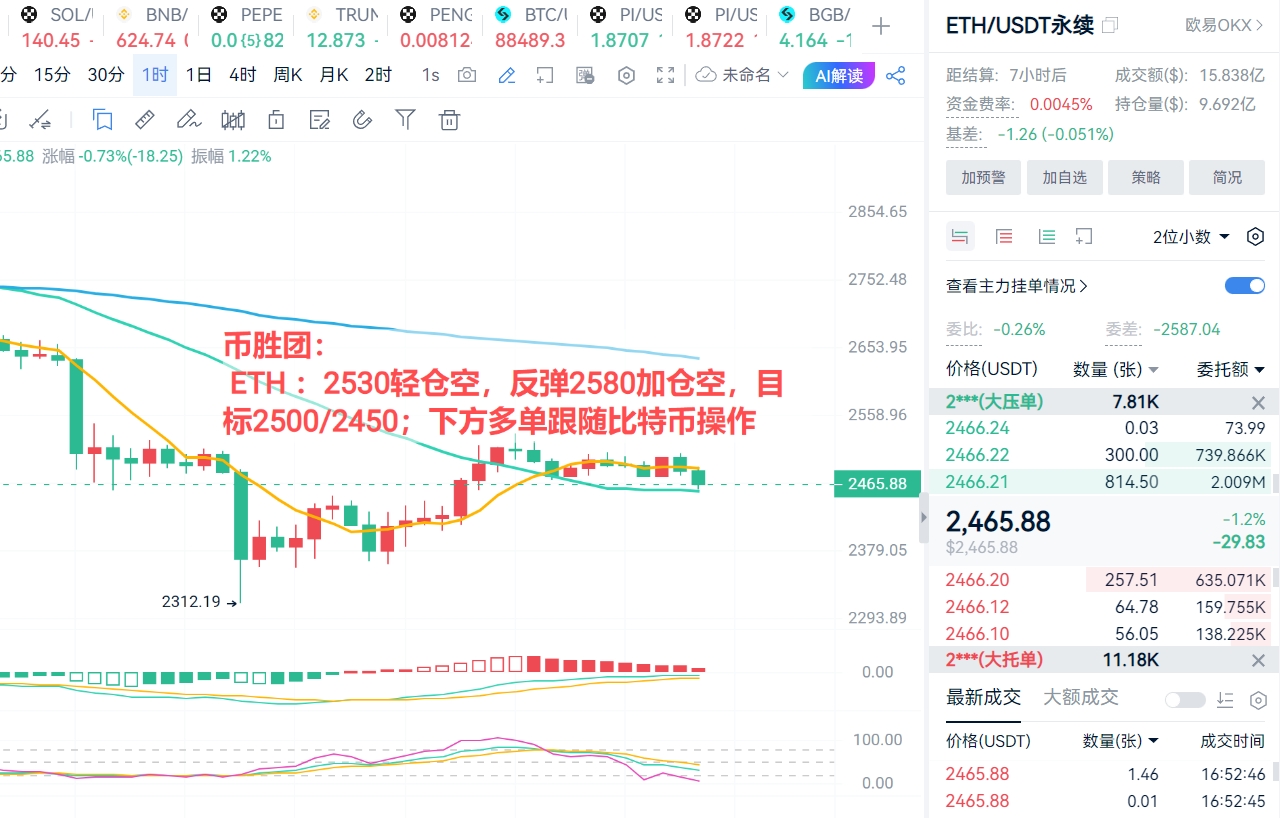
Short at Resistance: Short in batches at $2,530-$2,580, target $2,450; stop loss above $2,600.
Long at Support: Long in batches at $2,350-$2,280, target $2,500.
Risk Warnings
Macro Policy Risk: The Federal Reserve's interest rate decisions and Trump's economic policies may trigger significant market volatility.
Technical Failure Scenarios: If the BTC weekly arc top is not confirmed or ETH breaks through key moving averages, timely stop-loss and directional adjustments are necessary.

VI. Summary and Outlook
The current market is at a critical juncture of bullish and bearish transitions. Bitcoin needs to hold the monthly support to restore confidence, while Ethereum relies on the DeFi ecosystem and institutional capital inflow to maintain rebound momentum. In the medium to long term, ETH's progress in Layer-2 expansion and RWA may become the core driving force to surpass BTC, while BTC's halving cycle and ETF capital inflow remain the foundation for price centralization. Investors should closely track on-chain data and policy trends to flexibly respond to short-term volatility.

This article is independently written by the Coin Victory Group. Friends in need of current price strategies and solutions can find the Coin Victory Group online. Recent market trends have been primarily characterized by fluctuations, accompanied by intermittent spikes. Therefore, when making trades, please remember to control your take-profit and stop-loss levels. In the future, when facing significant market data, the Coin Victory Group will also organize live broadcasts across the internet. Friends who wish to watch can find the Coin Victory Group online and contact me for the link.
Mainly focused on spot, contracts, BTC/ETH/ETC/LTC/EOS/BSV/ATOM/XRP/BCH/LINK/TRX/DOT
Specializing in strategies around high and low support and resistance for short-term swings, medium to long-term trend trades, daily extreme pullbacks, weekly K-top predictions, and monthly head predictions.
免责声明:本文章仅代表作者个人观点,不代表本平台的立场和观点。本文章仅供信息分享,不构成对任何人的任何投资建议。用户与作者之间的任何争议,与本平台无关。如网页中刊载的文章或图片涉及侵权,请提供相关的权利证明和身份证明发送邮件到support@aicoin.com,本平台相关工作人员将会进行核查。


