Every pullback at this moment is a ticket reserved by history for the awakened.
Written by: Daii
This morning, Bitcoin's price fluctuated again, dropping below the $77,000 mark and currently oscillating around $80,000. The market seems to have entered another "pullback moment." In the face of price fluctuations, many friends are likely pondering the same question:
Is it time to "exit to avoid risk" or "enter at a low"?
This question seems simple, yet it is complex. Especially in the cryptocurrency market, where short-term volatility is intense and various information noise intertwines, it is easy to lose direction. When we find ourselves in a "pullback moment," we need a calm reflection, pulling our gaze away from the immediate price fluctuations and examining them within a broader framework of "trends" and "cycles."
Indeed, whether Bitcoin can continue to move forward is a common question among all "passengers." But as we will discuss today, hidden within "trends above, cycles between" are key clues to answering this question.
Today, I will guide you through a cold reflection on Bitcoin's "pullback moment" using the framework of "trends and cycles." First, let us start by understanding the basic concepts of "trends" and "cycles."
A picture is worth a thousand words. The following chart can quickly give us an intuitive understanding of "trends" and "cycles." Please note that the vertical axis of the chart is a logarithmic scale, where the height from 0 to 1 is equal to that from 1 to 10, which helps to clarify early price changes.
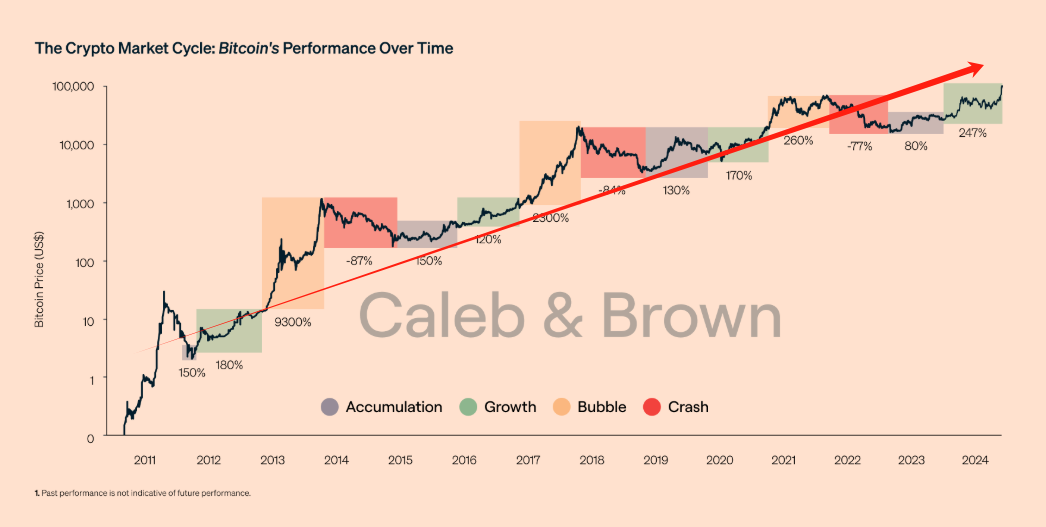
Trend: The continuously upward red arrow represents the long-term upward trend of Bitcoin's price. Will this trend continue? This is the key question we will focus on today, and it will be discussed in detail later. Several important long-term indicators will fill you with confidence about Bitcoin's future.
Cycle: The four differently colored blocks represent different stages of a cycle. The stages of the first three cycles are relatively clear, but the division of the fourth stage, which began in 2023, is not only incomplete but also highly controversial. This is something I need to emphasize today. An important contrarian indicator should make it easy for you to decide to "get on board."
Through the chart above, I believe you should have a relatively intuitive perception of trends and cycles. Now, let’s take a closer look at what exactly is a trend? What is a cycle?
- What are trends and cycles?
To understand any market, one must first distinguish between the two key concepts of "trends" and "cycles," and the cryptocurrency market is no exception.
Trend: A trend is the long-term direction of the development of things, a grand and enduring force. It represents the most essential and core direction of things, like a river that flows endlessly; once formed, it is difficult to reverse.
Cycle: A cycle is the short-term fluctuations that occur during the development of things, a rhythmic change that oscillates around the trend line.
In simple terms, cycles exist within trends. However, this simple inclusion is not enough to express the complex relationship between them. If we compare "trends" to the trunk of a tree, then "cycles" can be likened to the rings on that trunk.

Just as the trunk of a tree determines how tall it can grow and in which direction, the growth of trees is not always smooth; it is influenced by various factors such as seasons, climate, and soil fertility, which leave marks of "rings" on the trunk.
Applying this analogy to the Bitcoin market.
The long-term trend of Bitcoin is shaped by macro factors such as technological innovation, global adoption, institutional entry, and policy evolution, determining the long-term upward or downward direction of Bitcoin's price. Once this trend is formed, it is like a river that flows endlessly; even if the road ahead is winding, it is difficult to change its ultimate direction toward the sea.
The short-term cycles of Bitcoin are influenced by market sentiment, macroeconomics, sudden events, and capital flows, akin to the rolling waves in a river. Although they are spectacular, they are ultimately transient phenomena within the long river of trends. In the Bitcoin market, the alternation of bull and bear markets, as well as the short-term ups and downs in price, all belong to the realm of cycles.
However, many times, we cannot distinguish what is a trend and what is a cycle. Why is that?
- Why is it difficult to distinguish between "trends and cycles"?
The reason is simple yet deeply rooted in human nature and the complexity of the market.
The human brain is inherently more sensitive to "changes," especially short-term and drastic changes. Imagine standing in a forest; what first catches your eye are the leaves swaying in the wind and the squirrels jumping on the branches, not the towering ancient tree. Similarly, in the "digital forest" of cryptocurrency, our brains are more easily attracted by daily price fluctuations, confused by short-term "waves," and overlook the long-term flowing "river" — the long-term trend.
Especially in the Bitcoin market, the volatility is so intense that it can be described as a "storm" in the "digital ocean." A price surge or drop of 10% or even 20% within a single day is commonplace. Amid such drastic fluctuations, investors' minds are like small boats in turbulent waves, constantly battered by the towering waves before them, leaving little time to consider the vast ocean currents.

Moreover, human nature inherently dislikes losses and seeks to avoid harm. When prices fall and accounts shrink, the instinct of "loss aversion" makes us extremely anxious, wanting to quickly "cut losses" and exit, leaving no room to consider what "long-term trend" might be. Conversely, when prices surge, the desire for "greed" drives us to enter due to FOMO (Fear of Missing Out), fearing we might miss the opportunity to "get rich," and we are even less likely to think calmly about whether this is the power of a trend or merely the pulse of a cycle.
Even more strangely, the cyclical fluctuations in the Bitcoin market often have a strong deceptive quality; they frequently "change faces," disguising themselves as "trend reversals," making it difficult to discern the truth behind them.
Complicating matters further, the Bitcoin market is filled with various "noise" information, which acts like "fog," interfering with our judgment and making it hard to capture the true "signals" — the guidance of long-term trends.
Worse still, much of this "noise" information is often artificially created, deliberately released by market "whales" or "institutions" as "smoke screens," aimed at confusing perceptions and misleading retail investors to achieve their ulterior motives. For example, during market downturns, they spread various FUD (Fear, Uncertainty, Doubt) information to create panic, enticing retail investors to sell at low prices; while during market upswings, they release optimistic news to create a pleasant atmosphere, attracting retail investors to buy at high prices.
Thus, it is understandable that sometimes we cannot distinguish whether the current decline belongs to a "cyclical pullback" or a "trend reversal."
So, what is the current status of Bitcoin?
A cyclical pullback.
In fact, this answer hides an important premise — the overarching upward trend of Bitcoin has not changed. Is that really the case? This may be the biggest question mark in your mind. Therefore, we should first clarify this issue. Because only by understanding where a "ship" is headed can you decide whether you should "get on board."
- Why has the upward trend of Bitcoin not changed?
The answer lies in those grand, enduring forces, the cornerstones that shape Bitcoin's long-term trend. Even in the fog of short-term market pullbacks, these cornerstones remain rock-solid, shining with the direction that guides the trend.
3.1 Global Adoption Rate: 96% "Uncharted Territory," Indicating Vast Growth Potential
By 2025, only 4% of the world's population will hold Bitcoin.
At first glance, this data may seem disappointing, but from another perspective, it harbors incredible growth potential!
Imagine a massive market with billions of people, of which only 4% has been developed, leaving 96% "uncharted territory" waiting for us to explore and cultivate. Isn't this an exciting "blue ocean" market?
A research report from River Company also confirms this: Bitcoin has only achieved less than 4% of its maximum adoption potential. This means that the global path to Bitcoin's popularity is still in its "infancy," and there is a long way to go with extremely broad growth potential.
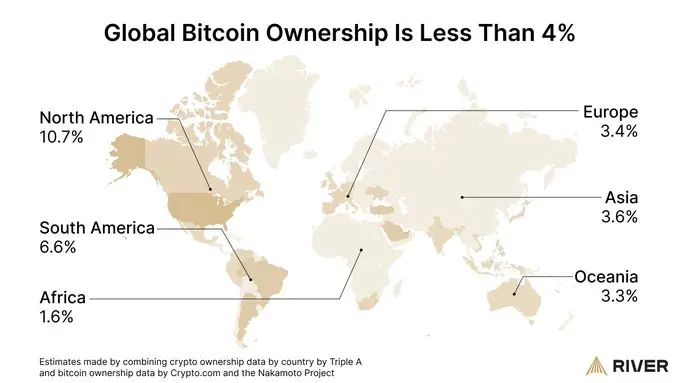
It is particularly noteworthy that developing countries and regions will be the main force driving the growth of Bitcoin adoption in the future. The report shows that North America currently has the highest Bitcoin adoption rate, while Africa's adoption rate is only 1.6%. This precisely indicates that there is still significant room for Bitcoin's popularity in economically underdeveloped areas.
So, what does this slightly over 3% global adoption rate mean? River's report provides an analogy, as shown in the chart below.
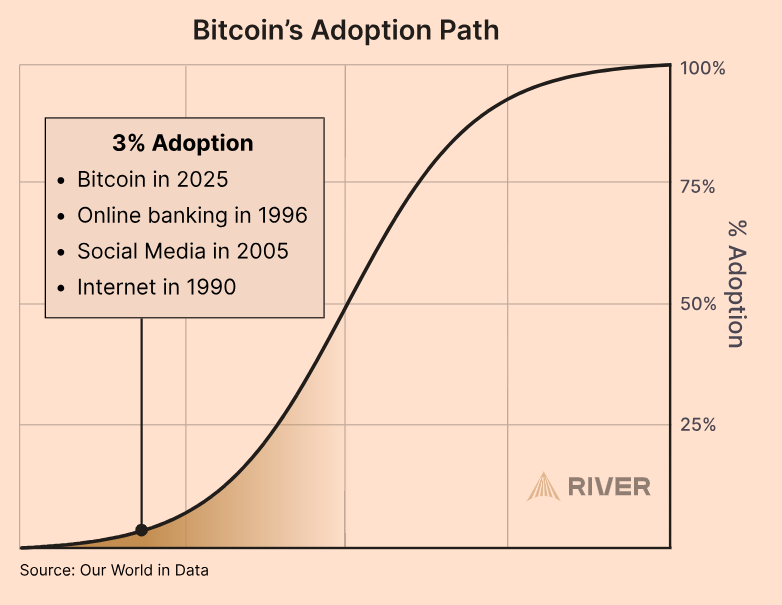
Such a low adoption rate is comparable to the internet in 1990, online banking in 1996, and social media in 2005. In other words, this is an era full of opportunities. Even if you haven't boarded yet, it's not too late; Taobao was not the first to do e-commerce, Google was not the first to do search, and Netflix was not the first to do online video.
Everything is just beginning. This 96% "uncharted territory" will be the most solid "demographic dividend" for Bitcoin's long-term upward trend!
3.2 The Three Driving Forces: Institutional Entry + Clear Regulations + National Reserves
Bitcoin, once "scoffed at" by traditional financial institutions, has now become the "darling" they are all eager to chase.
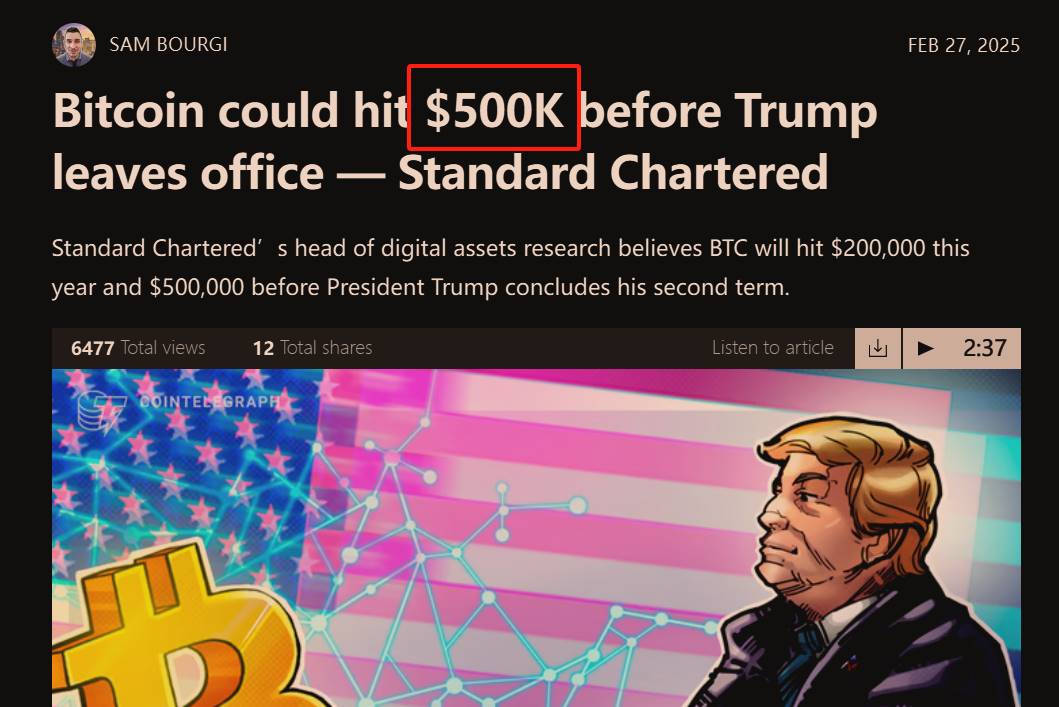
Standard Chartered predicts that Bitcoin's price will reach $500,000 during Trump's term, clearly stating that "growth in institutional adoption" is one of the key driving factors. Geoffrey Kendrick, head of digital asset research at Standard Chartered, believes that institutional participation will not only reduce volatility in the crypto market but also enhance market security. Additionally, Standard Chartered is the only institution that accurately predicted Bitcoin's current bottom — between $69,000 and $76,500.
Standard Chartered also believes that another driving factor is the establishment of a clearer regulatory framework in the United States.
The Trump administration not only established a "strategic Bitcoin reserve" but is also actively promoting stablecoin legislation. U.S. Congressman Bryan Steil has publicly stated that the U.S. has significant legislative opportunities in blockchain technology, Web3, and cryptocurrencies. Steil currently serves as the chairman of the U.S. House Digital Assets, Financial Technology, and Artificial Intelligence Subcommittee.
A research report from CoinShares also points out that establishing a strategic Bitcoin reserve in the U.S. will have a more profound long-term impact on Bitcoin adoption than the launch of ETFs. The current market severely underestimates the value of the U.S. strategic Bitcoin reserve, being more trapped by short-term liquidity. For a more detailed interpretation, I recommend reading "Digital Fort Knox: The White House's Conspiracy to Lock Up 190,000 Bitcoins."
In Europe, banks like DekaBank have begun supporting cryptocurrency trading, and Boerse Stuttgart Digital is actively promoting institutional-level applications of cryptocurrencies. All of this indicates that institutional funds are rapidly flowing into the Bitcoin market, and traditional financial giants are "running to enter."
As regulatory policies continue to clarify, the share of Bitcoin held by institutions and nations will grow larger, becoming the dominant force driving the long-term rise in Bitcoin prices.
3.3 Macroeconomic Improvement: PMI and M2 Indicate "Positive Reversal"
Despite the short-term "headwinds" brought by the Trump administration's tariff policies and the strengthening of the dollar index, from a more macroeconomic and policy perspective, the long-term upward trend of Bitcoin remains strongly supported.
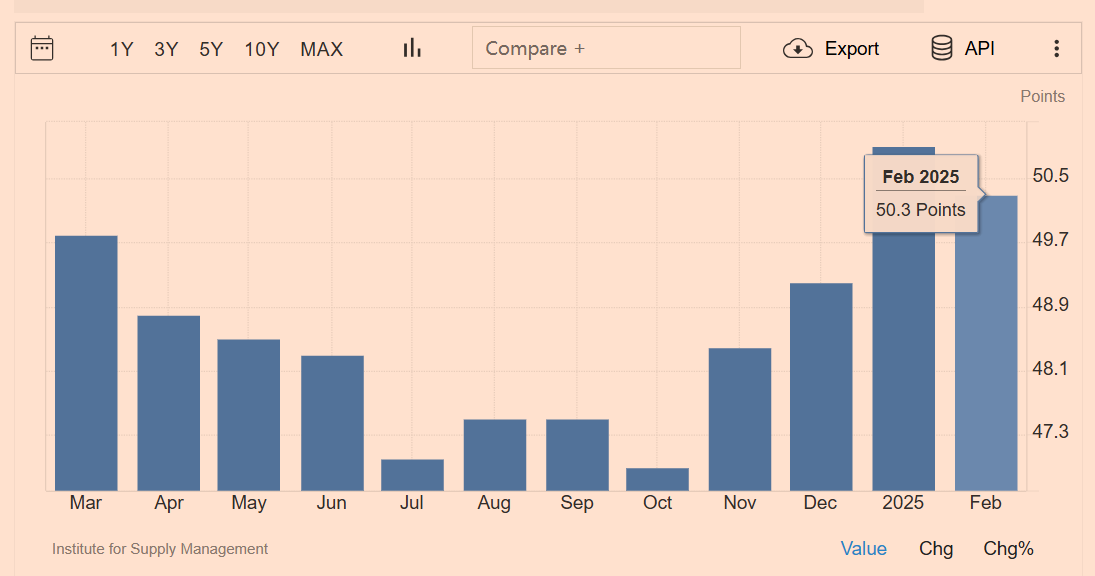
The U.S. manufacturing PMI has entered an expansion mode (above 50) for two consecutive months, which is seen as a signal of a "positive reversal in the business cycle." Raoul Pal, founder of Real Vision, points out that PMI leads the economy by about a month, and it not only leads the economy but also all assets. He believes that as the business cycle rises, Bitcoin is expected to peak by the end of 2025 or even early 2026.
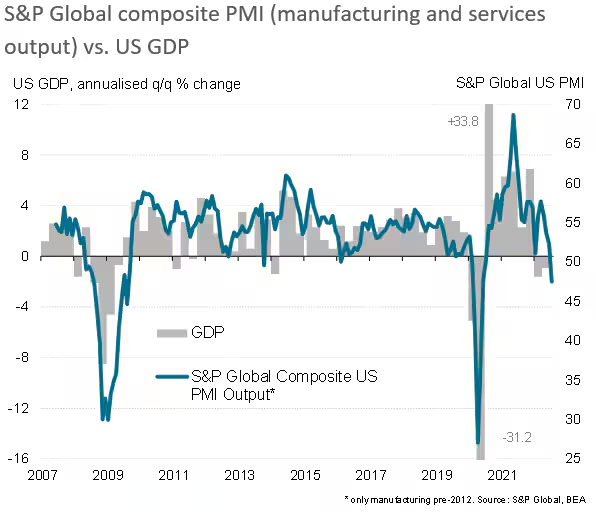
Research from S&P Global Market Intelligence supports Pal's view, as shown in the chart below. You will find that when the PMI on the right side is above 50, GDP shows varying degrees of growth. The research suggests that PMI data predicts "every turning point in returns over the past 14 years."
Another noteworthy indicator — the global M2 money supply — has also shown a trend of "sharp increase." Research from Real Vision indicates that Bitcoin's price typically reflects changes in global M2 over a period of about 10 weeks.
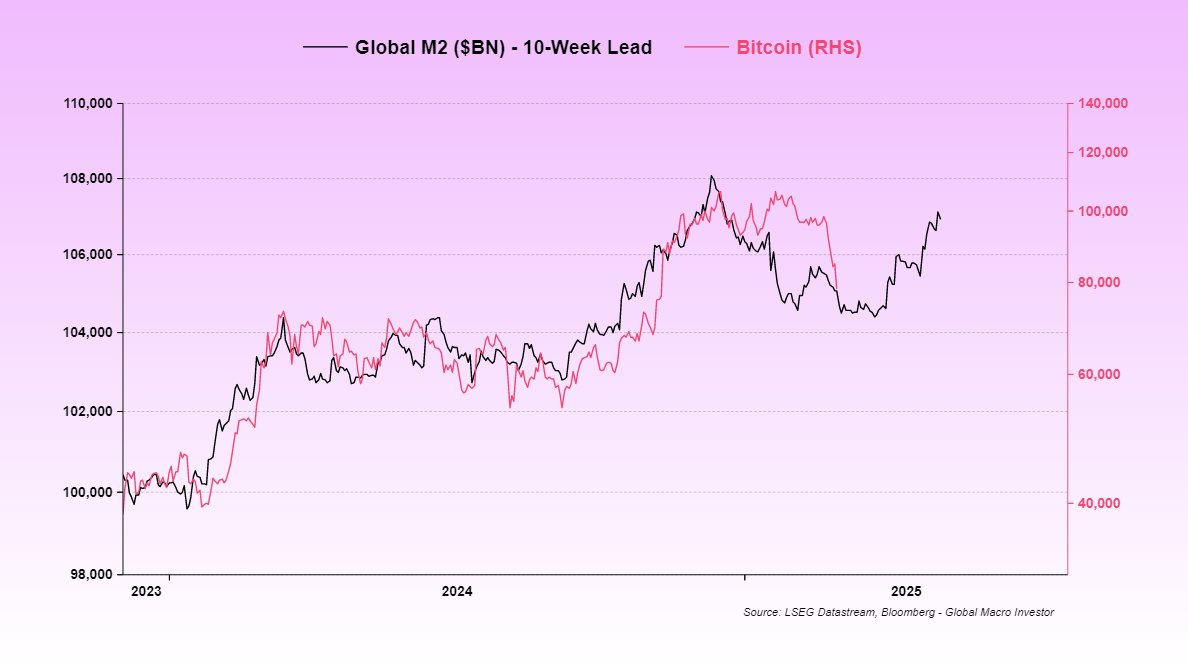
Analyst Colin Talks Crypto has even precisely calculated the "46-day and 72-day lags" in how changes in global M2 affect Bitcoin prices through data analysis. Lyn Alden also pointed out that "Bitcoin moves in the same direction as global liquidity 83% of the time over any given 12-month period, making it a strong barometer of liquidity conditions."
This means that the improvement in global macro liquidity will provide a strong "boost" for the rise in Bitcoin prices.
3.4 Summary: The Three Cornerstones of Bitcoin's Long-Term Trend
The long-term upward trend of Bitcoin remains unchanged, with core support coming from three irreversible macro forces:
96% Blue Ocean Market: Currently, only 4% of the global population holds Bitcoin, with adoption rates in developing countries below 2%. Its penetration rate is comparable to the internet in the 1990s, and its growth potential far exceeds the market's short-term fluctuations.
Institutional and National Strategic Entry: Standard Chartered predicts that Bitcoin could reach $500,000 during Trump's term, as the U.S. establishes a "strategic Bitcoin reserve" and accelerates stablecoin legislation. European banks like DekaBank have opened cryptocurrency trading, forming a triple thrust of "institutions + regulation + sovereign reserves."
Macroeconomic Cycle Resonance: The continuous expansion of the U.S. PMI indicates a reversal in the business cycle, and the growth rate of global M2 has a 46-72 day lagged correlation with Bitcoin prices. The easing of liquidity and Bitcoin's "digital gold" attributes create a long-term synergy.
Therefore, the short-term pullback to $77,000 is merely a cyclical wave, while the river of the trend continues to flow forward. So, is the price of $77,000 the bottom? Is now a good time to enter?
In fact, if you agree with my arguments about the trend above, the answer is self-evident. Although you may not buy at the lowest point, you also won't buy at a high point. The only thing you need to control is your desire; do not use too much leverage.
Conclusion: Be Friends with Time, Dance with Trends
History does not repeat itself, but it often rhymes. When gold flowed from the Americas to Europe, it created the wealth myth of the Age of Exploration; when the internet moved from laboratories into homes, it reshaped the way human civilization connects — today, we stand at the forefront of the digital asset revolution, witnessing Bitcoin's epic leap from code to a global value carrier.
When 96% of the global population has yet to hold Bitcoin, when sovereign funds begin to include crypto assets on their balance sheets, and when blockchain technology becomes a new battleground for major powers — this speeding "digital ark" has just left the dock that built it.
The secret to dancing with trends lies not in predicting the shape of the waves but in understanding the rhythm of the tides. Those investors who held onto Amazon during the internet bubble burst and those visionaries who heavily invested in Apple during the nascent stage of mobile internet all understand one truth: trends are never smooth straight lines but are composed of countless cyclical oscillations forming an upward spiral. Just like the current fluctuation at $77,000 is merely a brief chord in the symphony of crypto civilization, the main melody always rises toward the trust high ground built by hash power.
True dancers never need the spotlight to illuminate the entire path. When 96% of the audience is still watching from the sidelines, and when sovereign funds begin to adjust their rhythm, the wise have already marked their notes on the blockchain's score — they may miss a beat or stumble briefly, but as long as their feet remain on the tectonic plates of technological revolution, they will ultimately witness the reassembly of the financial continental shelf.
Trends are the sea, cycles are the boats; fools calculate the height of the waves, while the wise adjust the angle of the sails. Trends determine the overall direction of the market, while the fluctuations of cycles are short-term phenomena that rise and fall along the trend. When the twilight of the fiat currency system meets the dawn of the crypto economy, rather than chasing shadows in the K-line maze, it is better to leap into the torrent of digital civilization and board the ark lifted by the waves of the times.
Every pullback at this moment is a ticket reserved by history for the awakened.
免责声明:本文章仅代表作者个人观点,不代表本平台的立场和观点。本文章仅供信息分享,不构成对任何人的任何投资建议。用户与作者之间的任何争议,与本平台无关。如网页中刊载的文章或图片涉及侵权,请提供相关的权利证明和身份证明发送邮件到support@aicoin.com,本平台相关工作人员将会进行核查。


