On the 1-hour chart, XRP is exhibiting signs of a short-term uptrend, forming higher lows after a sharp decline. The price recently tested support near $2.07 and rebounded, indicating buying pressure at lower levels. Resistance is forming around $2.25, and a break above this level could signal further bullish momentum. However, failure to sustain above $2.20 may result in a retest of lower support. Volume analysis shows buyers stepping in, but the trend remains fragile until a decisive breakout is confirmed.
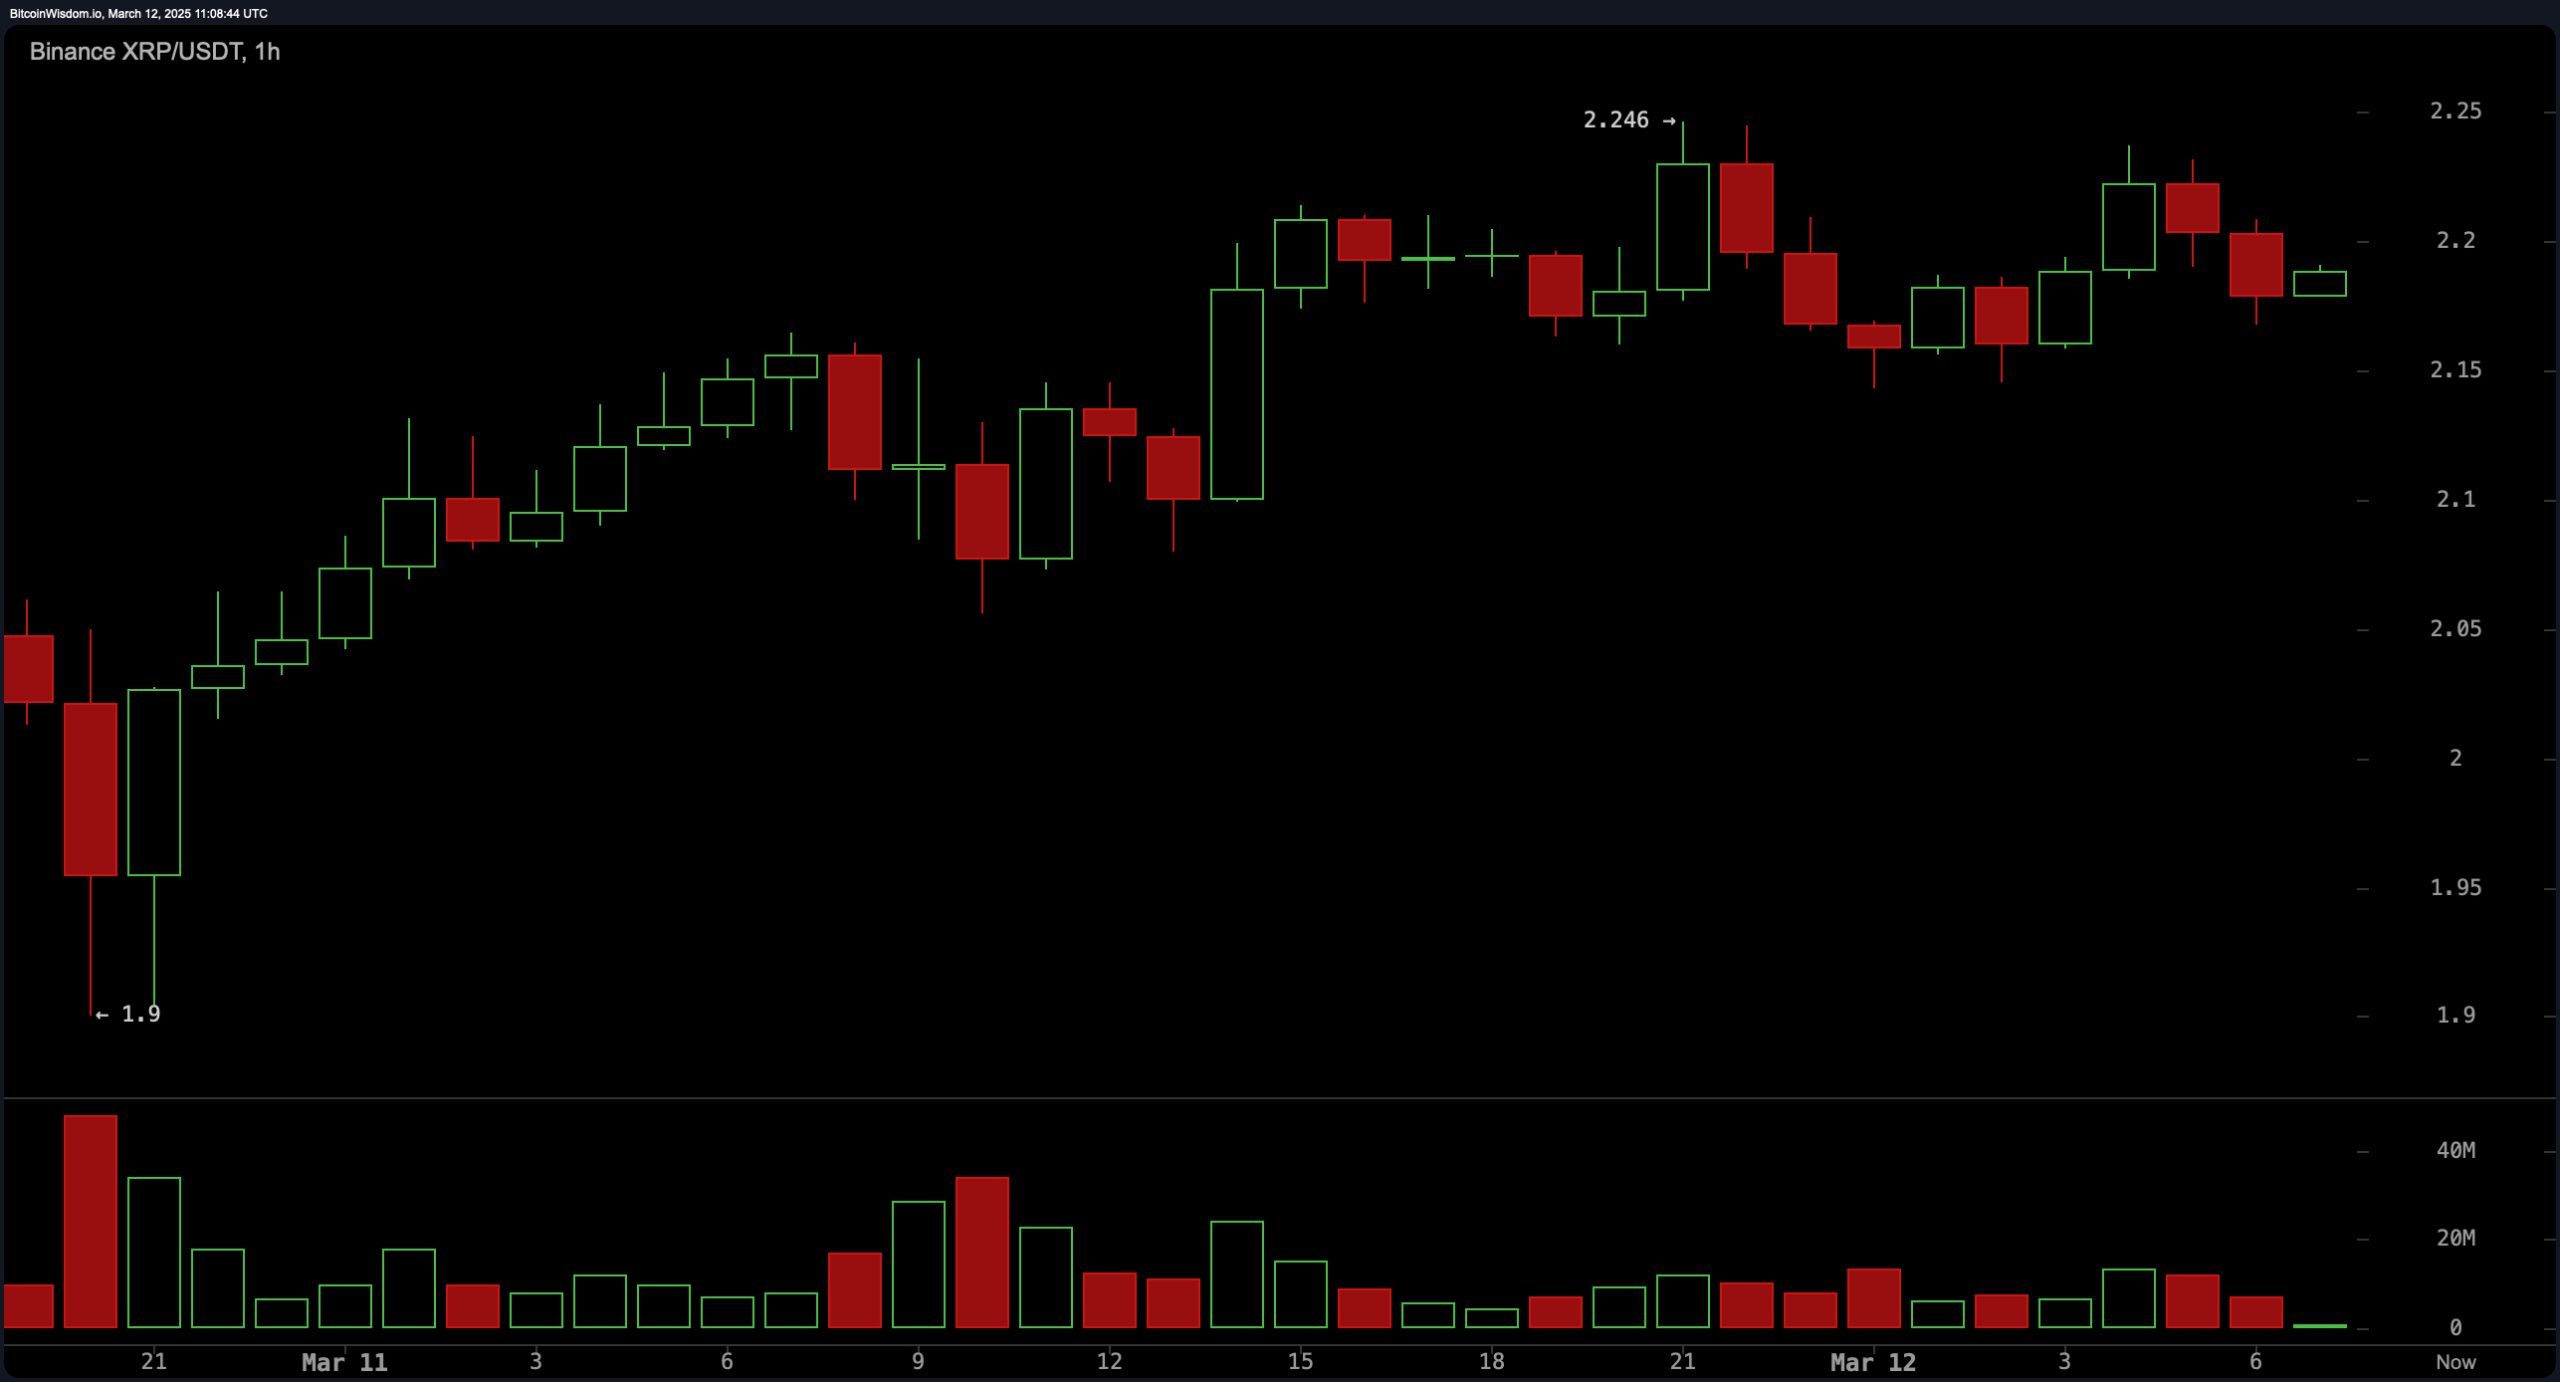
XRP/USDT 1H chart on March 12, 2025.
XRP’s 4-hour chart presents a broader perspective, showing that XRP recently found support at $1.90 and is now attempting to establish a higher range. The asset is facing resistance between $2.20 and $2.30, a zone that needs to be breached for a sustained recovery. The price action suggests a possible shift from a downtrend to consolidation, with increased volume supporting a potential breakout. A move above $2.30 could open the door to higher levels, while a failure to hold above $2.10 may lead to renewed bearish pressure.
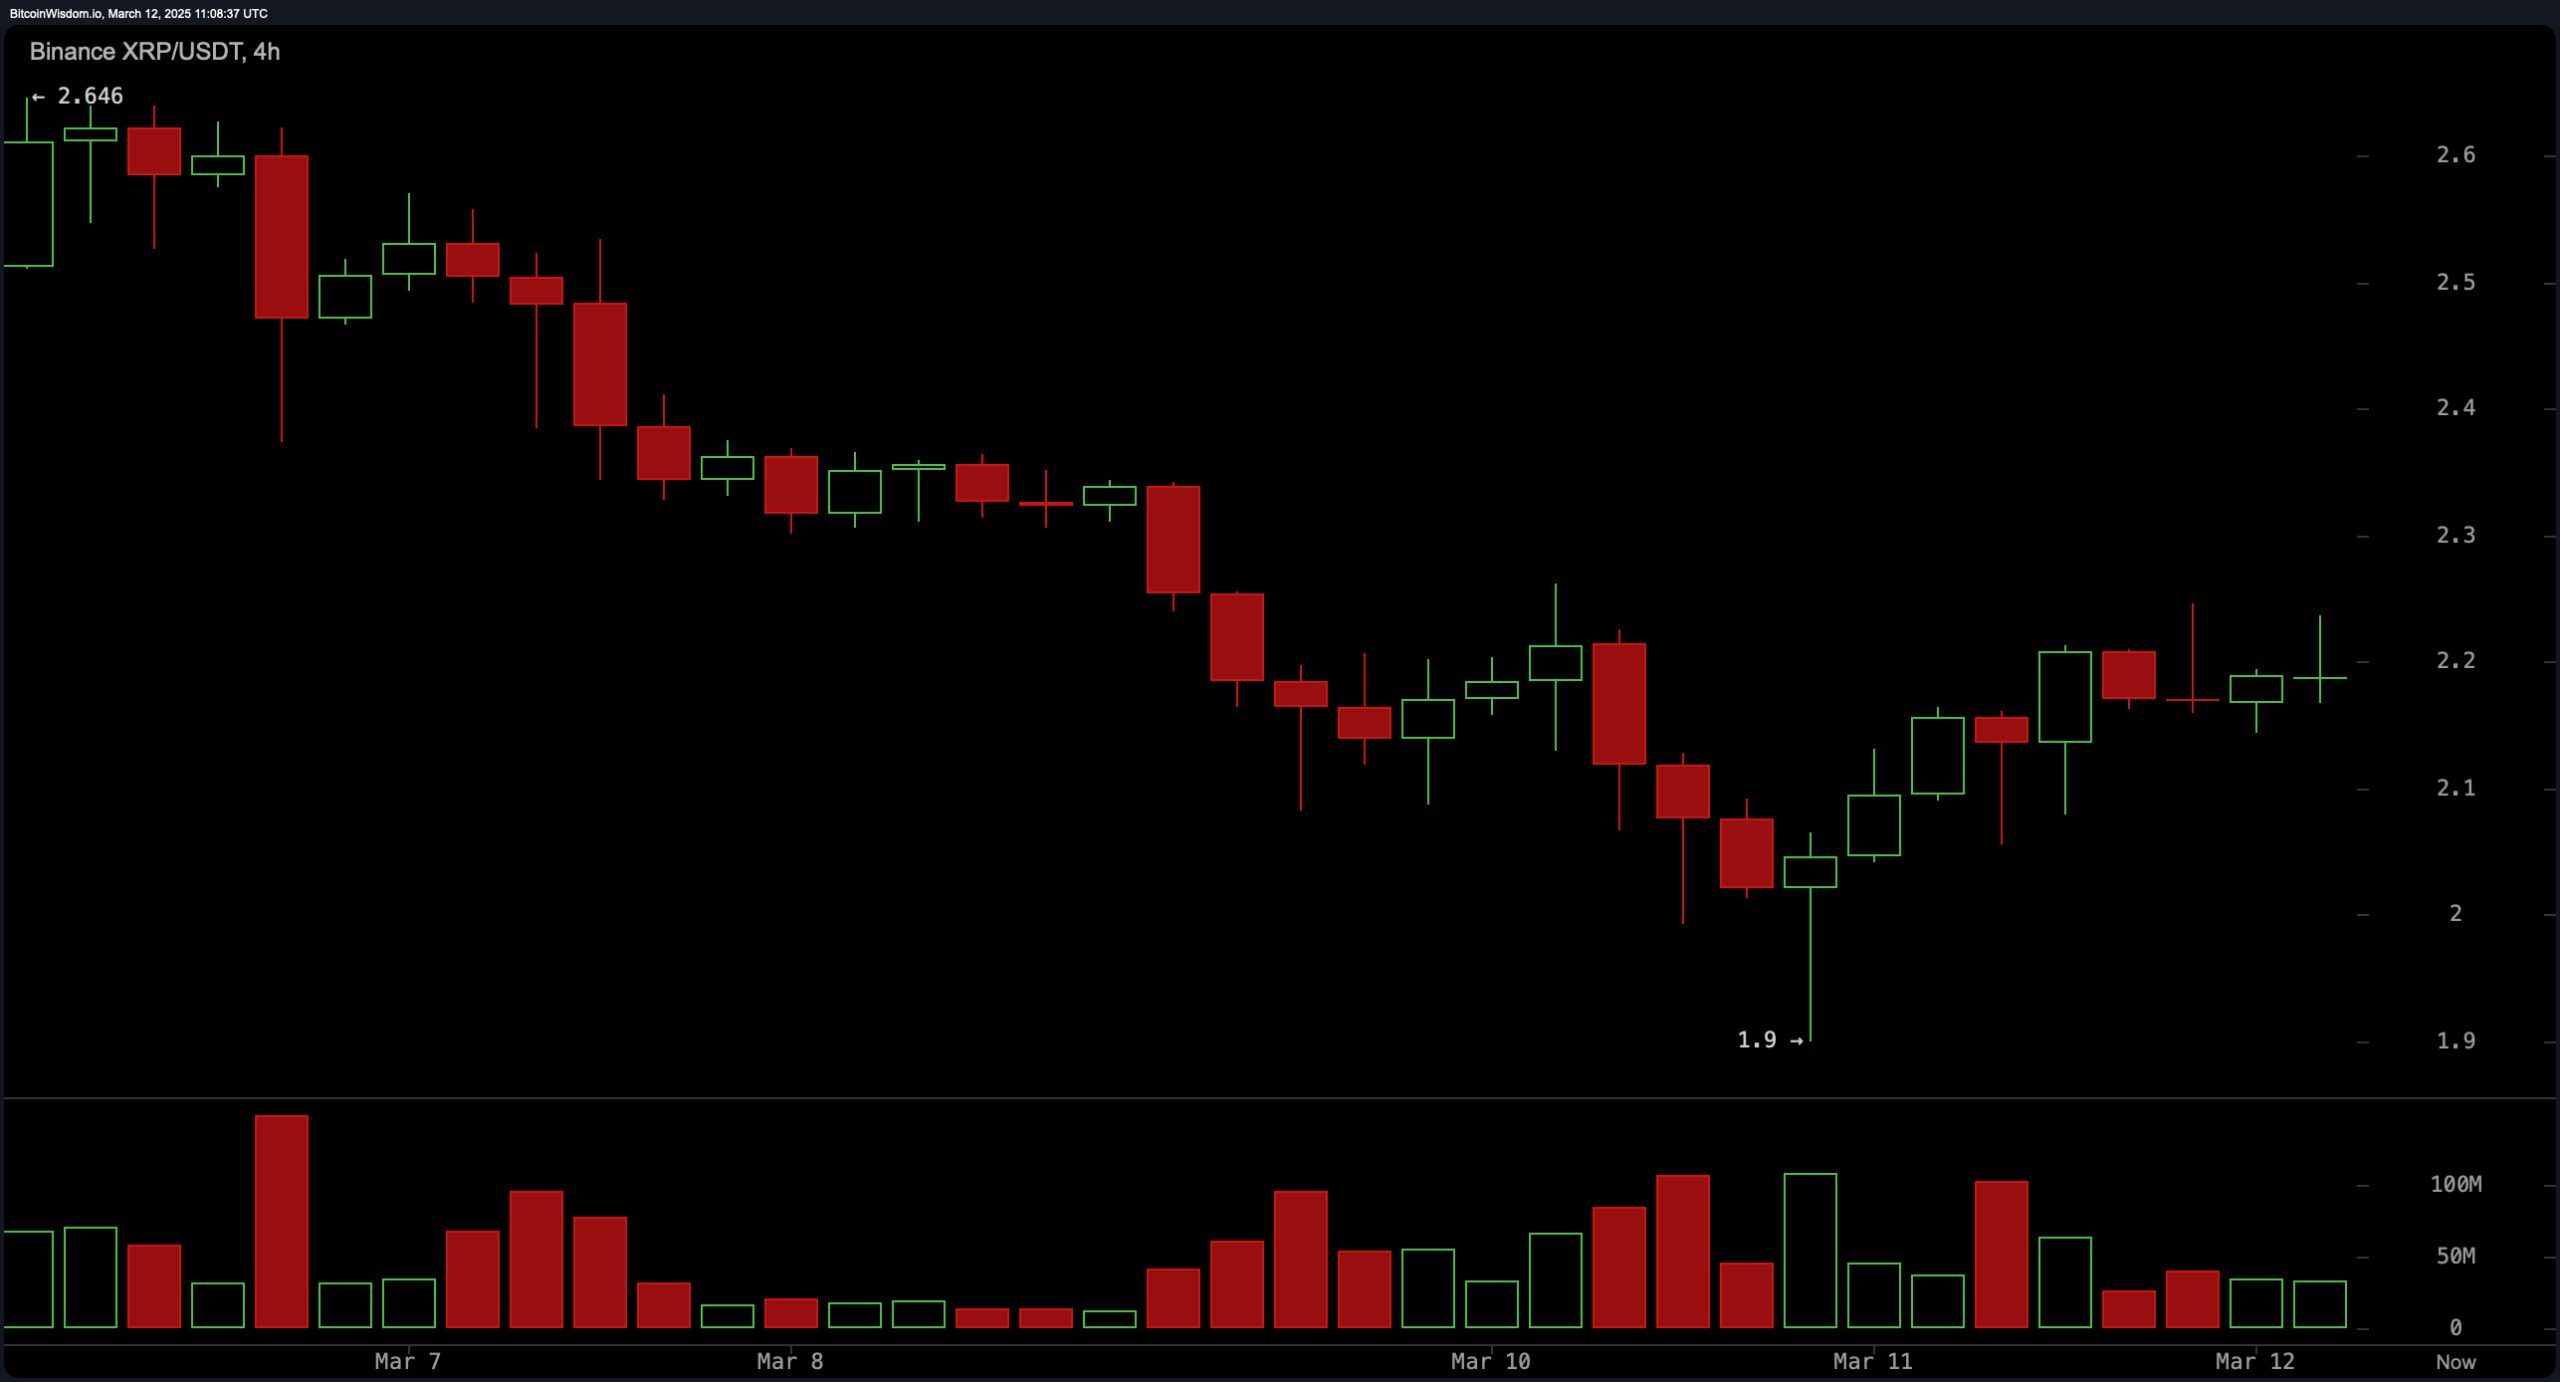
XRP/USDT 4H chart on March 12, 2025.
On the daily chart, XRP remains in recovery mode after a major rejection from the $3.00 level, which resulted in a sharp decline. The price is currently stabilizing between key support levels at $1.90 and $2.20, while resistance looms at $2.50 and $2.75. The recent downward momentum appears to be slowing, and a successful breakout above $2.50 could indicate a more significant trend reversal. Market sentiment remains cautious, as traders look for confirmation before committing to long positions.
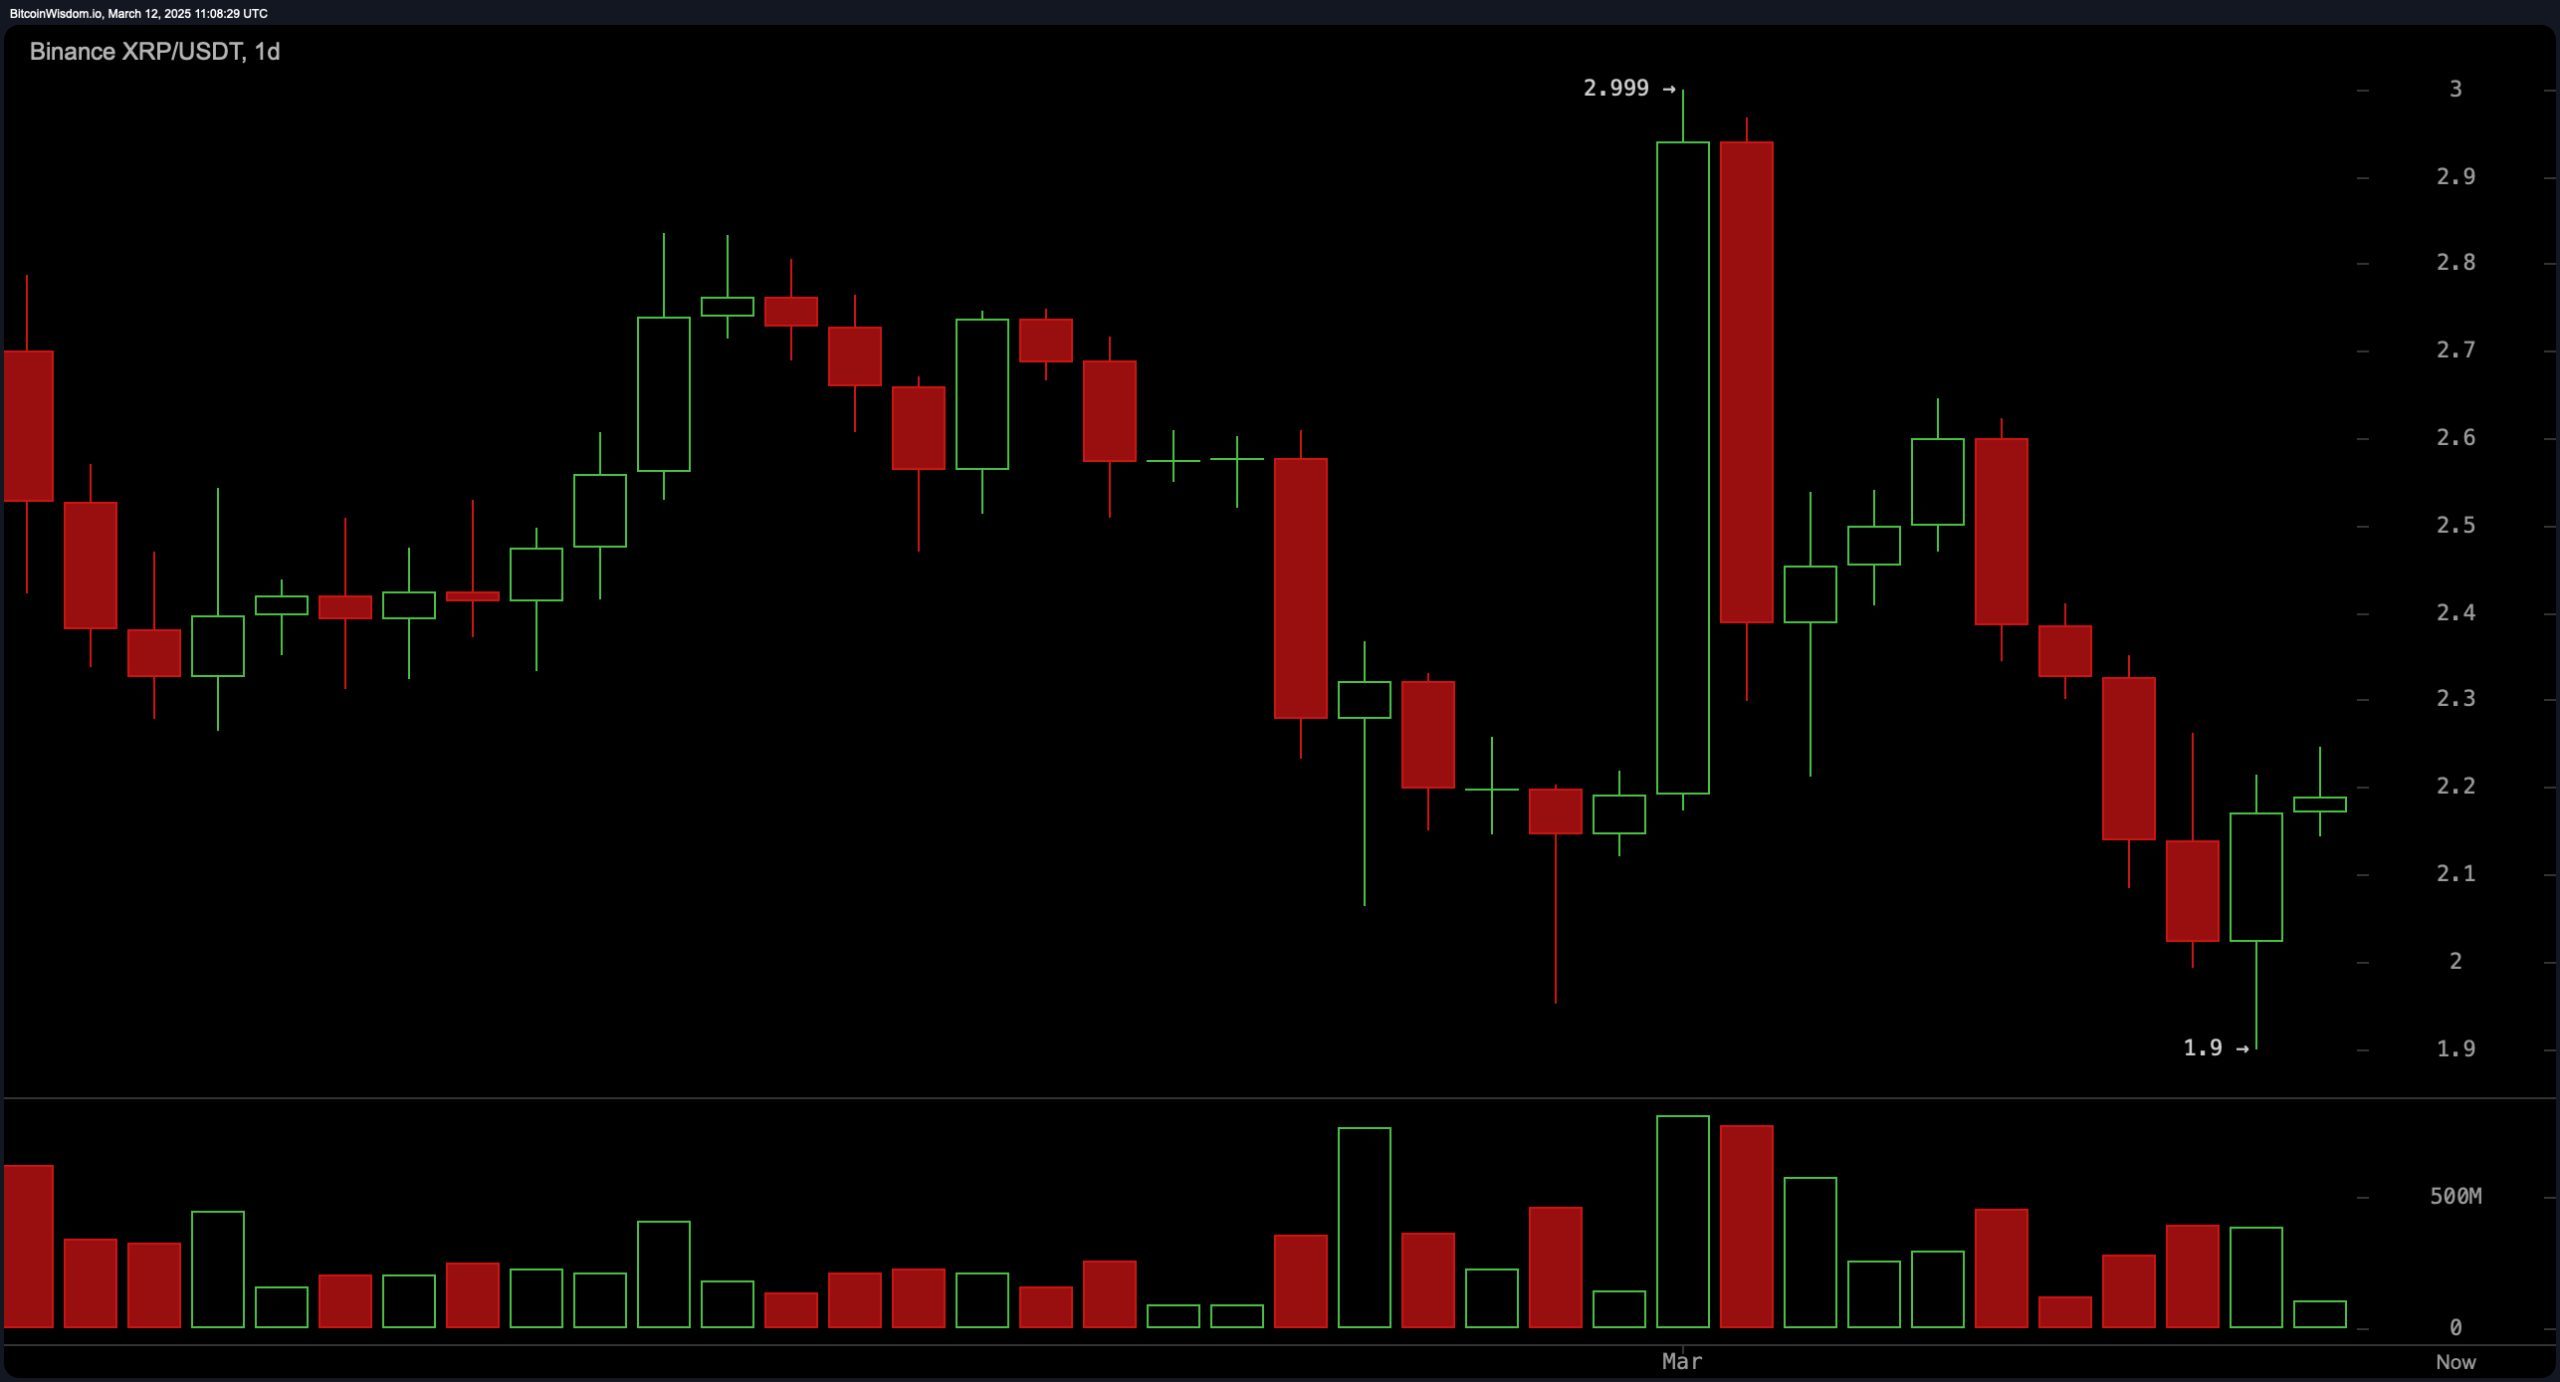
XRP/USDT 1D chart on March 12, 2025.
Oscillator readings provide a mixed outlook, with the relative strength index (RSI) at 43.81 in neutral territory, suggesting neither overbought nor oversold conditions. The Stochastic at 18.59 indicates a positive signal, while the commodity channel index (CCI) at -64.59 remains neutral. The average directional index (ADX) at 23.40 signals weak trend strength, and the awesome oscillator shows negative momentum at -0.24. The momentum indicator at -0.75 and the moving average convergence divergence (MACD) level at -0.10 both signal bearish sentiment, reinforcing the need for a confirmed breakout.
Moving averages (MAs) continue to indicate a bearish trend across most timeframes. The exponential moving averages (EMA) and simple moving averages (SMA) for 10, 20, 30, 50, and 100 periods are all signaling a sell. However, long-term moving averages, including the 200-period EMA at 1.86 and the 200-period SMA at 1.62, are giving buy signals, suggesting underlying support at lower levels. The alignment of these indicators implies that while short-term trends remain bearish, XRP’s long-term structure may still support a potential recovery if key resistance levels are broken.
Bull Verdict:
XRP’s price action is showing early signs of recovery, with strong buying support near $2.07 and a potential breakout above $2.30 on the horizon. The short-term uptrend, combined with increasing volume, suggests a shift in momentum. If XRP can surpass key resistance at $2.50 and maintain strength above $2.75, a bullish continuation toward $3.00 could be in play. The long-term moving averages also indicate underlying support, reinforcing the possibility of a sustained uptrend.
Bear Verdict:
Despite XRP’s recent bounce, the overall trend remains bearish, with multiple key resistance levels yet to be broken. Oscillators and moving averages suggest weak momentum, and failure to clear $2.30 could result in further downside pressure. If XRP loses support at $2.07 and falls below $2.00, a retest of lower levels, including $1.90 or lower, becomes increasingly likely. Until a decisive breakout occurs, the risk of further downside outweighs bullish prospects.
免责声明:本文章仅代表作者个人观点,不代表本平台的立场和观点。本文章仅供信息分享,不构成对任何人的任何投资建议。用户与作者之间的任何争议,与本平台无关。如网页中刊载的文章或图片涉及侵权,请提供相关的权利证明和身份证明发送邮件到support@aicoin.com,本平台相关工作人员将会进行核查。


