Source: Bitcoin Magazine Pro Team
Translation: BitpushNews
When investing in Bitcoin, you often find it difficult to understand the market's extreme price fluctuations. To comprehend these drastic changes, you compare Bitcoin's performance with traditional assets like stocks. This helps you see the bigger picture, and you quickly realize that while Bitcoin and the stock market often move in sync, their charts tell different stories. The comparative charts of Bitcoin and the stock market remain a key component of your Bitcoin investment strategy. In this guide, you will learn how to analyze and interpret these charts to make more informed and strategic investment decisions.
Is there a correlation between Bitcoin prices and the stock market?
When financial markets move in sync, they are considered correlated. For example, if the price of one asset rises or falls, and another asset moves in the same direction, they are positively correlated; if both move in opposite directions, they are negatively correlated; if price movements are unrelated, they are independent.
Correlation is measured on a scale from -1 to +1:
- +1 indicates that the assets move in perfect sync
- -1 indicates perfect inverse movement
- 0 indicates that price movements are independent of each other
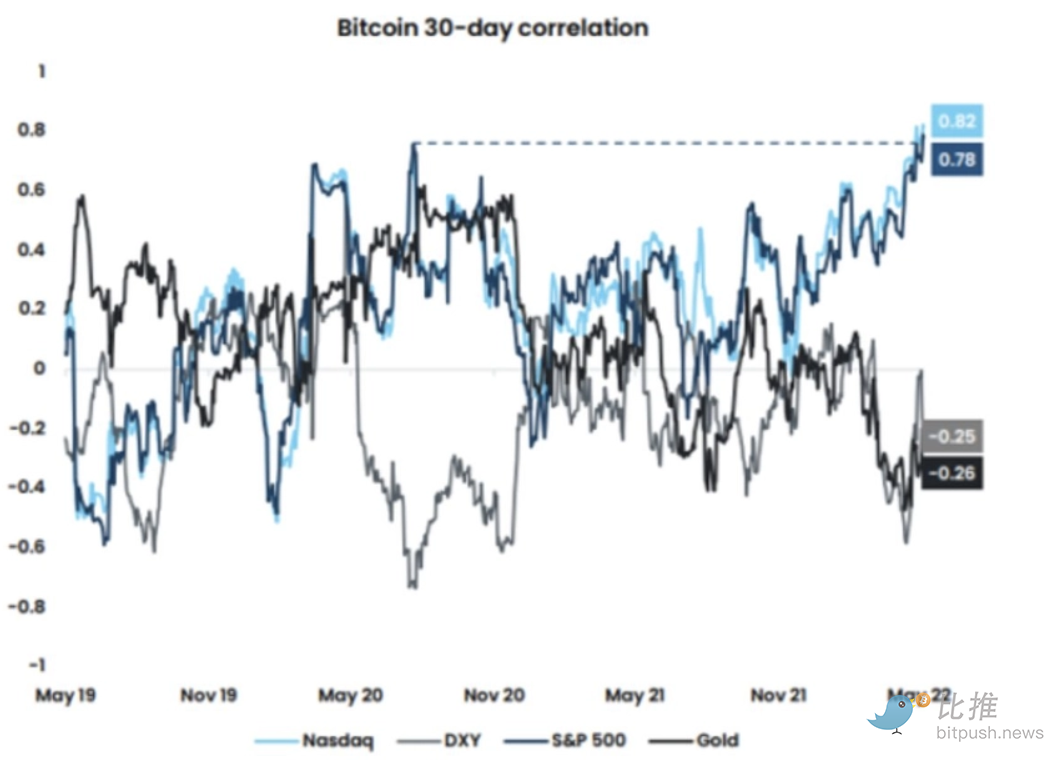
In the case of Bitcoin, correlation shows how its price fluctuations relate to other markets like the stock market. As an emerging digital asset, Bitcoin's correlation with stock prices has changed—especially with its increasing popularity and adoption.
Bitcoin vs. Stock Market: Independent Asset Class
In the initial years following Bitcoin's inception, there was almost no correlation with the S&P 500 index. Until 2012, Bitcoin's price remained stable while the S&P 500 index exhibited its usual steady rise (with minor dips). The first significant surge in Bitcoin from late 2013 to early 2014 did not coincide with a simultaneous rise in the S&P 500 index.
The stock market's decline at the end of 2016 coincided with a rise in Bitcoin prices. Bitcoin's price fluctuated dramatically, while the S&P 500 index changed relatively smoothly. Until 2018, the price peaks and troughs of Bitcoin and the S&P 500 showed almost no similarity.
Correlation between Bitcoin and the Stock Market from Late 2021 to 2023
From late 2021 through 2022 and into 2023, Bitcoin's price fluctuations mirrored those of stock prices (albeit with greater volatility). The chart below shows the comparison of Bitcoin (BTC) prices with the S&P 500 (SPX) and the Nasdaq Composite Index (ICIX) from November 2022 to November 2023.
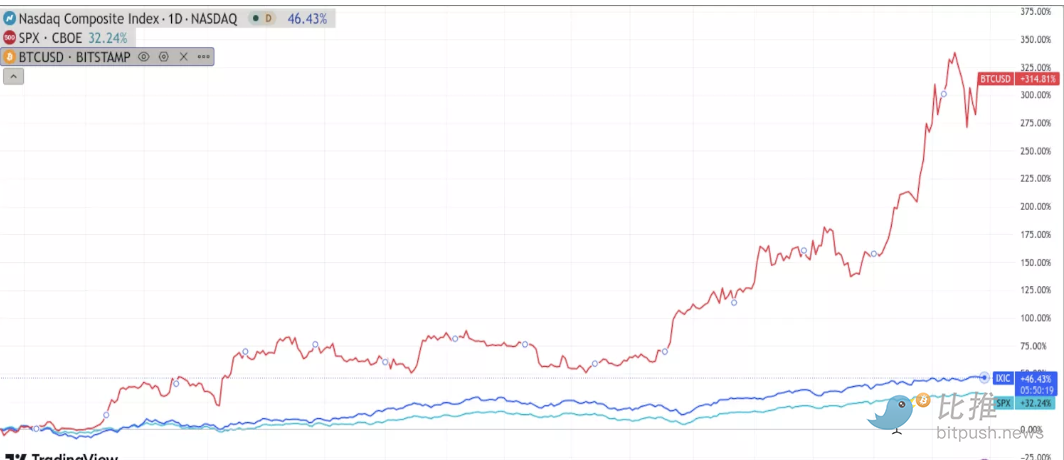
The S&P 500 measures the performance of large-cap stocks, while the Nasdaq Composite Index tracks 2,500 market-cap-weighted stocks. There is a noticeable trend of some synchronization between the two, but Bitcoin exhibits stronger volatility—especially after significant events, indicating that traders and investors are beginning to view Bitcoin similarly to stocks.
What Does This Mean for Investors?
The correlation between Bitcoin prices and stocks may be coincidental or may indicate that Bitcoin's price follows stock market trends. What implications does this have for investors?
As investors seem to treat Bitcoin like stocks, digital assets may respond to market influences similarly to stocks. For example:
- May 4, 2022: The Federal Reserve announced an increase in the federal funds target rate range to 0.75%-1%
- May 5, 2022: Bitcoin fell to around $31,000, the Nasdaq 100 Index (NDX) dropped about 1,400 points, and the S&P 500 fell about 150 points
Bitcoin's price fluctuations are more pronounced, but the market reactions are fundamentally the same. Overall, investors may temporarily handle Bitcoin as they would stocks. BTC is still in the price discovery phase, and the market is determining its role.
Interpreting Bitcoin and Stock Market Charts

Investors looking to profit from Bitcoin's price fluctuations must first understand how to read price charts. Price charts visually display the historical price performance of an asset over time. A close examination of the price of Bitcoin and the Nasdaq Composite Index over the past four years reveals a more apparent correlation.
Based on the charts comparing Bitcoin and the stock market, here are key correlation cases:
- December 2018: Both Bitcoin and Nasdaq prices fell to historical lows ($3,689 vs. 6,192 points)
- June 2019: Both experienced sudden and sharp price peaks
- February 2020: Rapid decline after a quarterly high
- March 2021: Prices soared to unusually high levels
- October 2021: After maintaining high levels for several months, both fell in sync, with no recovery within the year
- November 2021: Correlation significantly increased, with Bitcoin almost entirely following Nasdaq's fluctuations
- May 2022: After a simultaneous sharp decline, there was a slight recovery, with Bitcoin beginning to mirror Nasdaq's minor fluctuations
Analyzing the Causes of Correlation between Bitcoin and the Stock Market
The correlation between Bitcoin and the stock market is not driven by a single factor. Analyzing the comparative charts of Bitcoin and the stock market reveals that multiple factors contribute to their similarities. Like the stock market, Bitcoin prices are heavily influenced by supply and demand dynamics and investor sentiment:
- Upward drivers: When market demand is strong, market outlook is optimistic, and supply is limited, both prices tend to rise in sync
- Downward triggers: When investors are concerned about future economic trends or face adverse policies, prices typically retreat collectively
This reciprocal linkage pattern leads to a synchronized rhythm of price movements between Bitcoin and the stock market. However, it is worth noting that certain factors may weaken this correlation.
Bitcoin and Stock Market Correlation: An Evolving Investment Trend
Bitcoin is not subject to the same regulatory policies and government regulations as the stock market. For example, the Chinese government's comprehensive ban on Bitcoin mining in 2021 affected Bitcoin prices but had no impact on the stock market. There are also technical differences—stock markets are not affected by data storage issues and power shortages, which directly impact Bitcoin miners.
Why Do Recent Charts Still Show High Correlation?
The answer lies in the increasing interconnectedness between Bitcoin and stocks. Although Bitcoin does not rely on the stock market for operation, it is no longer viewed as an independent asset. Its popularity has made it highly similar to traditional stock holdings.
The Strengthening Connection between Bitcoin and the Stock Market
BTC is no longer a niche asset traded by a few enthusiasts. Traditional brokerage firms and investment institutions have now entered the space. The same group of investors often invests in both Bitcoin and stocks, with portfolios potentially containing both assets.
The spillover effect of Bitcoin gains is often reinvested into the stock market, and vice versa. As the correlation between Bitcoin and the stock market continues to strengthen, investors are gradually recognizing the similarities between the two and making more decisions based on the assumption that "Bitcoin is equivalent to stocks." This close correlation leads to mimicking volatility patterns between the two markets.
The Pros and Cons of High Correlation
What does the correlation between Bitcoin and the S&P 500 index mean for the average investor? The correlation between Bitcoin and the stock market has both advantages and disadvantages. If Bitcoin is highly correlated with the stock market, investing in Bitcoin becomes more predictable.
When Bitcoin and stock market charts are similar, you can more easily notice market trends and make informed choices. Additionally, since stock values tend to rise over the long term, the correlation between Bitcoin and the stock market may imply that BTC investors will see greater long-term returns.
Potential Benefits of Bitcoin Decoupling from the Stock Market
Despite some benefits, you do not necessarily need to worry about Bitcoin decoupling from the stock market, as this could be good news for investors looking to diversify their portfolios.
A combination of assets that do not decline in sync can better withstand financial storms. If decoupling occurs, investors will have more opportunities to hedge against crash risks.
Bitcoin-Stock Market Correlation: Impact on Investment Strategies
Whether Bitcoin decoupling from the stock market is a "good thing" depends on your investment strategy. The high correlation between Bitcoin and the stock market is beneficial for those who use stock market predictions to formulate Bitcoin trading strategies.
Investors with insufficiently diversified portfolios may find that the correlation between Bitcoin and the stock market makes them more susceptible to market downturns.
Will Bitcoin Follow the Stock Market?
In investing, it is essential to avoid equating correlation with causation. Chart similarities do not necessarily imply a direct influence between markets. The apparent similarity between Bitcoin and stock market charts does not mean that one market will significantly impact the other. In some cases, the correlation between Bitcoin and the stock market seems coincidental. For example, the stock market's decline in March 2019 was due to increased aluminum tariffs, while Bitcoin's decline in March 2019 was due to international crackdowns on Bitcoin.
However, there is also substantial evidence suggesting that the stock market may directly influence Bitcoin. Experts have noted that regardless of other factors affecting prices, Bitcoin prices often tend to drop when the stock market opens. Investor confidence significantly impacts Bitcoin's price, so recent Bitcoin crashes often occur after stock market crashes. Bitcoin traders who start hearing negative news about the stock market often trigger conservative actions.
Will Bitcoin Decouple from the Stock Market?
If your investment strategy relies on Bitcoin following the stock market, you should watch for signs of decoupling. Experts predict that this situation will not happen quickly. As more people begin to conflate Bitcoin and stock market charts, these two assets are more likely to influence each other. The slight correlation with the stock market seems likely to persist for the remainder of this year.
That said, a certain degree of decoupling between Bitcoin and the stock market is inevitable. The primary reason is that Bitcoin's volatility is often greater. During sell-offs, Bitcoin prices tend to plummet more severely than traditional stocks, followed by a sharp rebound.
Signs and Uncertainties of Bitcoin Decoupling from the Stock Market
It is challenging to determine whether Bitcoin decoupling from the stock market is positive or negative for Bitcoin investors. Some believe that Bitcoin may stabilize when the stock market declines; others argue that even if the stock market recovers, Bitcoin's value may still decrease. Regardless, signs of Bitcoin decoupling from the stock market may include:
- Increased government regulation of Bitcoin
- Loss of confidence in Bitcoin and decentralized finance
- Increased number of token withdrawals
- Continued decline in stock prices
免责声明:本文章仅代表作者个人观点,不代表本平台的立场和观点。本文章仅供信息分享,不构成对任何人的任何投资建议。用户与作者之间的任何争议,与本平台无关。如网页中刊载的文章或图片涉及侵权,请提供相关的权利证明和身份证明发送邮件到support@aicoin.com,本平台相关工作人员将会进行核查。


