Source: Cointelegraph Original: "{title}"
Key Points:
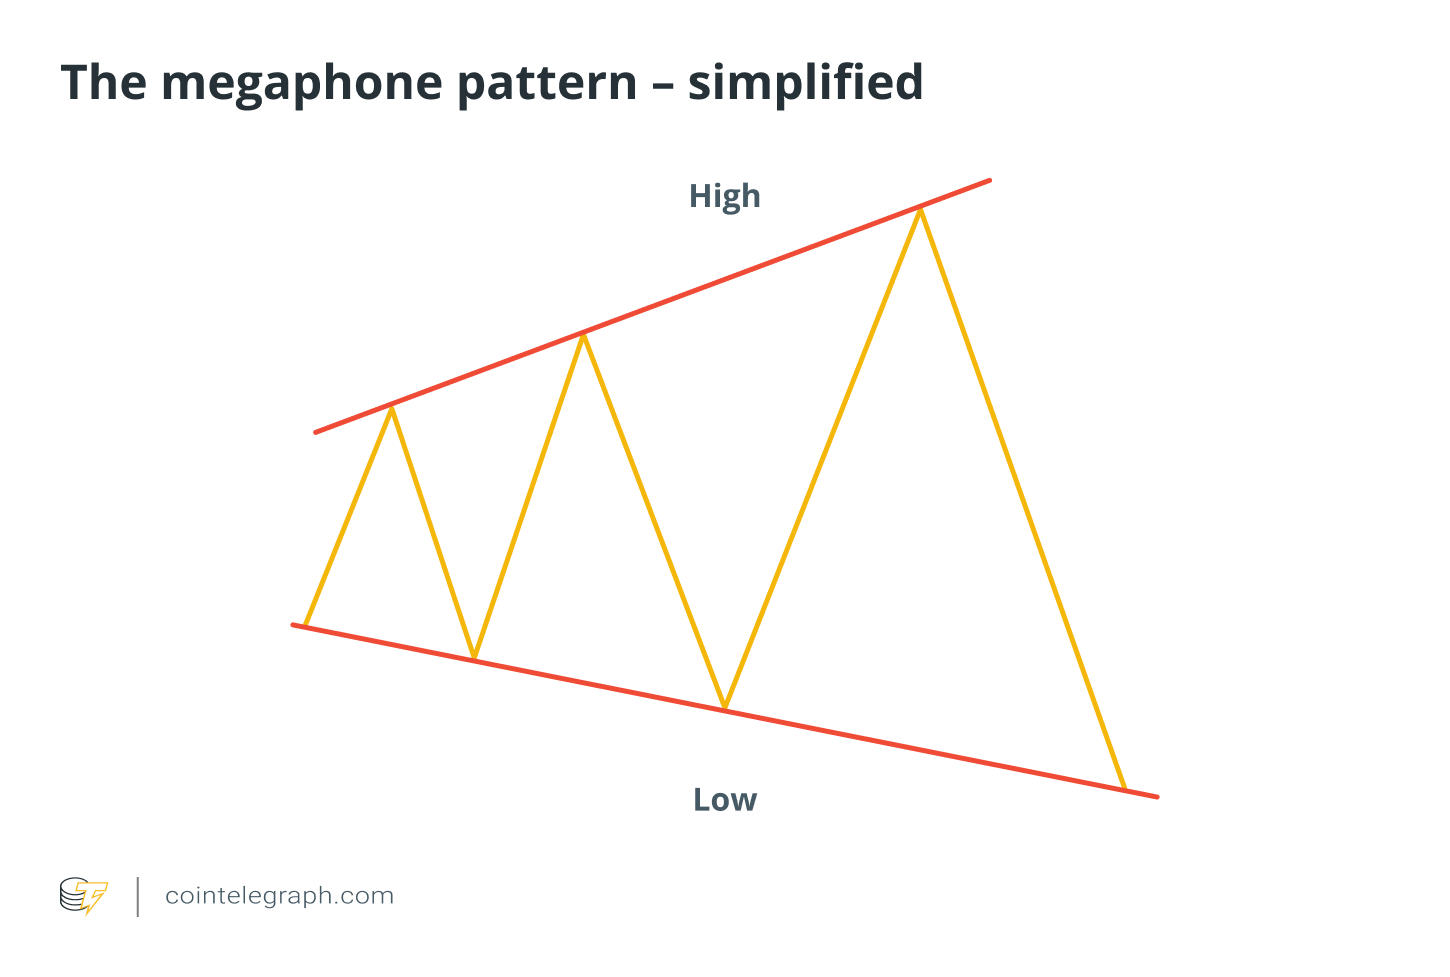
The characteristic of the Bitcoin expansion pattern is that it has at least two higher highs and two lower lows, forming an expanding structure.
The trend lines connecting these highs and lows create a shape similar to a megaphone, reflecting market instability.
This pattern indicates increased volatility, with price fluctuations becoming more pronounced over time.
Depending on the trend direction, this pattern may suggest a potential breakout upwards (bullish) or downwards (bearish).
The expansion pattern, also known as the expanding pattern, is a technical analysis chart pattern observed by traders in various financial markets, including cryptocurrencies like Bitcoin.
This pattern is known for its unique shape, resembling a megaphone or expanding triangle, indicating increased volatility and market indecision. Here are its defining characteristics:
Higher highs and lower lows: This pattern contains at least two higher highs and two lower lows, forming an expanding structure. Each subsequent peak is higher than the previous one, and each trough is lower, creating diverging trend lines.
Diverging trend lines: When the trend lines connecting the higher highs and lower lows are drawn, they diverge, forming a visually megaphone-like expanding pattern.
Increased volatility: The formation of this pattern indicates that price fluctuations become more pronounced over time, reflecting the struggle between buyers and sellers, leading to greater price swings.
Did you know? The difference between trading the Bitcoin expansion pattern and traditional megaphone trading is that no physical megaphone is involved in the process.
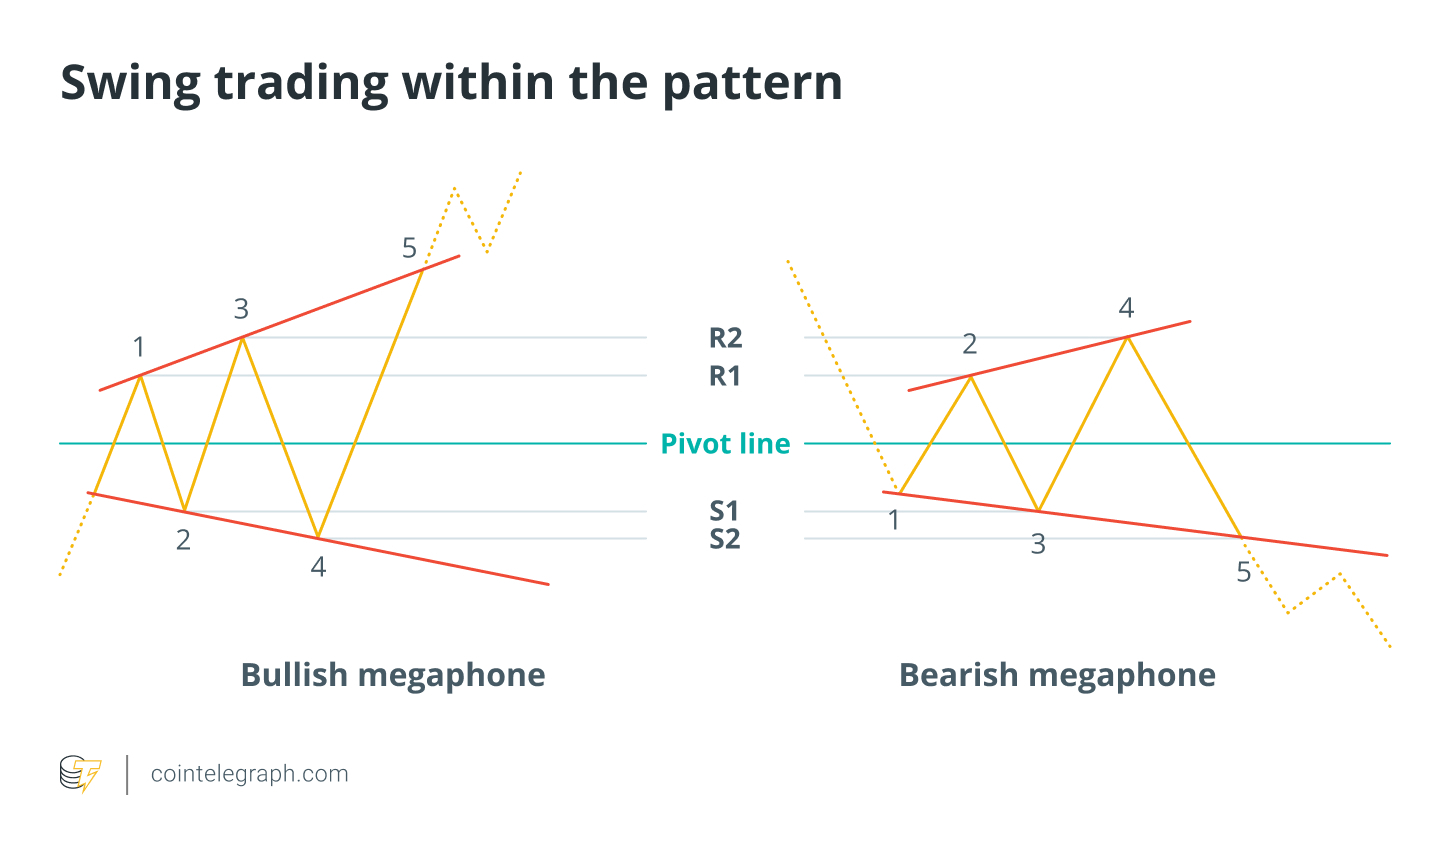
- Bullish Expansion Pattern
This variant of the pattern suggests a potential upward breakout.
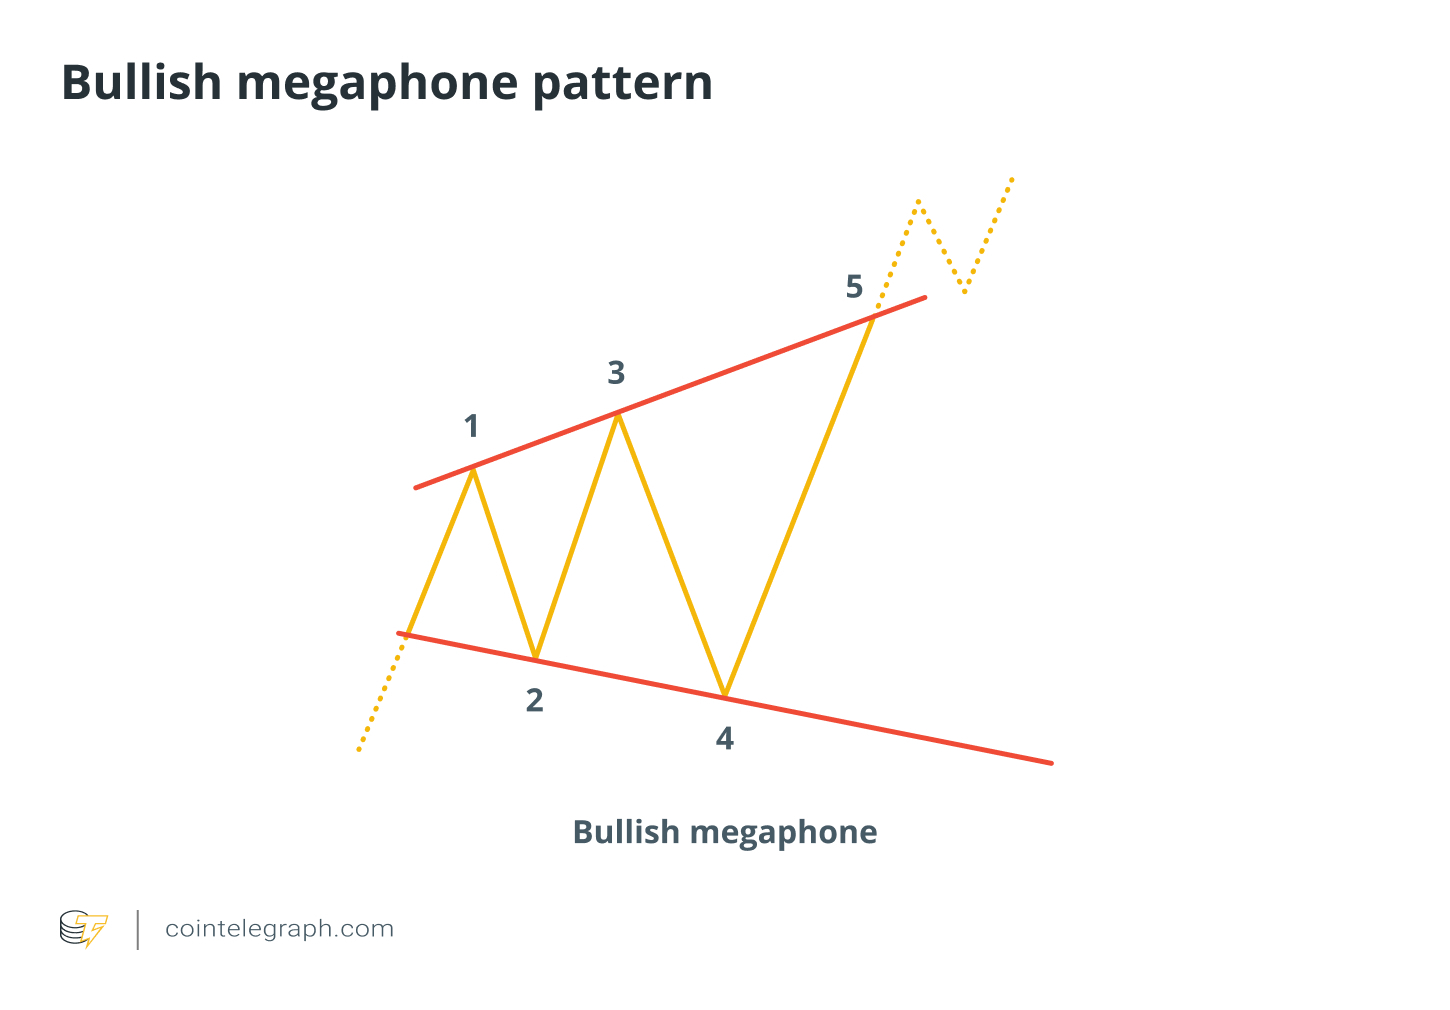
Initial uptrend: The price begins in an uptrend, reaching the first peak (Point 1).
First retracement: A pullback occurs, creating a lower low (Point 2), but still above the starting level of the previous trend.
Higher high formation: The price rebounds again, exceeding the previous high and forming a higher high (Point 3).
Lower low extension: A more pronounced decline follows, leading to a lower low (Point 4), expanding the price fluctuation range.
Breakout and continuation: The price breaks through the resistance line (Point 5), confirming the bullish breakout.
- Bearish Expansion Pattern
This variant of the pattern suggests a potential downward breakout.
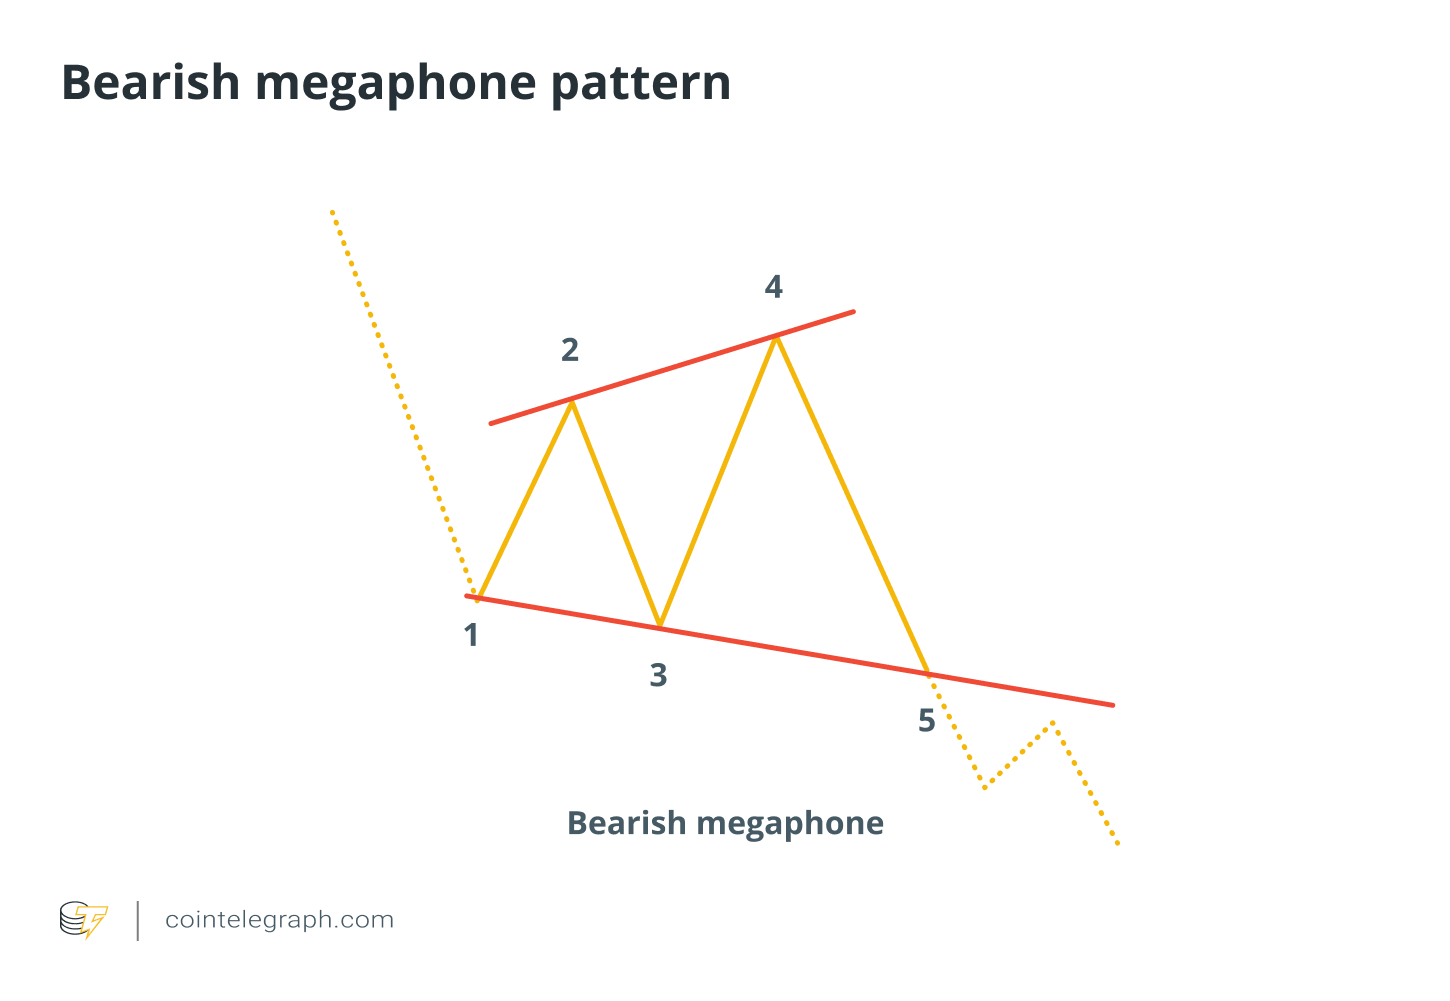
Initial downtrend: The price begins with a downtrend, setting an initial low (Point 1).
First retracement: A slight upward correction follows, forming a lower high (Point 2).
Lower low extension: A new low (Point 3) is formed, further expanding the range.
Higher high formation: The price rises again but struggles to maintain above the previous high (Point 4).
Breakout and reversal: The price breaks through the support line (Point 5), confirming the bearish breakout.
Did you know? High-volume breakouts in expansion patterns indicate strong market conviction, confirming the true trend. Low volume? This may indicate a false breakout, and the price could reverse. Remember to wait for a surge in volume before entering a trade.
History of Expansion Patterns in Bitcoin Trading
Expansion patterns or expanding patterns have appeared at various key moments in Bitcoin trading history.
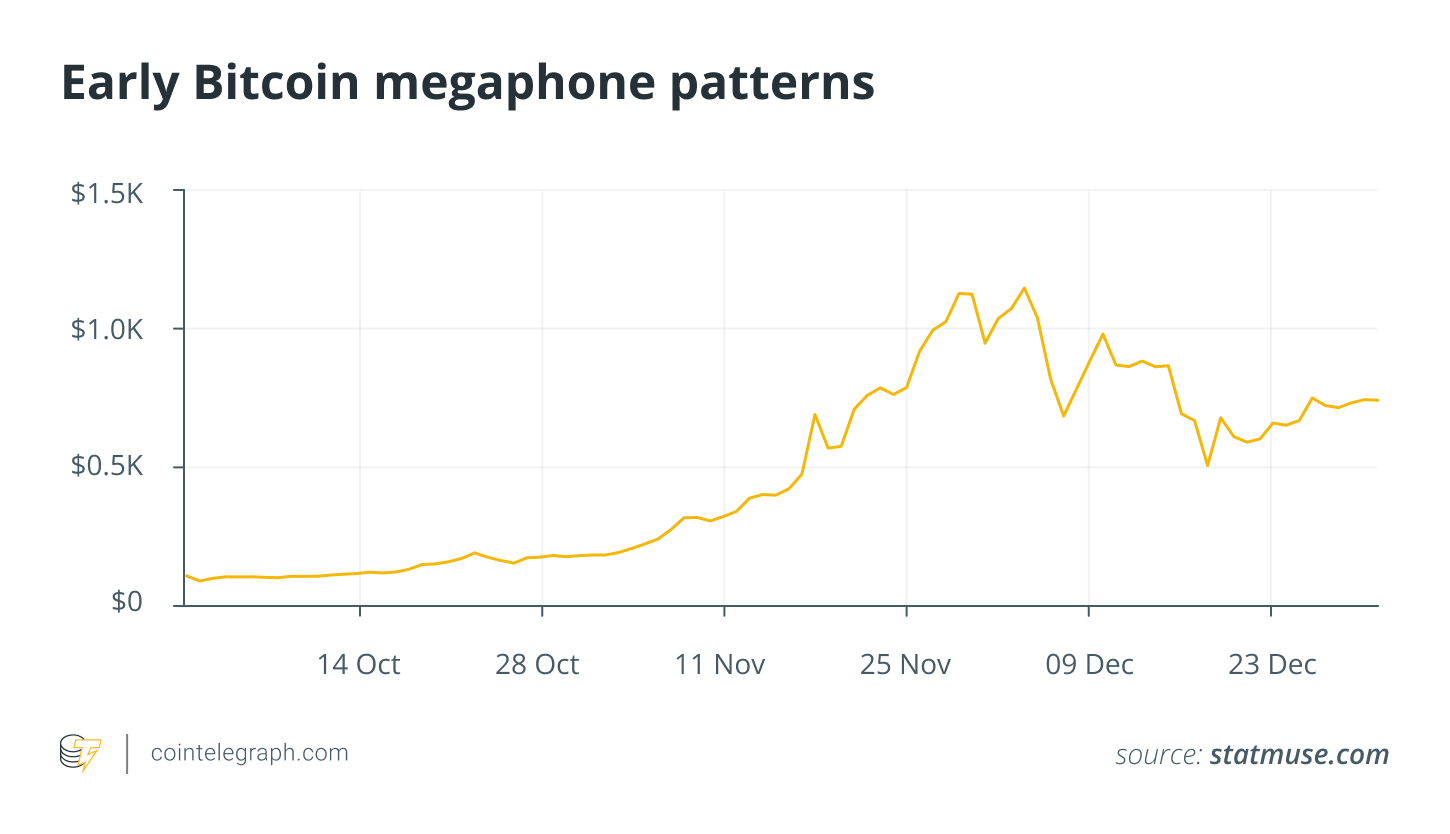
- Early Days: 2013-2014
During Bitcoin's formative years, extreme volatility often produced expansion patterns. During this period, traders noted expansion patterns—often with bearish overtones—reflecting the intense price fluctuations as the market struggled to find balance.
Although records were sparse at the time, these early examples have become reference points for understanding how chaotic market conditions manifest as expansion patterns.
- Bearish Pattern at the End of 2017 - Early 2018
As Bitcoin approached its then-historical high of around $20,000 at the end of 2017, a bearish expansion pattern appeared on the daily chart. This pattern was marked by diverging trend lines with higher highs and lower lows, indicating indecision and increased selling pressure.
Many technical analysts viewed it as a warning signal of an impending reversal—a prediction that was realized during the severe correction experienced in early 2018.

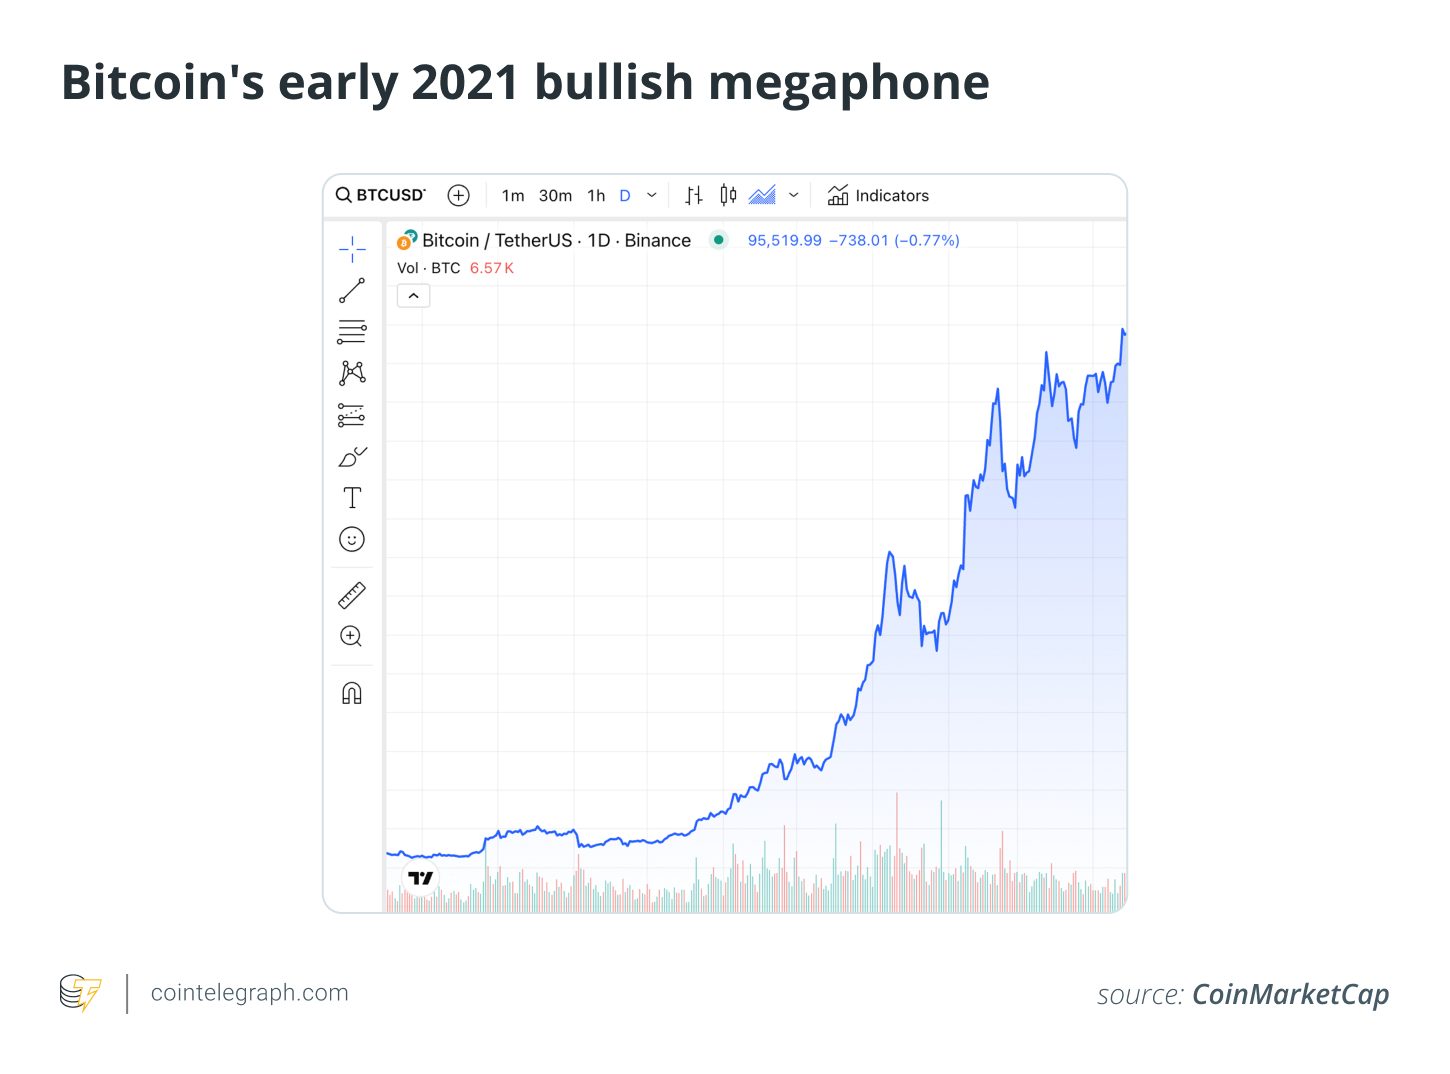
- Bullish Shift in Early 2021
In early 2021, as Bitcoin approached the $60,000 threshold, traders observed the formation of a bullish expansion pattern across multiple time frames. Characterized by a series of gradually rising highs and lows, this pattern indicated increased volatility under cautious optimism.
The subsequent breakout confirmed strong bullish momentum, reinforcing the pattern's effectiveness as a predictive tool in mature markets.
Expansion Pattern Trading Strategies
This section will explore various trading strategies compatible with expansion patterns.
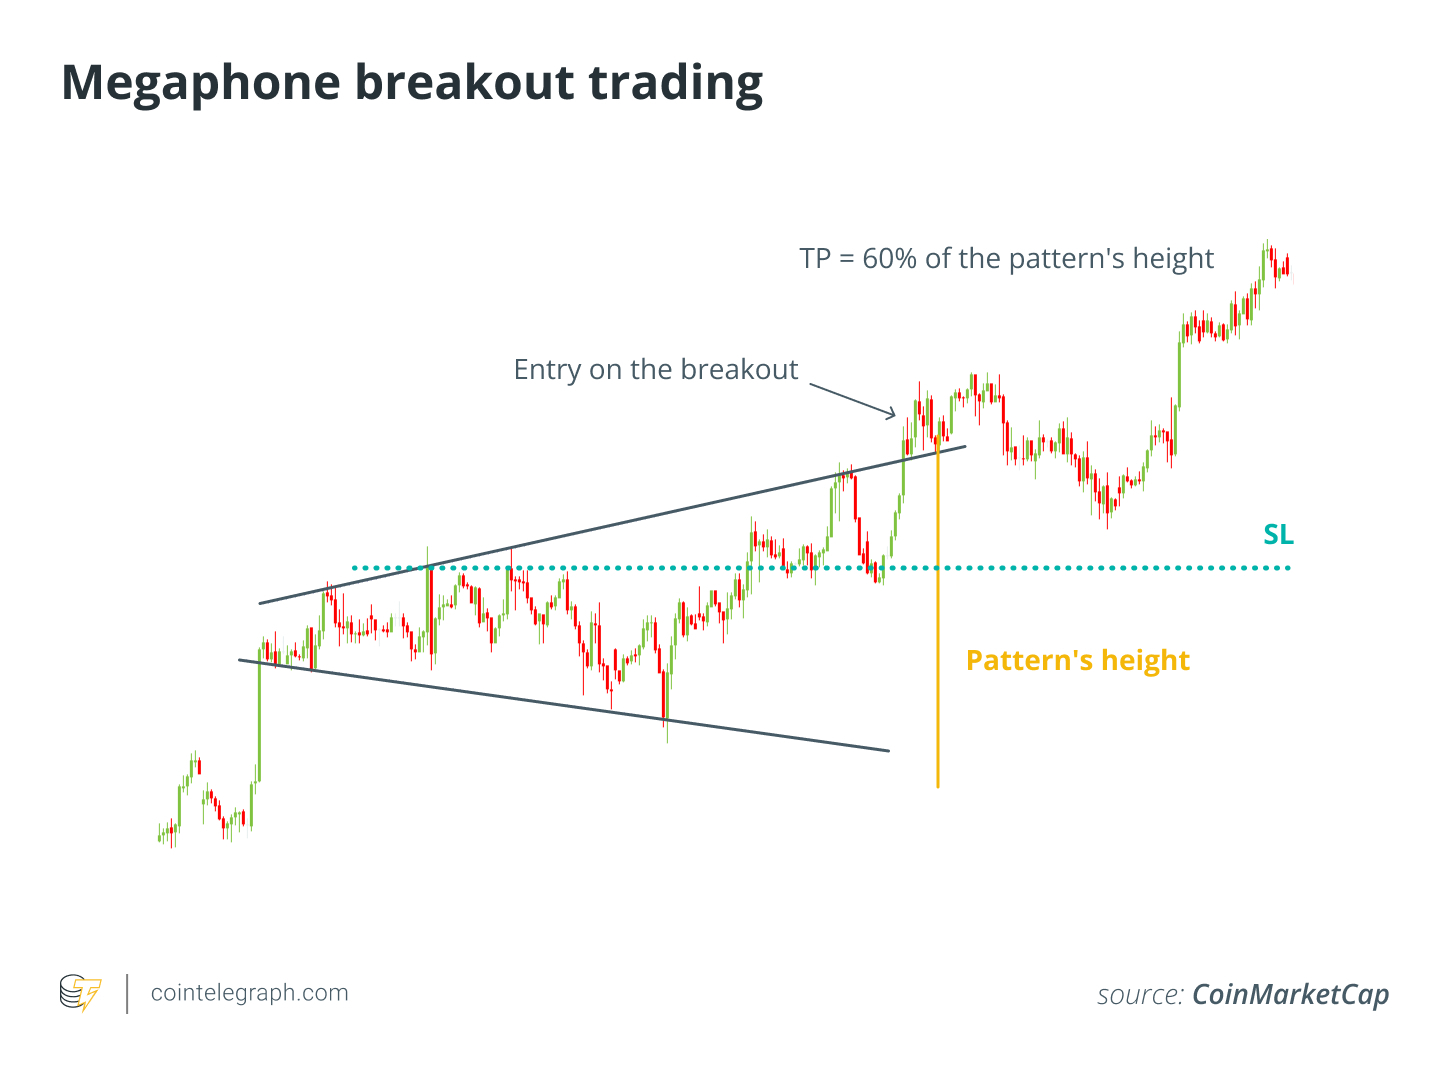
- Expansion Breakout Trading
Expansion pattern breakout trading involves entering a trade when the price confirms a decisive breakout from the pattern's boundaries accompanied by strong trading volume.
a. Identify Key Levels
Draw upper and lower trend lines: Connect the higher highs and lower lows of the pattern to form a megaphone shape. These trend lines mark key resistance and support levels.
Confirm breakout area: In a bullish scenario, the upper resistance line is the key area to watch for a breakout. In a bearish scenario, focus on the lower support line.
b. Volume Confirmation
Look for volume spikes: When the price breaks through resistance (bullish) or support (bearish), a volume spike indicates strong market participation.
Reduce false breakouts: If volume remains weak during the breakout, a false move back into the pattern is more likely.
c. Entry Points
Bullish breakout entry: Set buy orders above the upper resistance line.
Bearish breakout entry: Enter short positions below the lower support line.
Did you know? Setting stop-loss orders within the expansion pattern can help prevent excessive losses when a breakout fails and the price slips back into the pattern, providing you with extra protection in volatile markets.
d. Profit Targets
Measure the height of the pattern by finding the vertical distance between its lowest and highest points, then use a portion of this measurement (usually around 60%) to determine a balanced profit level.
By projecting that percentage from the breakout point, whether above the upper resistance (bullish scenario) or below the lower support (bearish scenario), traders can set realistic targets while maintaining a favorable risk-reward ratio.
- Swing Trading Within the Pattern
Swing trading within an expansion pattern involves capitalizing on temporary price movements between its support and resistance boundaries—without waiting for a clear breakout.
a. Identify Key Lines
Upper resistance (R1, R2): These lines represent areas where the price may encounter selling pressure.
Pivot line: A midpoint reference that serves as temporary support or resistance, depending on the price movement direction.
Lower support (S1, S2): Areas where buying pressure may emerge.
b. Look for Buy Signals Near Support
In a bullish expansion pattern, consider entering long positions near the lower support line (S1 or S2), especially when you see a rebound or bullish candlestick pattern.
Confirm signals with oscillators (like RSI, Stochastic) or rising volume, indicating a momentum shift.
c. Sell Signals Near Resistance
In a bearish expansion pattern (or even within a bullish pattern if you are accustomed to shorting), traders may look for short entry points near the upper resistance line (R1 or R2).
Candlestick reversal patterns or declining volume at these resistance levels can strengthen the likelihood of a price reversal.
d. Stop Loss and Profit Taking
Place stop-loss orders above the resistance line (e.g., slightly above R2) to minimize losses if the price breaks higher.
For profit targets, consider exiting near the pivot line or first support (S1). In cases of strong downward momentum, take partial profits at S1, with the remaining position targeting S2.
e. Use the Pivot Line as a Decision Area
The central pivot line often serves as a short-term turning point:
Above the pivot line: The bias may be bullish, favoring long positions.
Below the pivot line: The bias may be bearish, favoring short positions.
If the price continues to hover near the pivot line without a clear direction, wait for it to test support or resistance levels to confirm the next move.
f. Combine Volume and Indicators
Look for volume spikes at each support or resistance test. When the price rebounds from support or reverses from resistance, rising volume may indicate a stronger trend.
Additionally, tools like the Relative Strength Index (RSI) or Moving Average Convergence Divergence (MACD) can help confirm overbought/oversold conditions, strengthening the rationale for reversal trades.
- False Breakout Strategy
False breakout expansion pattern trading involves identifying when the price briefly breaks through the support or resistance of the expansion pattern but then quickly returns within its boundaries—this situation is often accompanied by low trading volume.
In this case, traders do not chase the breakout but instead look for confirmation of a reversal before entering a counter-trend trade.
This strategy requires identifying the key trend lines that define the pattern, monitoring volume for weak breakout signals, and entering trades after the price re-enters the pattern, typically setting stop-loss orders within the pattern to limit losses, and establishing profit targets based on the measured height of the pattern.
Risk Management and Considerations
Given the inherent volatility of Bitcoin and the extreme price fluctuations characteristic of expansion patterns, robust risk management is crucial to protect your trading capital. Here are several key strategies to incorporate into your trading plan:
- Volatility Awareness
The expanding range of the expansion pattern indicates increased uncertainty. Recognize that rapid fluctuations can lead to significant gains and equally significant losses.
Closely monitor market sentiment and be prepared for sudden reversals, especially during false breakouts, where low trading volume may indicate a lack of conviction.
- Position Size and Leverage
Position Size: Determine your position size based on the maximum risk you are willing to take (typically 1%-2% of your trading account).
Use Leverage Cautiously: While leverage can amplify profits, it also increases potential losses. Use leverage cautiously, ensuring your risk parameters can accommodate amplified volatility.
- Stop-Loss and Profit Levels
Stop-Loss Orders: Set stop-loss orders within the boundaries of the expansion pattern. This positioning helps limit losses in the event of an unexpected price reversal.
Profit Targets: Calculate profit targets by measuring the vertical distance of the pattern and projecting a reasonable percentage from the breakout point. This ensures you secure profits while maintaining a favorable risk-reward ratio.
- Adaptive Risk Control
Market conditions can change rapidly. Continuously reassess your trades by:
Monitoring Volume and Momentum: Use volume spikes and momentum indicators to dynamically adjust stop-loss or profit levels, ensuring your exit strategy adapts to the changing market.
Using Trailing Stops: Consider employing trailing stop orders to lock in profits as the price moves in your favor while still leaving room for potential gains.
That’s all the content—wishing you a pleasant trading experience with expansion patterns!
Related: Data Predicts Bull Market Return, Bitcoin Aiming for $126,000 Target by June.
免责声明:本文章仅代表作者个人观点,不代表本平台的立场和观点。本文章仅供信息分享,不构成对任何人的任何投资建议。用户与作者之间的任何争议,与本平台无关。如网页中刊载的文章或图片涉及侵权,请提供相关的权利证明和身份证明发送邮件到support@aicoin.com,本平台相关工作人员将会进行核查。


