This Week's Preview (3.17-3.23),BTC Spot* ETF* Net Inflow Close to 0 This Year, Focus on Federal Reserve Interest Rate Decision This Week
Table of Contents:
Large Token Unlock Data This Week;
Overview of the Crypto Market, Quick Read on Weekly Hot Coins' Price Movements/Fund Flows;
Spot ETF Fund Inflow and Outflow Situation;
BTC Liquidation Map Data;
Key Macroeconomic Events and Financial Data Forecast and Analysis This Week.
1. Large Token Unlock Data This Week;
This week, several projects have announced their unlock details, sorted by unlock value as follows:
Metars Genesis (MRS) will unlock 10 million tokens at 8:00 AM on March 23, accounting for 11.87% of the current circulation, valued at approximately $97.4 million;
Fasttoken (FTN) will unlock 20 million tokens at 8:00 AM on March 18, accounting for 4.65% of the current circulation, valued at approximately $79.8 million;
QuantixAI (QAI) will unlock approximately 566,000 tokens at 8:00 AM on March 18, accounting for 3960.24% of the current circulation, valued at approximately $41.4 million;
MANTRA (OM) will unlock 5 million tokens at 8:00 AM on March 23, accounting for 0.51% of the current circulation, valued at approximately $32.8 million;
Polyhedra Network (ZKJ) will unlock approximately 15.53 million tokens at 8:00 AM on March 19, accounting for 25.72% of the current circulation, valued at approximately $31.8 million;
SPACE ID (ID) will unlock 78.49 million tokens at 8:00 AM on March 22, accounting for 18.23% of the current circulation, valued at approximately $19.3 million;
Melania Meme (MELANIA) will unlock 26.25 million tokens at 8:00 AM on March 18, accounting for 17.50% of the current circulation, valued at approximately $17.6 million;
Immutable (IMX) will unlock 24.52 million tokens at 8:00 AM on March 21, accounting for 1.39% of the current circulation, valued at approximately $13.4 million;
ApeCoin (APE) will unlock 15.6 million tokens at 8:30 PM on March 17, accounting for 1.95% of the current circulation, valued at approximately $8 million;
Murasaki (MURA) will unlock 10 million tokens at 8:00 AM on March 23, accounting for 1.00% of the current circulation, valued at approximately $7.4 million;
Solv Protocol (SOLV) will unlock approximately 11.7 million tokens at 6:00 PM on March 17, accounting for 7.93% of the current circulation, valued at approximately $5 million.
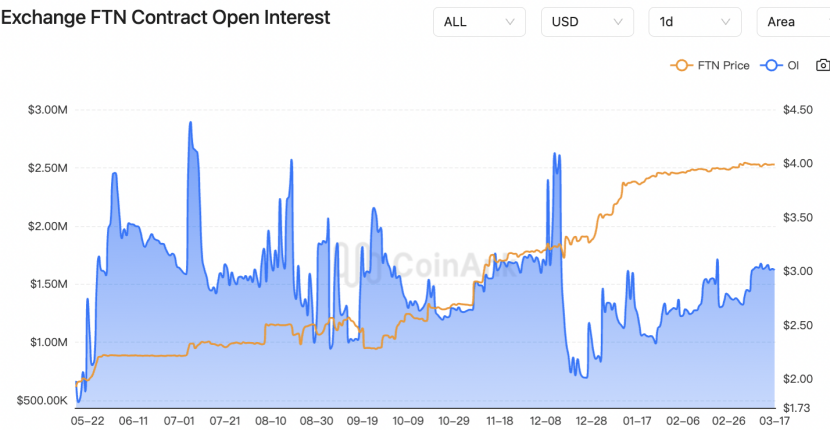
The unlocking situation of these projects may have varying degrees of impact on the related markets. The above times are in UTC+8. This week, pay attention to the negative effects brought by the unlocking of these tokens, avoid spot trading, and seek shorting opportunities in contracts. The chart is from CoinAnk data, where MRS, FTN, QAI, and MELANIA have larger proportions and scales of unlocked circulation, warranting more attention.
We believe that from the perspective of managing the liquidity of crypto assets, large-scale concentrated unlocking of tokens often triggers a reconstruction of the market supply-demand relationship. The 11 projects disclosed this time show three key characteristics: some projects have excessively high unlocking ratios (e.g., QAI's new circulation reaches 39.6 times the existing amount), which may trigger a liquidity crisis; high market cap projects like MRS unlocking nearly $100 million worth of tokens pose a challenge to the secondary market's absorption capacity; multiple projects are concentrated in the unlocking window from March 18-23, which may create a cumulative effect on market sentiment.
The impact of token unlocking on prices follows differentiated paths: underlying protocol projects (like IMX) may have relatively controllable short-term selling pressure due to ecosystem application support; while meme coins (MELANIA) and high circulation ratio projects (QAI) face greater risks of value reassessment. Notably, some projects choose to release updates on ecosystem applications simultaneously after unlocking (like Polyhedra Network's ZK technology upgrade), which may buffer market shocks. It is recommended to closely monitor the on-chain flow data of unlocked tokens, especially the unusual movements in institutional holdings, to predict potential market turning points.
2. Overview of the Crypto Market, Quick Read on Weekly Hot Coins' Price Movements/Fund Flows
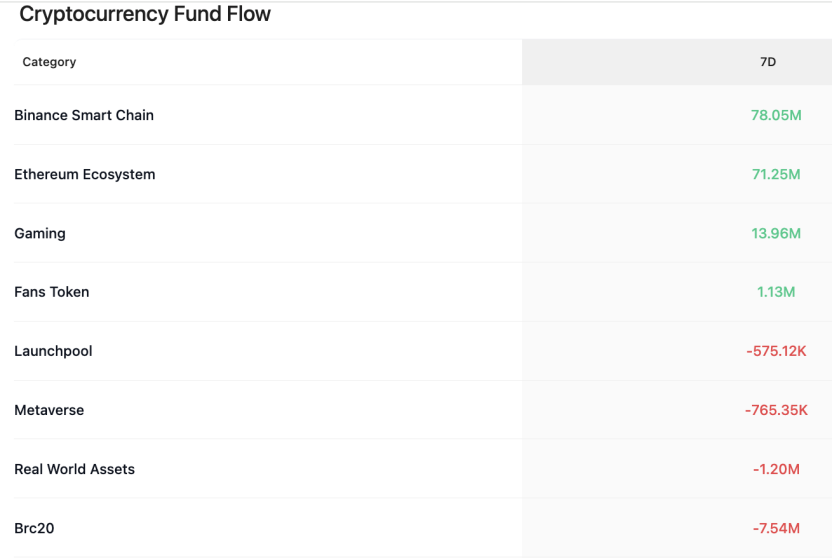
CoinAnk data shows that over the past 7 days, the crypto market, categorized by concept sectors, has continued to maintain an outflow trend, with only four sectors—Binance Smart Chain, Ethereum ecosystem, gaming concept, and fan tokens—achieving net inflows, while other sectors with smaller net outflows are concentrated in Launchpool, Metaverse, RWA, and BRC20. In the past week, many tokens have also experienced rotational increases. The top 500 by market cap include FORM, MERL, DBR, VANA, TON, and SLF, which have seen relatively high increases and can continue to be prioritized for trading opportunities.
3. Spot ETF Fund Inflow and Outflow Situation.
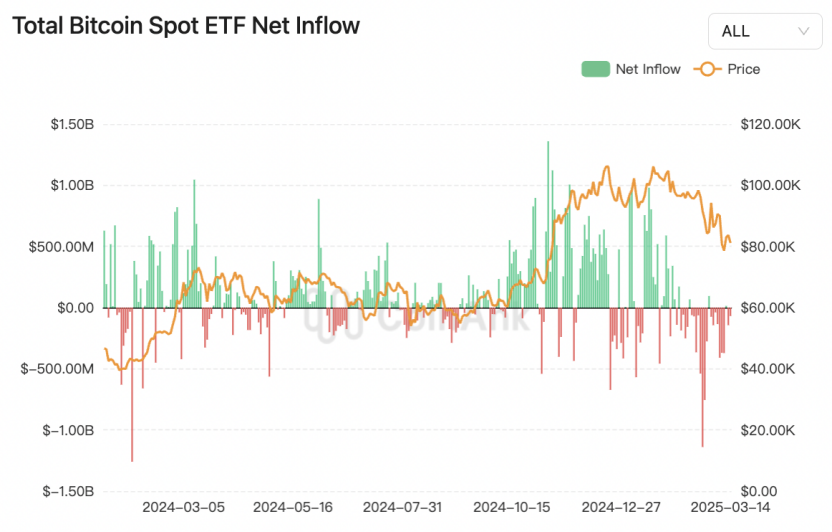
CoinAnk data shows that in the past week, the U.S. spot Bitcoin ETF had a net outflow of $829.9 million, reducing its holdings by 10,358.34 BTC, with only a slight inflow of 160.44 BTC on Wednesday, while the rest of the time was a net outflow. Among them, BlackRock reduced its holdings by 4,239.38 BTC, and Fidelity reduced by 3,813.02 BTC.
Since February 6, 2025, the U.S. spot Bitcoin ETF has reduced its Bitcoin holdings by 4.76%. From January 1 to February 6, these funds added approximately 56,802.86 BTC to their balance sheets, but in the past 35 days, the holdings have decreased by 55,348.00 BTC.
The total value of Bitcoin held by these funds is $93.25 billion, accounting for approximately 5.6% of the total Bitcoin market cap. IBIT, FBTC, and GBTC—together account for 85.26% of the total ETF group holding of 1.121 million BTC.
We believe that the recent fund flows of the U.S. spot Bitcoin ETF show a significant trend of institutional withdrawal. The net outflow of $829.9 million in the past week, with a single-week reduction of over 10,000 BTC, indicates that BlackRock and Fidelity have become the main sellers, reducing 4,239 BTC and 3,813 BTC respectively. This phenomenon continues the reduction cycle that has been ongoing since February 6, with a cumulative reduction of 55,348 BTC over 35 days, reflecting institutional investors' adjustments to their short-term price expectations for Bitcoin.
It is noteworthy that the current total ETF holdings still reach 1.121 million BTC, valued at approximately $93.25 billion, accounting for 5.6% of the total Bitcoin market cap, with IBIT, FBTC, and GBTC products occupying 85% of the share. This indicates a high market concentration, where the operations of leading institutions have an amplifying effect on price fluctuations. Combining historical data, BlackRock's IBIT set a record for a single-week net inflow of $2.022 billion in 2024, while the recent continuous outflows indicate a shift in its strategy towards defense.
From a market impact perspective, the continuous net outflow of ETFs exacerbates the supply-demand imbalance. Since ETFs need to buy and sell spot assets in the secondary market daily to meet changes in shares, large-scale reductions directly increase market selling pressure, which corroborates the 18% decline in Bitcoin price from its high of $102,400. Additionally, the stock of BTC on exchanges has dropped to its lowest level since 2018, and the contraction of liquidity may further amplify price fluctuations. In the future, close attention should be paid to the flow of institutional funds and the interplay with miner selling pressure post-halving, which will determine the mid-term price center of Bitcoin.
4. BTC Liquidation Map Data.
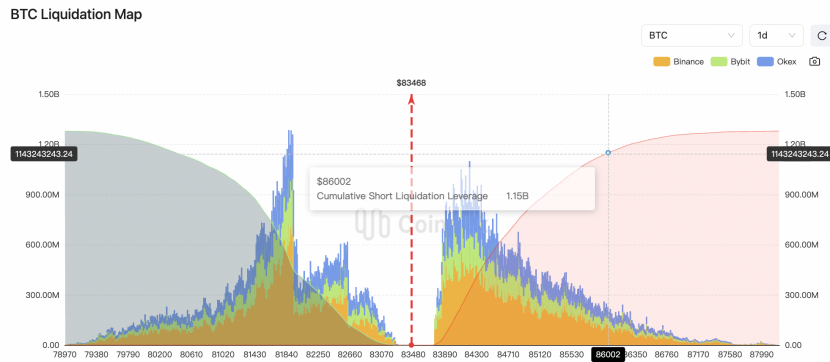
CoinAnk liquidation map data shows that if BTC breaks through $86,000, the cumulative short liquidation intensity on mainstream CEXs will reach $1.15 billion. Conversely, if Bitcoin falls below $80,000, the cumulative long liquidation intensity on mainstream CEXs will reach $1.21 billion.
We believe that the liquidation threshold formed by Bitcoin currently in the range of $80,000 to $86,000 reveals the intense confrontation between long and short forces at key price levels. The price elasticity characteristics are significant: if it breaks through $86,000, it will trigger $1.15 billion in short liquidations, potentially leading to a "short squeeze" that drives prices up rapidly; conversely, if it falls below $80,000, it will face $1.21 billion in long liquidations, which may exacerbate short-term panic selling.
From the perspective of market structural dynamics, the current liquidation peak corresponds to two major characteristics: first, the differentiation of leverage, with shorts accounting for 58% of the open interest in perpetual contracts (concentrated above $86,000), while long leverage is more concentrated below $80,000, reflecting the market's cautious expectations for breaking previous highs; second, liquidity stratification, with the on-chain turnover rate near $80,000 reaching 1.3 times the average daily trading volume, forming dual support from both technical and psychological perspectives.
In terms of potential transmission paths, if the price breaks through $86,000, the liquidity released from short liquidations may attract trend-following strategy funds to enter the market, pushing prices to test the $90,000 mark. However, caution is warranted regarding the profit-taking pressure caused by a sudden rise in derivative funding rates (currently at 0.01%). If it falls below $80,000, long liquidations may resonate with ETF fund outflows (which had a net outflow of $830 million last week), but whale addresses have cumulatively increased their holdings by 24,000 BTC in the $78,000-$80,000 range, which may provide a buffer.
In the coming week, it is essential to focus on two types of signals: first, whether the CME Bitcoin futures position gap (currently reported at $84,500) can guide prices to fill the gap; second, whether net inflows of stablecoins can exceed the monthly average threshold of $3 billion to support buying pressure. The current market may be on the eve of a "high volatility breakout," but the direction choice needs to be validated by macro liquidity (such as non-farm payroll data) and on-chain chip distribution.
5. Key Macroeconomic Events and Financial Data Forecast This Week.
This week, global macroeconomic data will be released intensively, and three main lines of logic need to be focused on: central bank monetary policy expectation differences, verification of inflation stickiness, and marginal changes in U.S. dollar liquidity. These three lines will transmit to the crypto market through market risk appetite and funding costs.
- Federal Reserve Policy Path: Core Variable of Short-Term Volatility. The FOMC decision (Thursday) is the market focus. Currently, the market's probability of a rate cut in June has dropped from 76% at the beginning of the month to 55% (CME data). If the dot plot maintains the expectation of three rate cuts this year, it will ease market concerns about prolonged tightening, benefiting risk assets; however, if the economic projections (SEP) raise inflation or GDP growth forecasts, it may trigger a repricing of the market towards "higher for longer," leading to a short-term correction in BTC. Powell's press conference should focus on his statements regarding the balance of bank reserves (TGA account replenishment progress) and the pace of balance sheet reduction, as liquidity contraction beyond expectations will suppress the activity of leveraged funds in the crypto market.
2. Global Central Bank Interconnectivity: Risks of Policy Shifts in Non-USD Currencies. The Bank of Japan's decision (Tuesday) holds historical significance, with the market pricing an 85% chance of ending negative interest rates (Reuters survey). If the Bank of Japan raises rates for the first time in 17 years, it may trigger the unwinding of carry trades, leading to a repatriation of yen and putting liquidity withdrawal pressure on high-leverage positions in the crypto market. If the Swiss and Swedish central banks (Thursday) continue to test rate cuts, it will strengthen the narrative of European easing, and the widening policy gap with the Federal Reserve may drive funds towards non-USD assets, potentially benefiting BTC from the safe-haven demand for euro-denominated funds.
3. Inflation Data Verification: The Anchoring Effect of Real Interest Rates. Eurozone February CPI (Wednesday) — if the core indicator exceeds the previous value of 3.1%, it will weaken the market's bets on an ECB rate cut in April, narrowing the spread between U.S. and German bonds, which may put pressure on the dollar index and indirectly support BTC. Japan's core CPI (Friday) — if it breaks through 2.4% (previous value 2.0%), it may force the Bank of Japan to accelerate tightening, creating an extreme scenario of "synchronized tightening" between U.S. and Japanese policies, potentially causing volatility in the crypto market (BTC DVOL index) to spike over 20% in a single day.
Impact Pathways on the Crypto Market:
Liquidity Valve Effect: If the Federal Reserve signals "preemptive rate cuts" (such as emphasizing banking sector pressures or cracks in the labor market), a dollar index drop below 102.5 will trigger BTC to break through the previous high of $72,000; conversely, if the dot plot reduces the number of rate cuts, BTC may test the support level of $60,000.
Cross-Market Volatility Transmission: A rate hike by the Bank of Japan may trigger a chain liquidation in the crypto derivatives market (current BTC perpetual contract funding rate is 0.12%/8H, with leverage at a high level), necessitating caution against flash crash risks during Asian trading hours.
Inflation Narrative Shift: If U.S. retail sales month-on-month exceed expectations (market forecast +0.5%), it may reinforce the "inflation-rate hike" spiral expectation, prompting some funds to shift from BTC to inflation-protected bonds (TIPS). However, in the medium to long term, the logic of monetizing fiscal deficits still supports the hedging properties of crypto assets.
免责声明:本文章仅代表作者个人观点,不代表本平台的立场和观点。本文章仅供信息分享,不构成对任何人的任何投资建议。用户与作者之间的任何争议,与本平台无关。如网页中刊载的文章或图片涉及侵权,请提供相关的权利证明和身份证明发送邮件到support@aicoin.com,本平台相关工作人员将会进行核查。


