Ominous pattern recently emerged on the price chart of the most popular meme cryptocurrency in the world, Dogecoin (DOGE). The talk is about the 23-day moving average crossing from an upside down to a 200-day moving average, which forms a figure of technical analysis better known as death cross.
This is a pairing of Dogecoin to Bitcoin (BTC), by the way. The catch, however, and there is one, is that it happens on the two-day time frame of DOGE, which is not a common price chart setting many pay attention to.
Related

Mon, 03/17/2025 - 11:00 Binance's CZ Shares Hot Take on North Korean Hacker Bitcoin Data: $1.16 Billion BTC
Yuri Molchan
HOT Stories Cardano (ADA) on Verge of Overtaking Dogecoin (DOGE) Bollinger Bands Give XRP Chance for New All-Time High Breaking: Michael Saylor Announces New Strategy 130 Bitcoin (BTC) Acquisition Binance's CZ Shares Hot Take on North Korean Hacker Bitcoin Data: $1.16 Billion BTC
That said, in times when trading is more and more managed by algorithms, and bots and artificial intelligence are being implemented further into financial markets, particularly in cryptocurrencies, something seemingly exotic - even if it is just a slight tweak, like stretching the time frame to a two-day scale - may provide an angle few have considered.
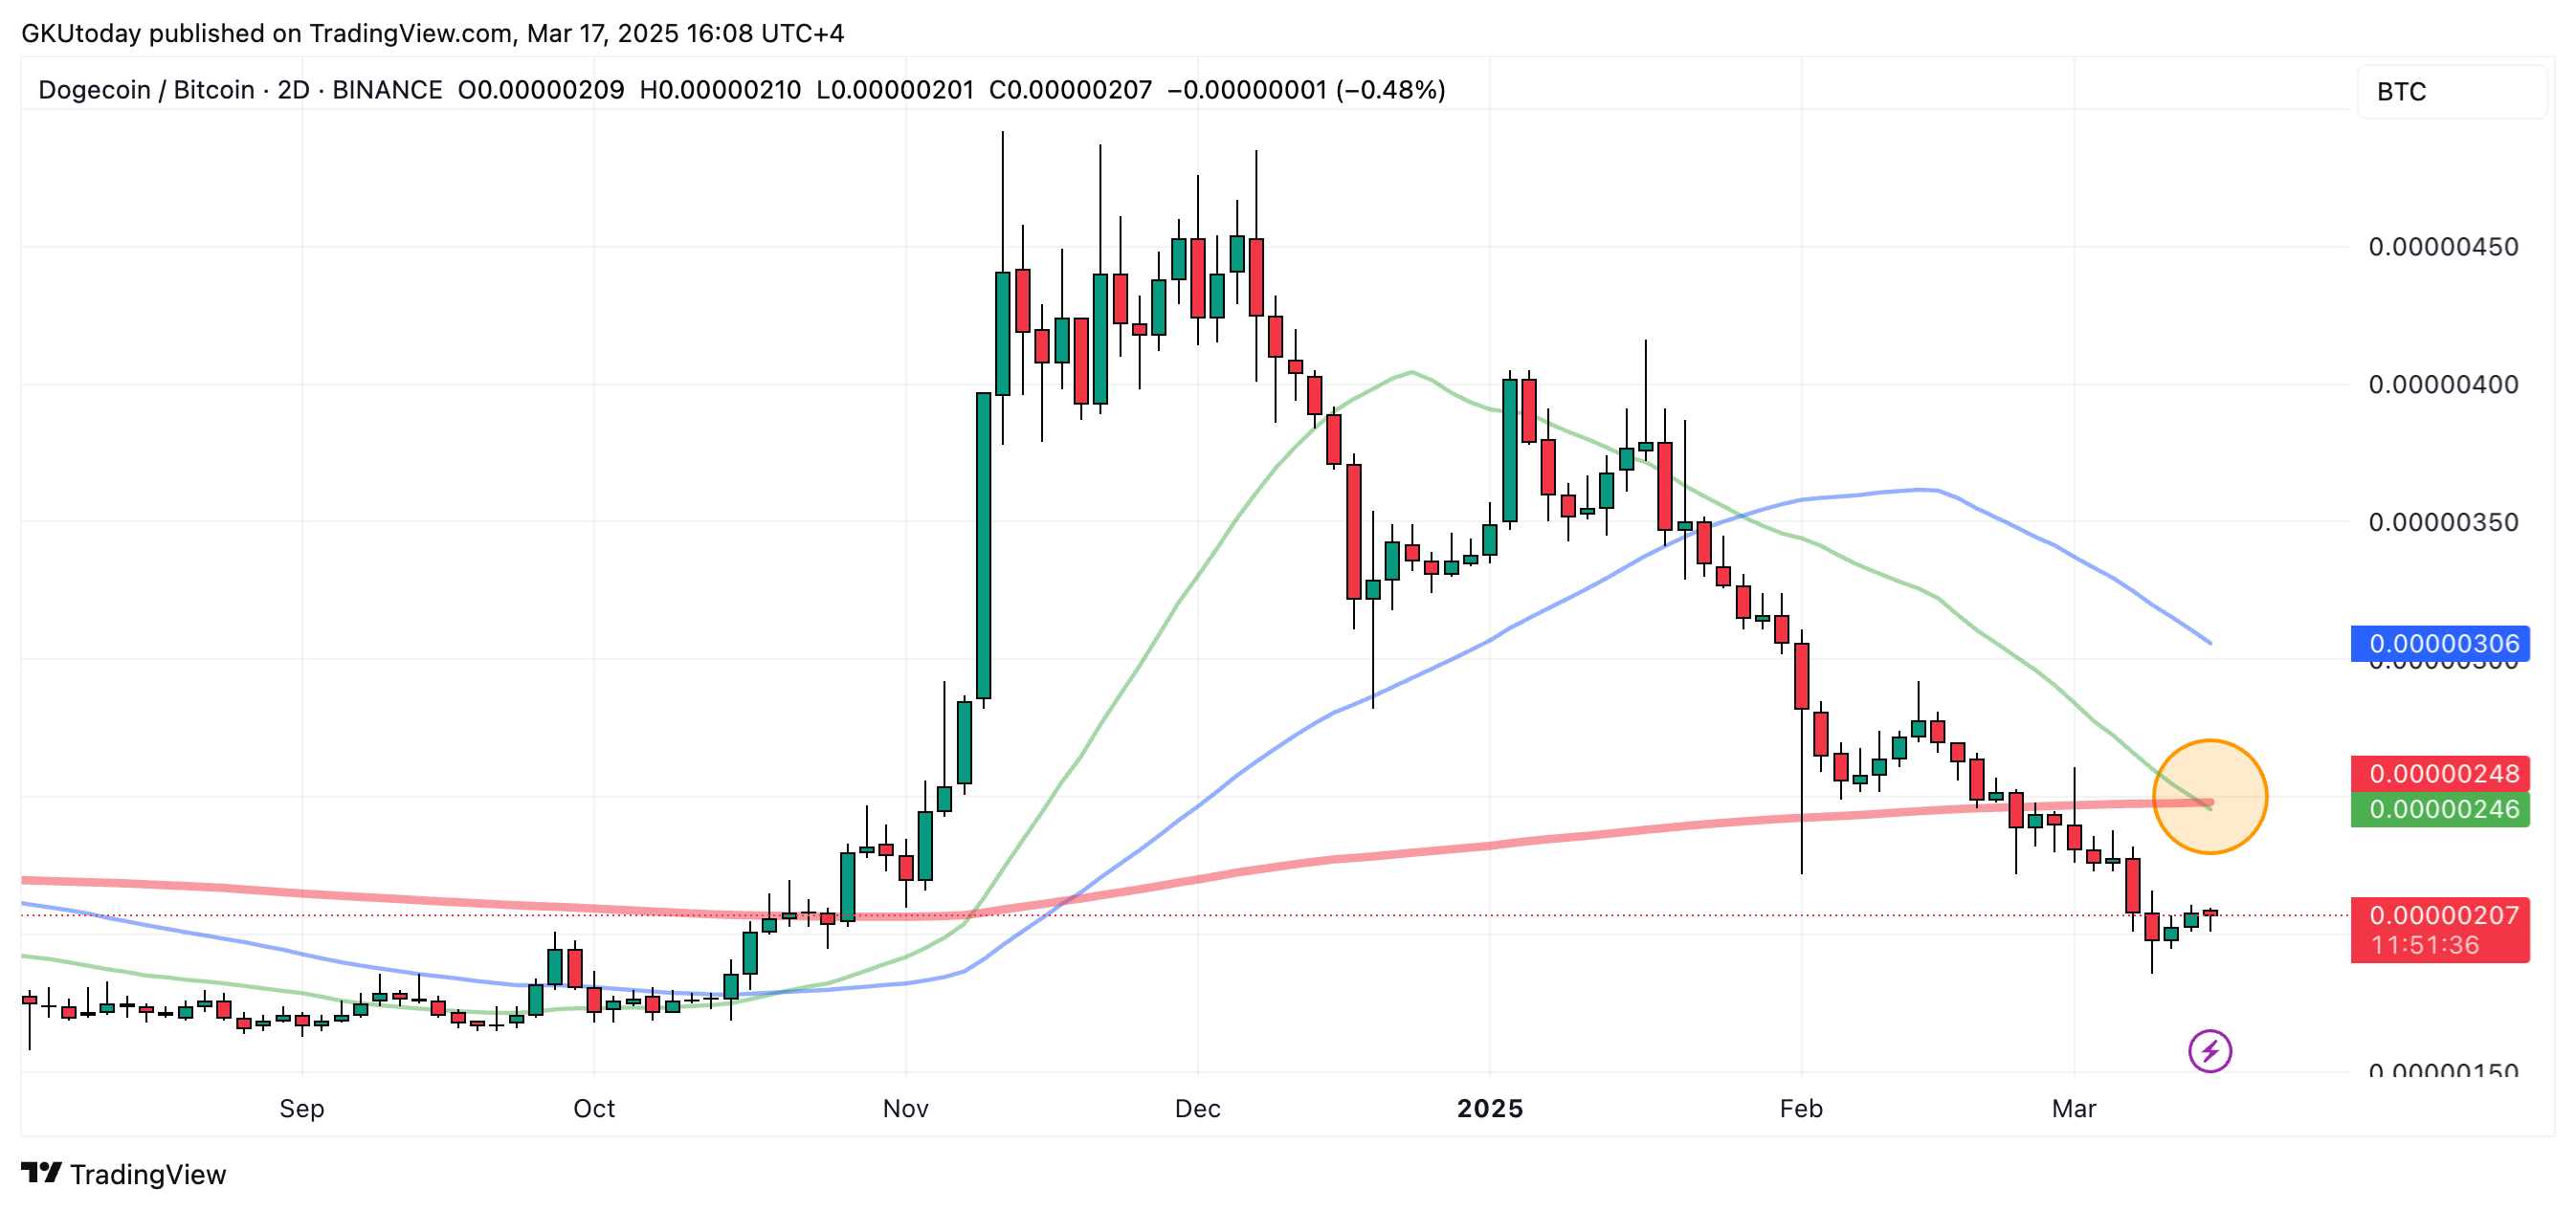
Source: TradingView
For Dogecoin, that angle happens to reveal a death cross for the meme coin versus BTC.
What is death cross?
If history and technical analysis have anything to say about it, the emergence of a death cross often signals a correction for the asset in question.
Given that DOGE has already been grinding lower, particularly after the brief euphoric bump surrounding the U.S. elections that quickly morphed into a kind of post-hype hangover, this fresh development could be the market's way of saying that Dogecoin will continue to lag behind Bitcoin.
Related

Sun, 03/16/2025 - 13:38 Dogecoin (DOGE) Witnesses Epic 400% Spike in Activity: Bullish?
Gamza Khanzadaev
If the market trends upward, DOGE might struggle to keep pace. If the market corrects downward, it could see even more painful dips relative to BTC.
While these technical signals are rarely set in stone, especially when they are not on the usual chart settings, they provide an interesting, if not cautionary, note to traders.
免责声明:本文章仅代表作者个人观点,不代表本平台的立场和观点。本文章仅供信息分享,不构成对任何人的任何投资建议。用户与作者之间的任何争议,与本平台无关。如网页中刊载的文章或图片涉及侵权,请提供相关的权利证明和身份证明发送邮件到support@aicoin.com,本平台相关工作人员将会进行核查。


