Bitcoin reached a peak of over $85,000 during the recently concluded weekend, but failed to maintain that level and continue rising. This morning, it dropped again to a low of $81,980, and as of the time of writing, the price is $94,054, with a 24-hour increase of approximately 1.74%. Other top ten tokens also declined simultaneously, with Ethereum striving to hold above $1,900, down 1.37% in the last 24 hours. The largest drop was seen in SOL, currently priced at $128.4, which has fallen nearly 6.16% in the last 24 hours.
This week, global financial markets are focused on the upcoming interest rate decision meetings in the United States, the United Kingdom, and Japan. Although the market generally expects the three major central banks to keep interest rates unchanged, the differing economic growth and inflation pressures faced by each country mean that officials' statements and policy hints will be the focal point for the market.
Bitcoin 4-Hour Chart
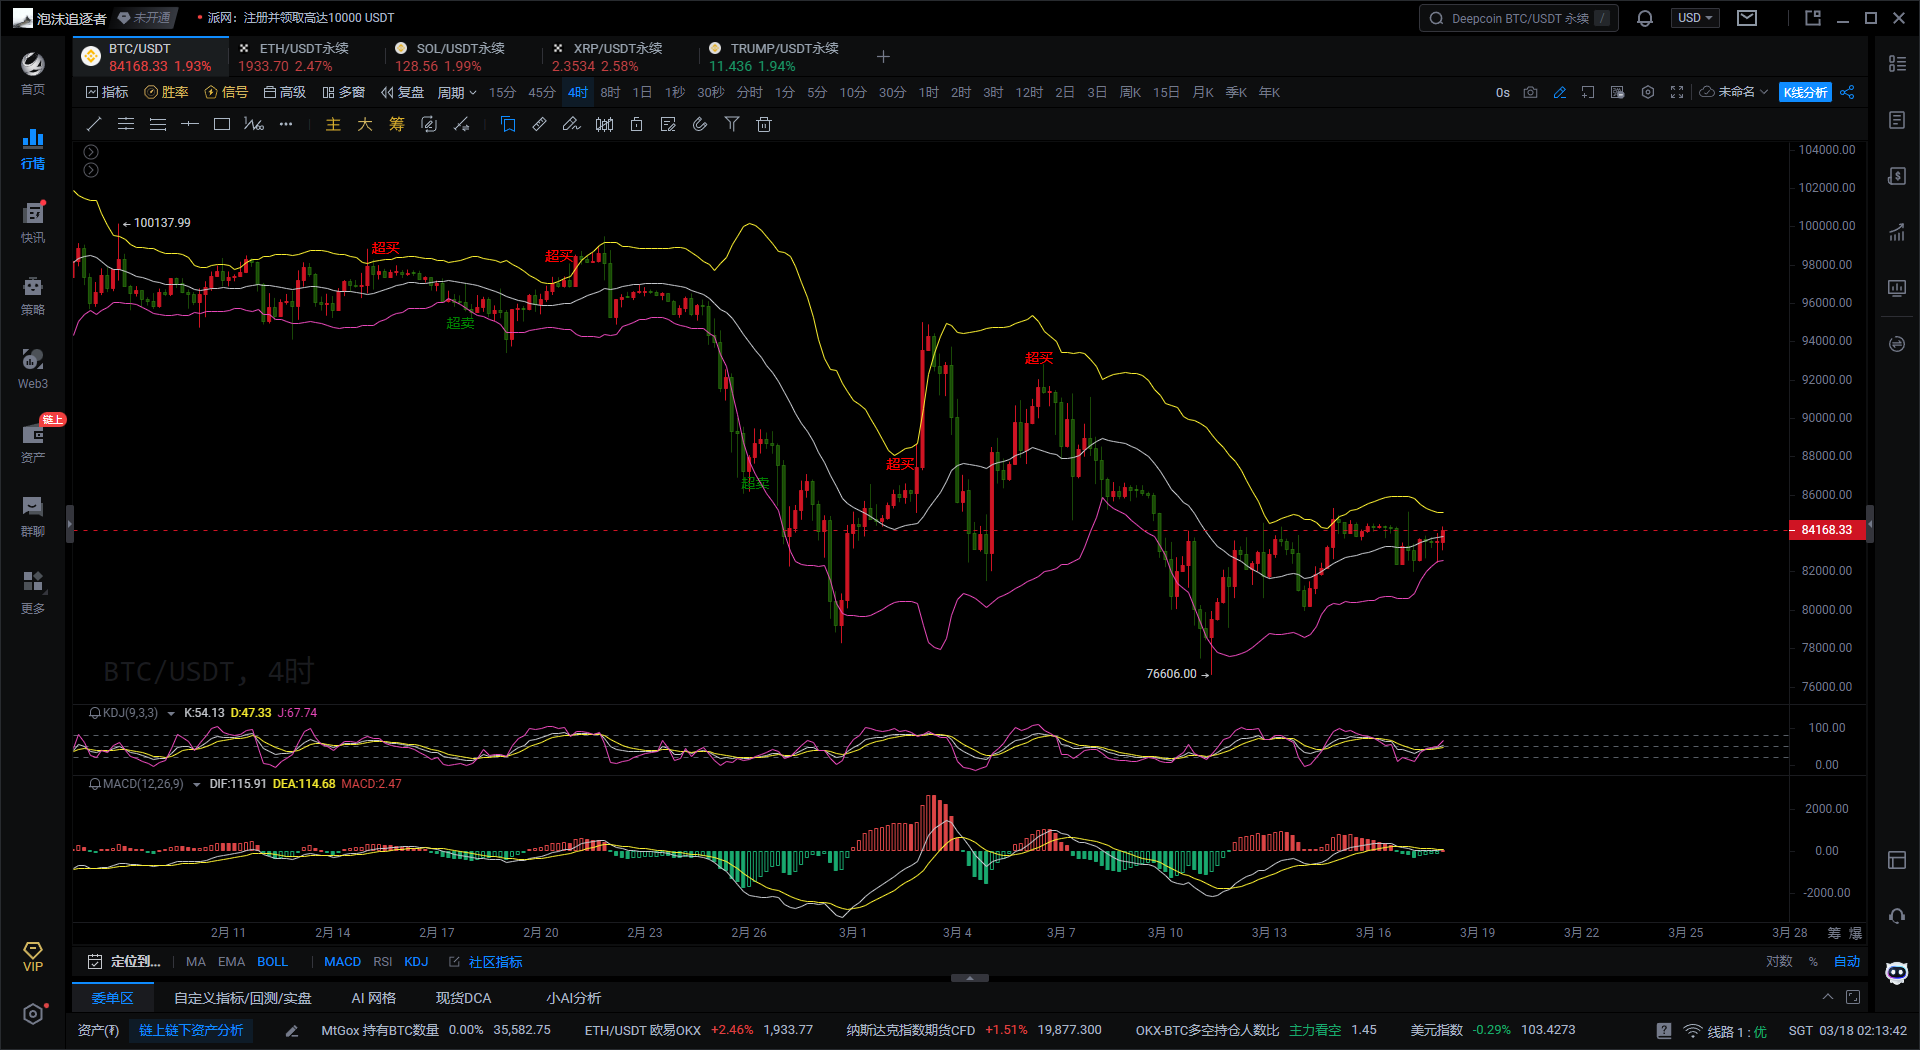
First, according to the Bollinger Bands indicator on the 4H Bitcoin chart, the current price is near the middle band and has not broken through the upper or lower bands, indicating that the market is still in a consolidation phase. However, the narrowing of the upper and lower bands suggests reduced volatility, which may lead to a trend change, potentially resulting in a breakout in the future.
Second, based on the MACD indicator on the 4H Bitcoin chart, the DIF line and DEA line are near the zero axis, and the MACD histogram is relatively short, showing that the market is in a weak consolidation phase with low momentum. However, there is a trend for the DIF line and DEA line to form a golden cross soon; if the golden cross is successful, it may lead to a wave of upward movement.
Finally, according to the KDJ indicator on the 4H Bitcoin chart, the K value and D value are at moderate levels, not entering obvious overbought or oversold areas, indicating significant uncertainty in the short term. However, the J value is slightly higher, suggesting a potential for some upward momentum in the short term. Still, it is necessary to observe whether the KDJ indicator will further diverge upwards.
In summary, Bitcoin is currently still in a consolidation range, but the MACD indicator is about to form a golden cross, and the narrowing of the Bollinger Bands suggests a potential breakout. However, the KDJ indicator has not shown clear signals for upward or downward movement.
Based on the above analysis, here are some suggestions for reference:
Buy Bitcoin on a pullback to around $83,440, with a stop loss at $82,900, aiming for profits at $85,100-$85,500, and if broken, look towards $96,000.
Instead of giving you a 100% accurate suggestion, I prefer to provide you with the right mindset and trend. After all, teaching someone to fish is better than giving them a fish; the goal is to earn for a lifetime by learning the right approach! Focus on the mindset, grasping the trend, and planning your market positions. What I can do is use my practical experience to help you make investment decisions and manage your operations in the right direction.
Time of writing: (2024-07-08, 11:25)

(Written by - Daxian Talks Coins) Disclaimer: Online publication may have delays; the above suggestions are for reference only. The author is dedicated to research and analysis in the fields of Bitcoin, Ethereum, altcoins, forex, stocks, etc., with years of experience in the financial market and rich practical operation experience. Investment carries risks; please proceed with caution. For more real-time market analysis, please follow the official account Daxian Talks Coins for discussion and exchange.
免责声明:本文章仅代表作者个人观点,不代表本平台的立场和观点。本文章仅供信息分享,不构成对任何人的任何投资建议。用户与作者之间的任何争议,与本平台无关。如网页中刊载的文章或图片涉及侵权,请提供相关的权利证明和身份证明发送邮件到support@aicoin.com,本平台相关工作人员将会进行核查。


