➤ Rational Range of the US Stock Market
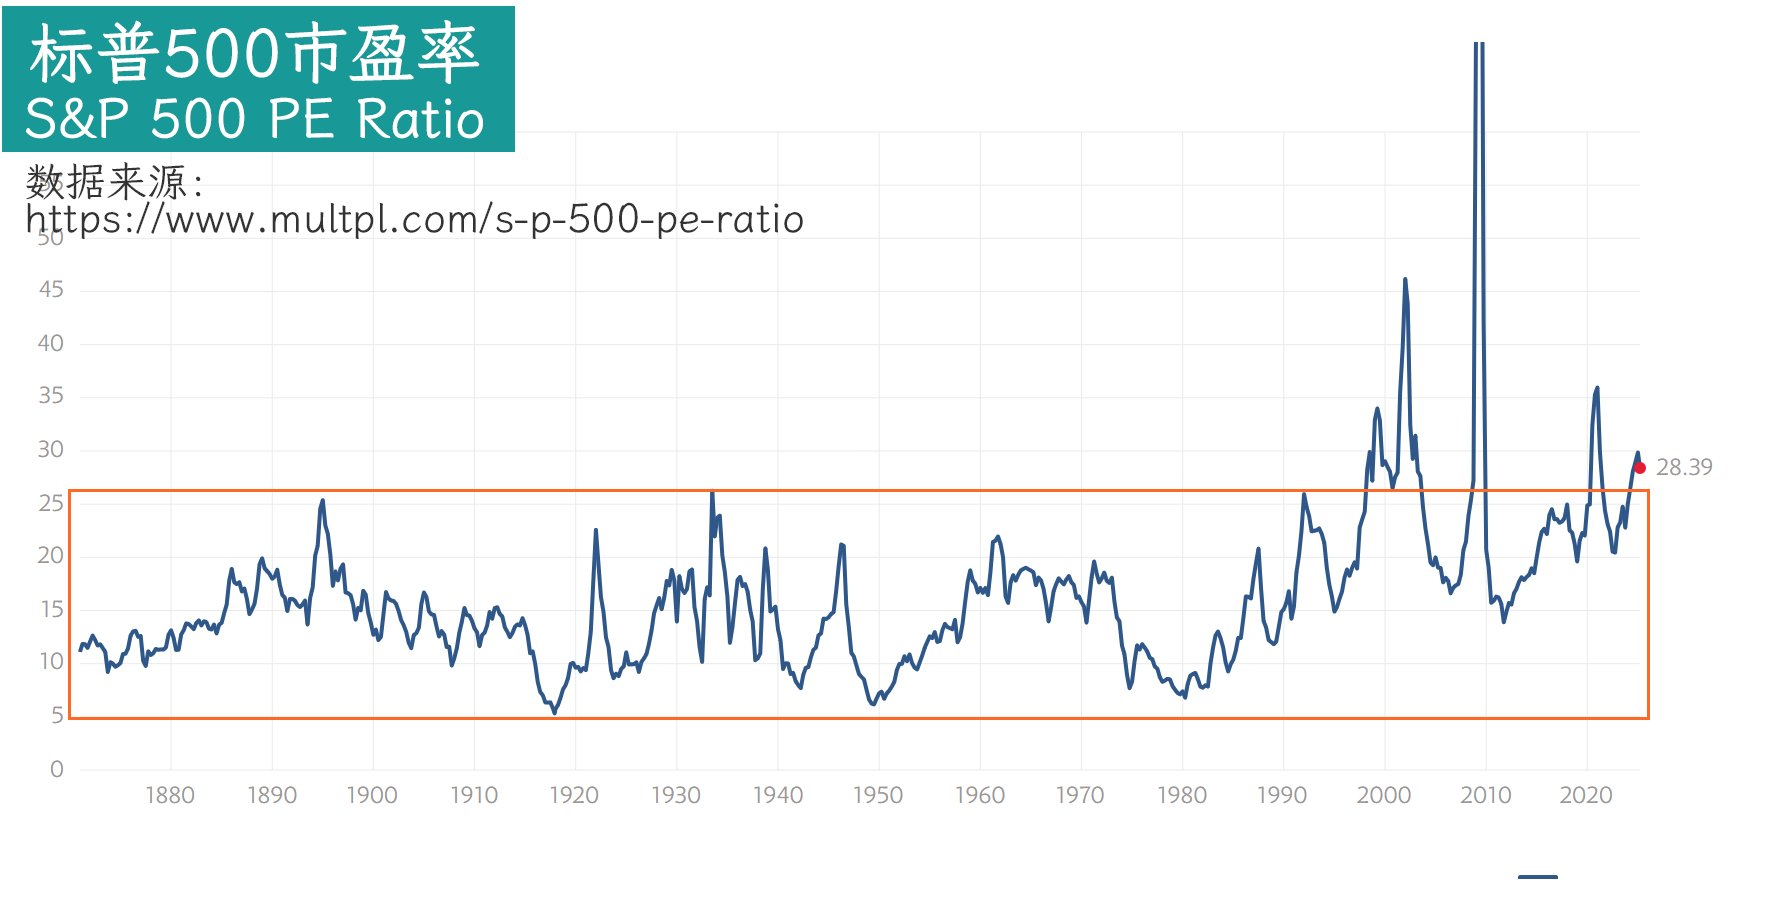
Pay attention to the price-to-earnings (P/E) ratio of the S&P 500, which is calculated by dividing the total market capitalization of the S&P 500 by the total earnings (net profit) of the past 12 months for companies that have released their financial reports.
From 1870 to 2000, over a span of 130 years, the P/E ratio of the S&P 500 fluctuated within a range, generally between 5 and 26.
➤ The US Stock Market is Currently at the Critical Point of a Bubble
This chart is based on earnings that have already been reported, specifically the net profits from Q1 2024 to Q4 2024.
The actual current P/E ratio should be calculated based on the net profits from Q2 2024 to Q1 2025.
Generally speaking, the market experiences continuous inflation, so the net profits from Q2 2024 to Q1 2025 may be greater than those from Q1 2024 to Q4 2024.
Thus, the actual P/E ratio may be somewhat lower than what is shown in the chart.
Additionally, the data in the chart is from March 18, and it may have declined further by March 19.
Therefore, the S&P 500 P/E ratio is basically at the upper edge of the bubble.
In other words, the US stock market is currently at the critical point of a bubble. If the P/E ratio continues to decline, the market will return to a rational range; if the P/E ratio rises, the market will re-enter the bubble range.
➤ US Stock Market Bubbles in the Last 25 Years
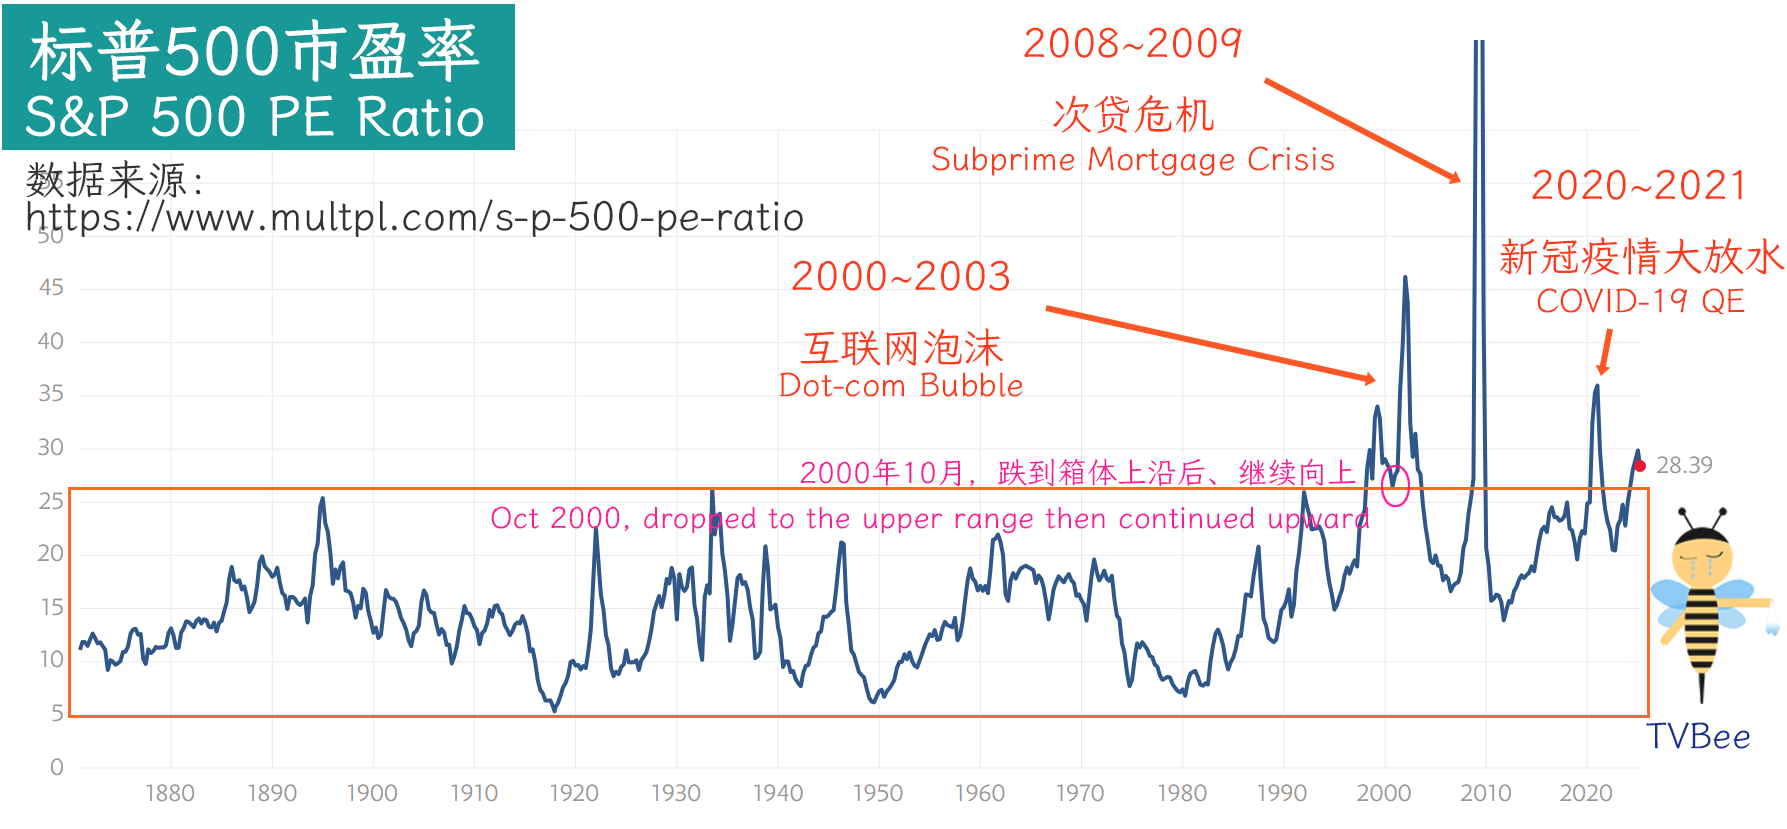
After 2000, the P/E ratio of the S&P 500 began to break out of the range.
The first time was from 2000 to 2003, during the internet bubble. The S&P 500 P/E ratio eventually fell to 16.61.
The second time was from 2008 to 2009, during the subprime mortgage crisis. The S&P 500 P/E ratio eventually fell to 13.88.
The third time was from 2020 to 2021, during the COVID-19 pandemic. The S&P 500 P/E ratio eventually fell to 20.22.
The fourth time is expected to be from the end of 2024 to early 2025, coinciding with Trump's re-election. Additionally, there should also be subsequent effects from the monetary easing after the COVID-19 pandemic. Currently,
In the first three instances, each time, the S&P 500 P/E ratio fell back into the range (5 to 26).
Therefore, this time, the S&P 500 P/E ratio may also fall back into the range.
➤ Will it be like October 2000?
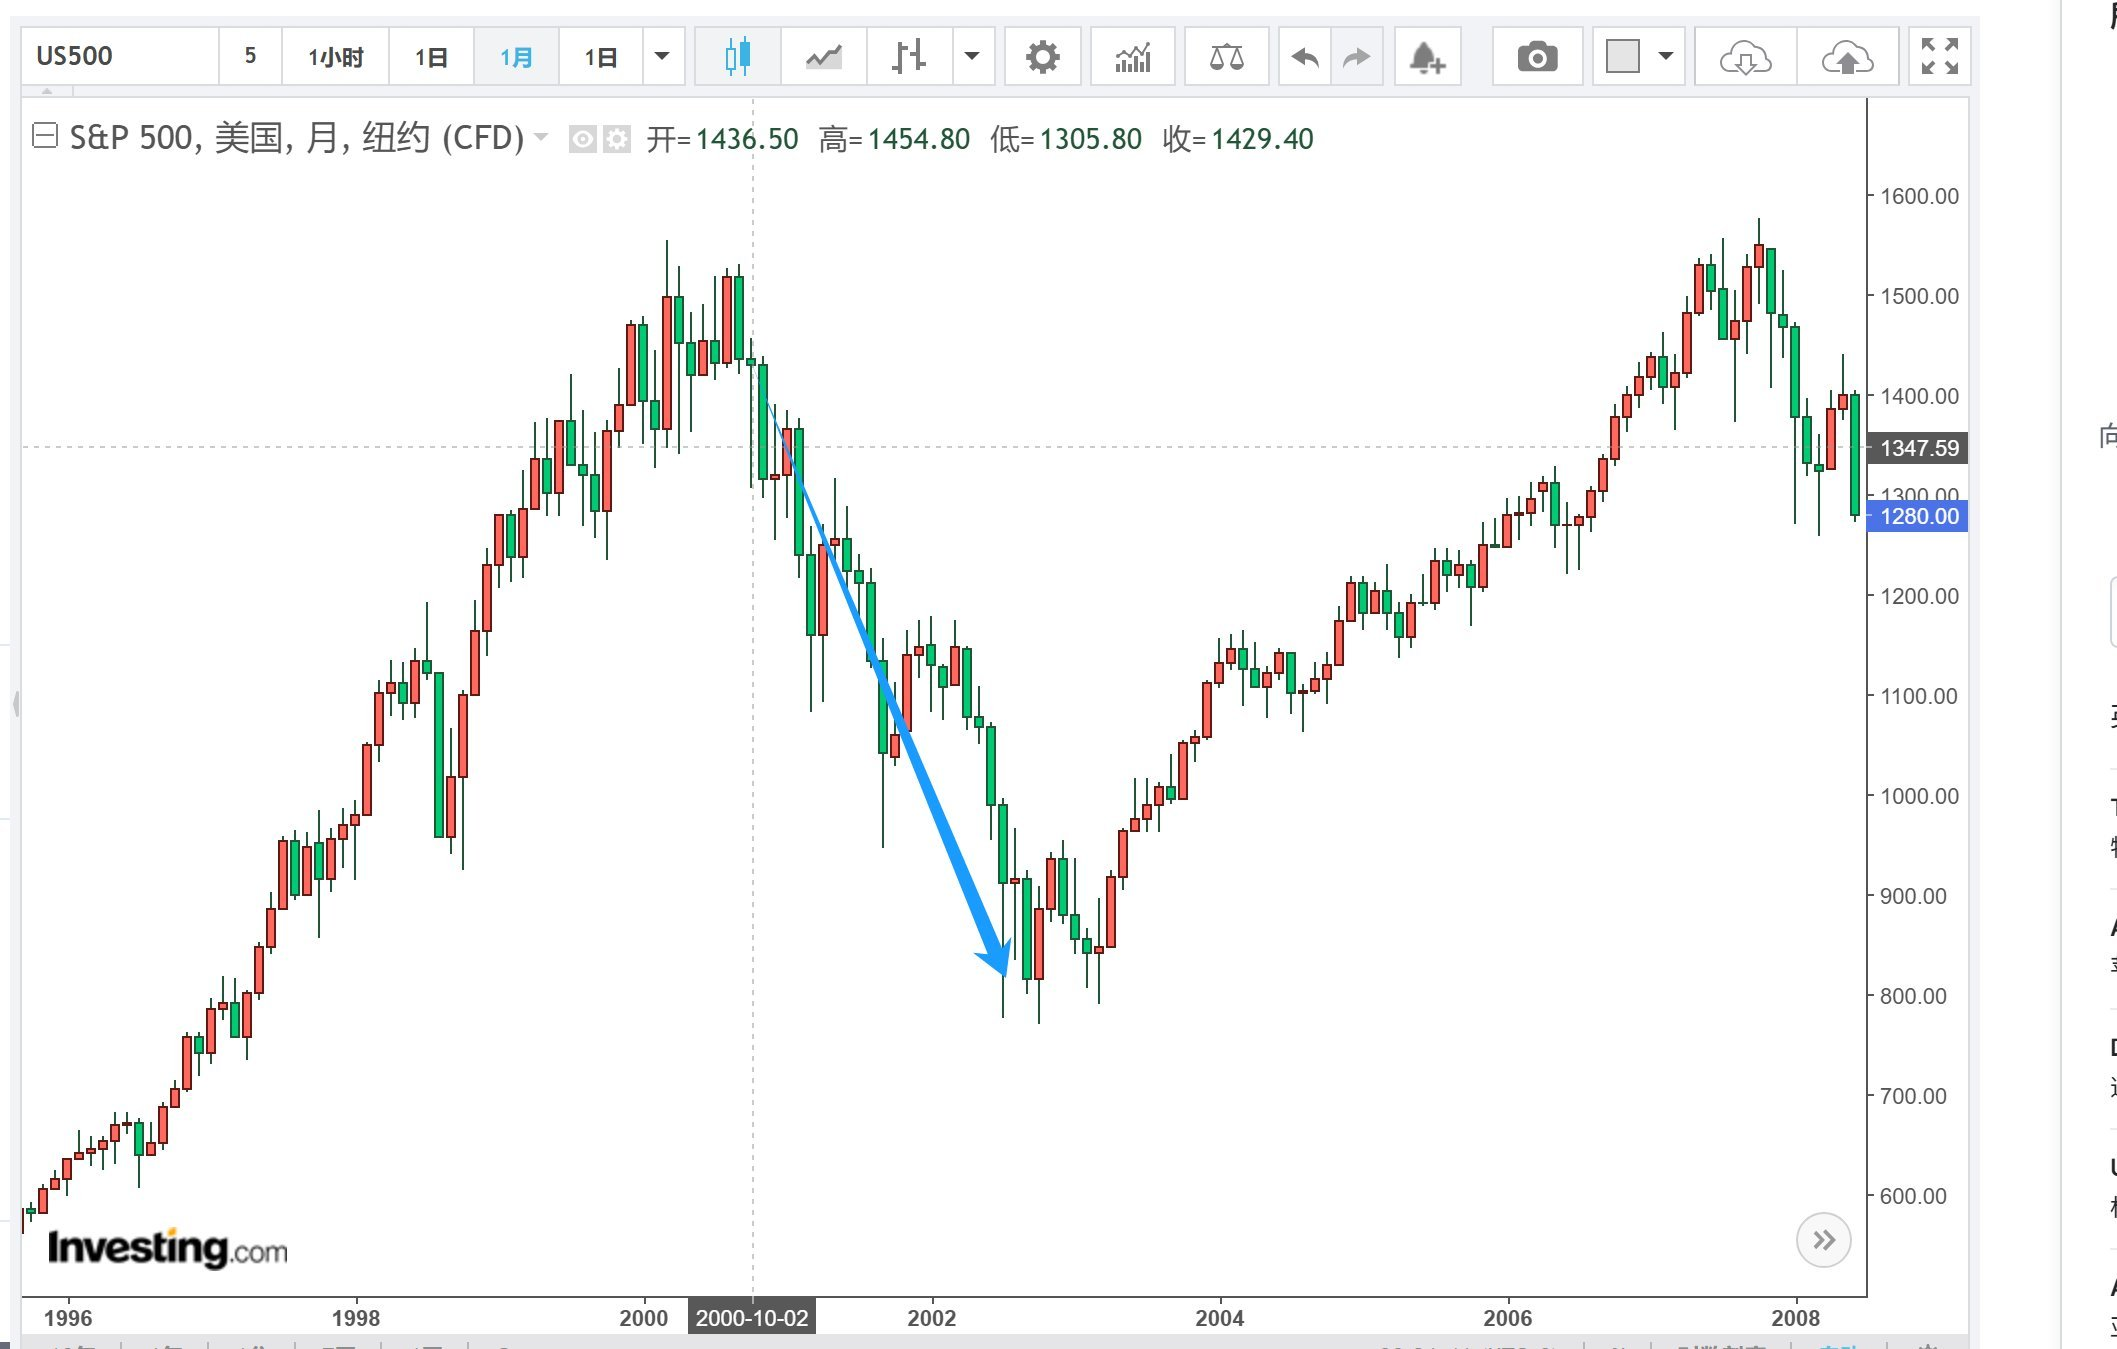
One instance was somewhat special: in October 2000, the S&P 500 P/E ratio fell to the upper edge of the range and then continued to rise.
Some believe that the current AI boom has a certain logical comparability to the internet bubble of 2000. So, will the P/E ratio rebound next?
I’m sorry, but after October 2000, although the S&P 500 P/E ratio rose, the S&P 500 index actually fell. It was just that the decline in net profits of S&P 500 companies was greater than the decline in market capitalization. 😥
➤ Final Thoughts
If the US stock market continues to decline, BTC will find it hard to shine alone. A pessimistic estimate would see a synchronized decline with the US stock market. An optimistic estimate would suggest a bottoming out with possible rebounds and further dips. As for altcoins, one can only say that each will meet their fate, so Brother Bee did not buy the dip.
Note: This is a one-sided analysis from the perspective of the US stock market P/E ratio and does not constitute comprehensive analysis or investment advice.
免责声明:本文章仅代表作者个人观点,不代表本平台的立场和观点。本文章仅供信息分享,不构成对任何人的任何投资建议。用户与作者之间的任何争议,与本平台无关。如网页中刊载的文章或图片涉及侵权,请提供相关的权利证明和身份证明发送邮件到support@aicoin.com,本平台相关工作人员将会进行核查。