Source: Cointelegraph Original: "{title}"
Ethereum's native token, Ether (ETH), has repeatedly entered oversold territory relative to Bitcoin (BTC) in recent months, yet this altcoin has not shown any signs of finding a price bottom. The current trading situation is actually quite similar to a previous scenario, and Ether's market structure suggests that this situation may play out again in the second to third quarter of this year.
Ether's repeated breakdowns suggest more downside potential
The relative strength index (RSI) for Ether on the 3-day timeframe remains below 30, a level that typically indicates a potential rebound.
However, historical price patterns indicate that previous instances of entering oversold conditions have not marked a clear bottom. Each time oversold conditions occurred, prices continued to decline, reflecting a persistent bearish momentum.
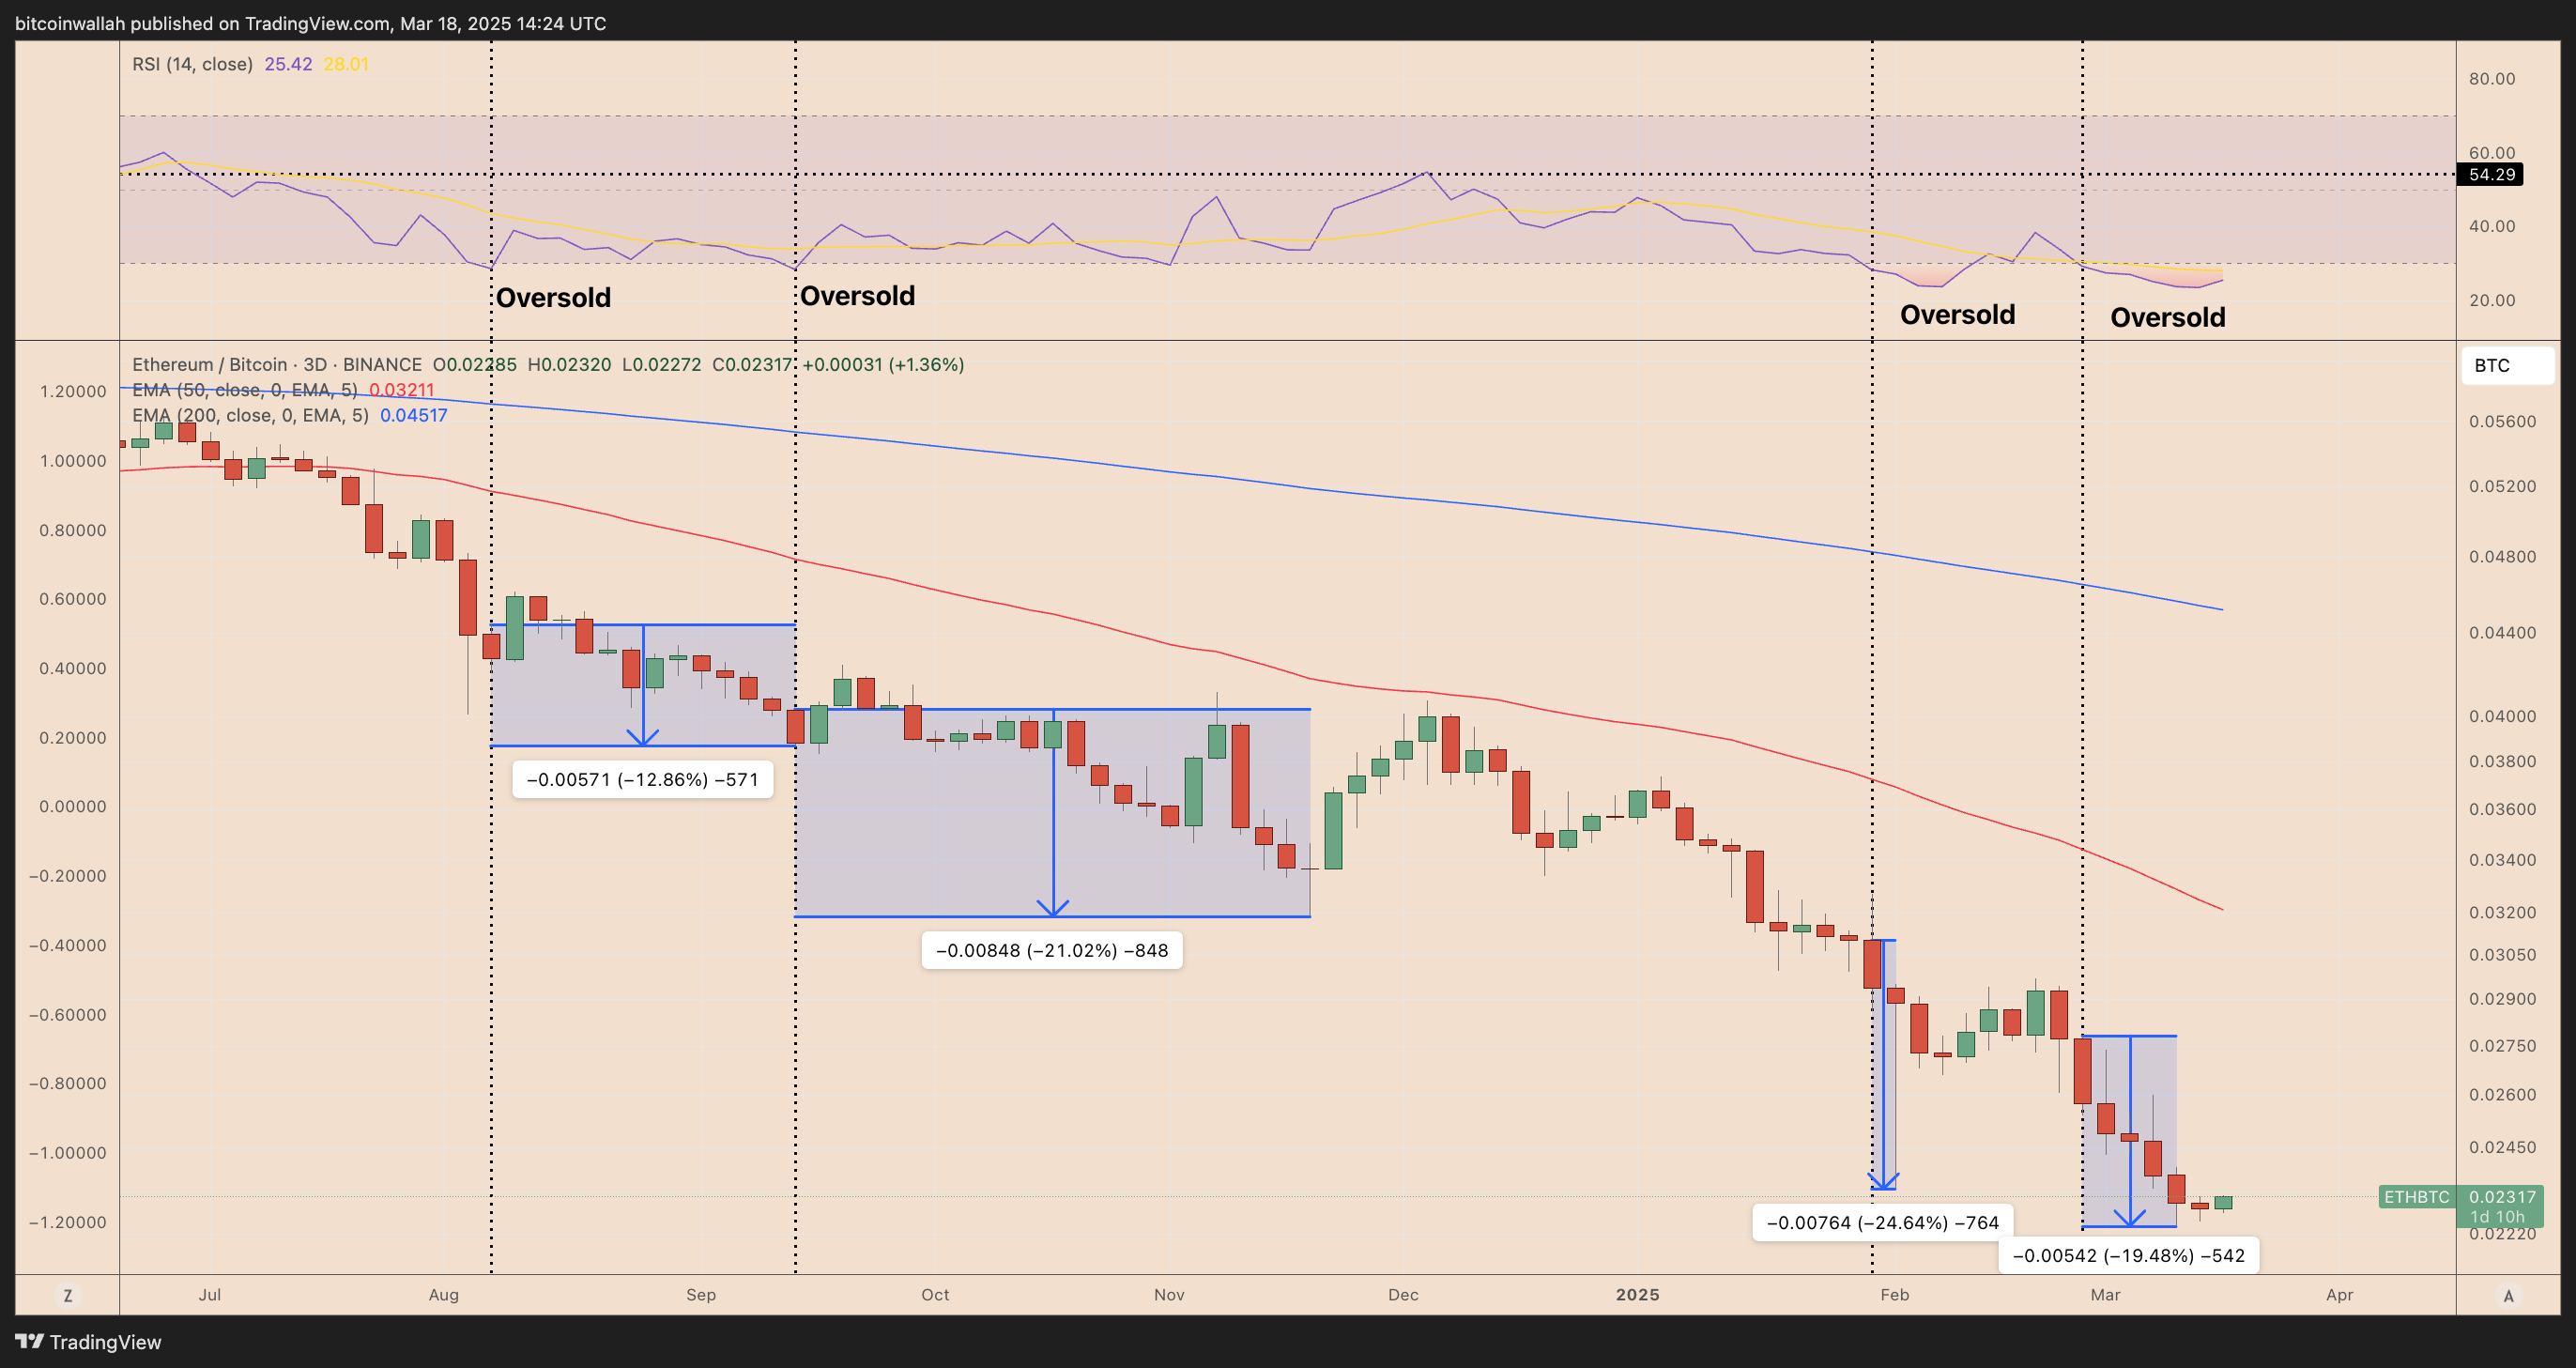
ETH/BTC 3-day price chart. Source: TradingView
Since mid-2024, the ETH/BTC trading pair has experienced multiple breakdowns, quickly declining by approximately 13%, 21%, 25%, and 19.5%. Additionally, both the 50-day exponential moving average (EMA) and the 200-day EMA are trending downward, confirming a lack of bullish strength.
Market analyst @CarpeNoctom on platform X emphasized Ether's negative price performance, noting that the ETH/BTC trading pair failed to confirm a bullish divergence on its weekly chart (i.e., prices made new lows while the RSI made higher lows).
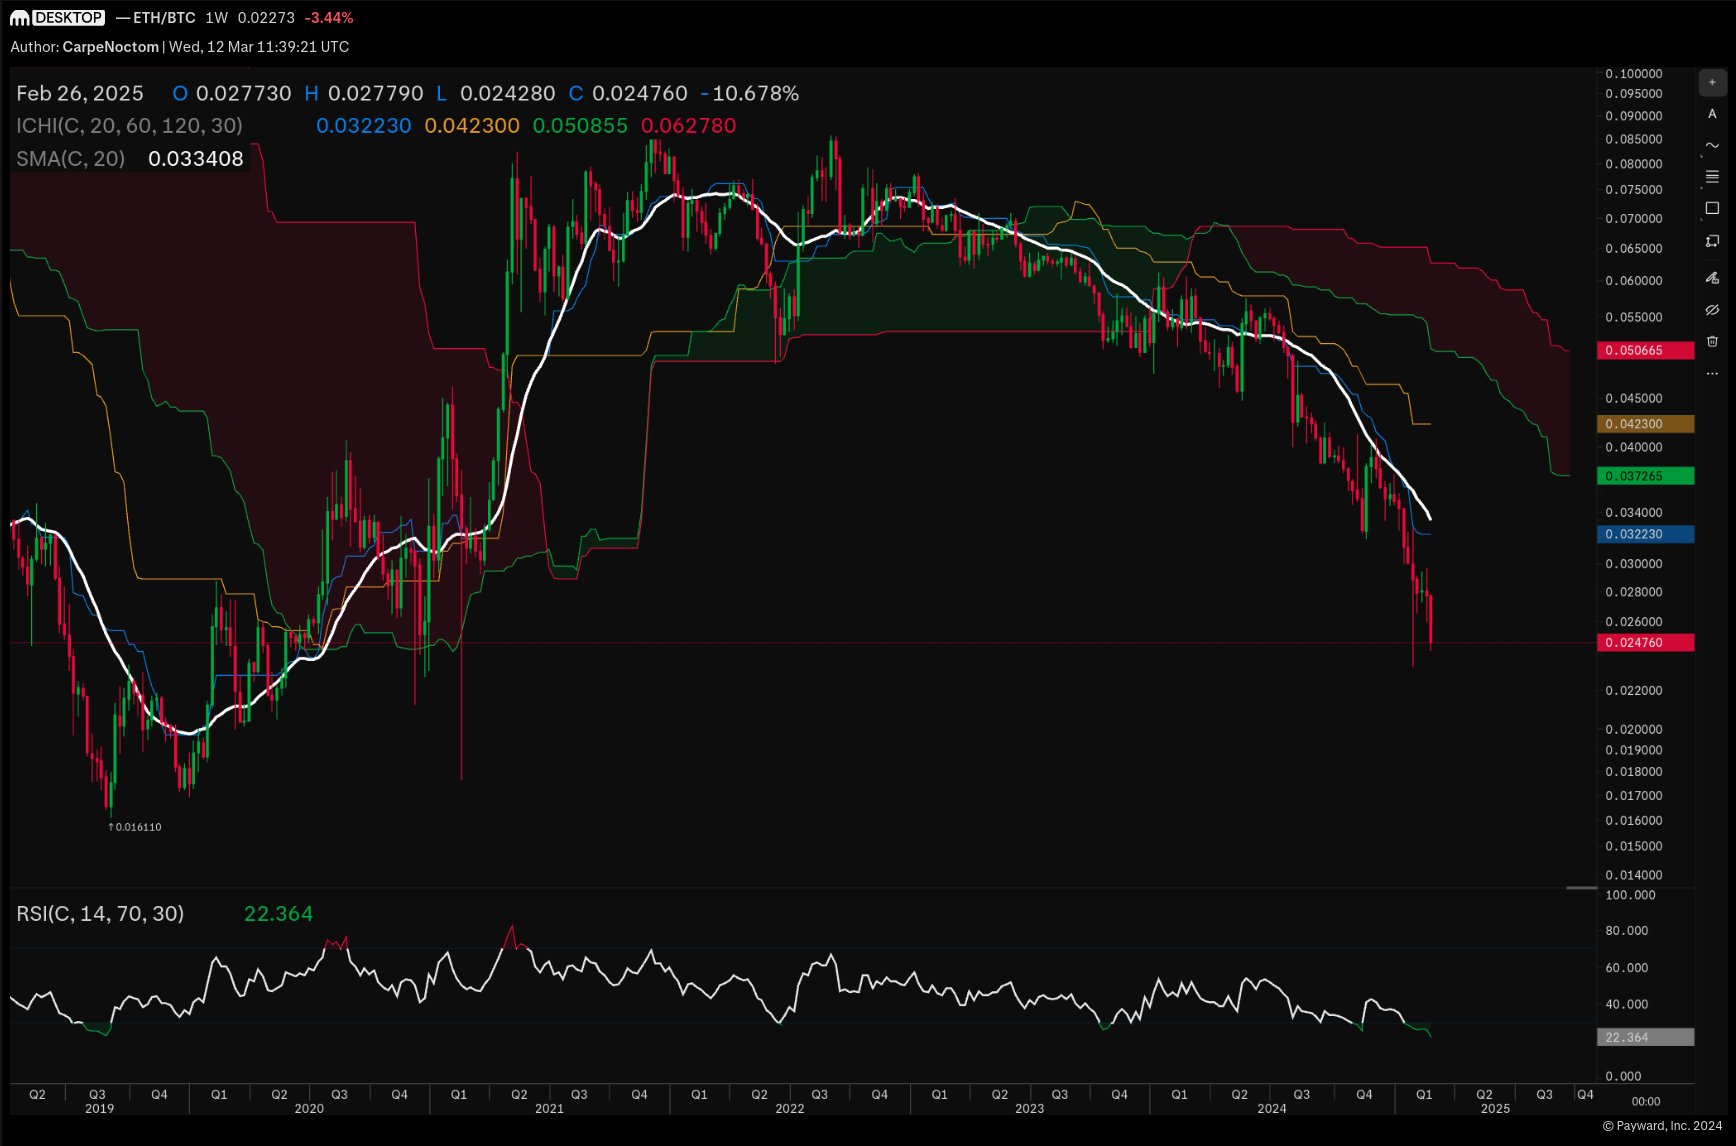
ETH/BTC weekly price chart. Source: TradingView/CryptoNoctom
Ethereum ETF outflows and on-chain data suggest further price weakness
Compared to the broader cryptocurrency market, the "curse-like" downward trend of ETH/BTC is particularly pronounced. This includes ongoing outflows from spot-based Ethereum ETFs in the U.S. and negative on-chain data.
As of March, the net inflow of funds into spot Ether ETFs decreased by 9.8%, dropping to $2.54 billion. In contrast, the net inflow for spot Bitcoin ETFs during the same period fell by 2.35%, down to $35.74 billion.
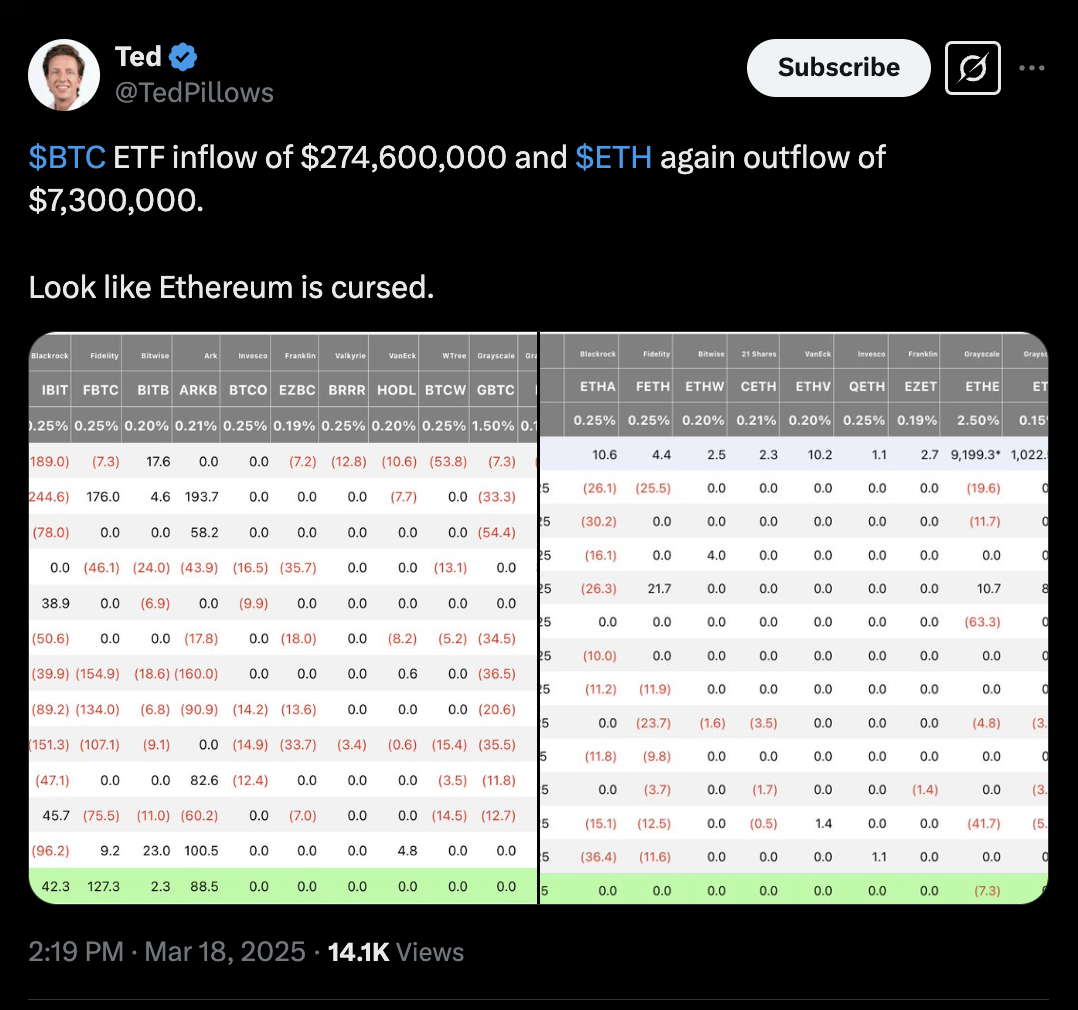
Source: Ted Pillows
Meanwhile, as of March, Ethereum's gas fees (measured by the median daily gas consumption on the mainnet) were approximately 1.12 GWEI, nearly one-fiftieth of what they were a year ago.
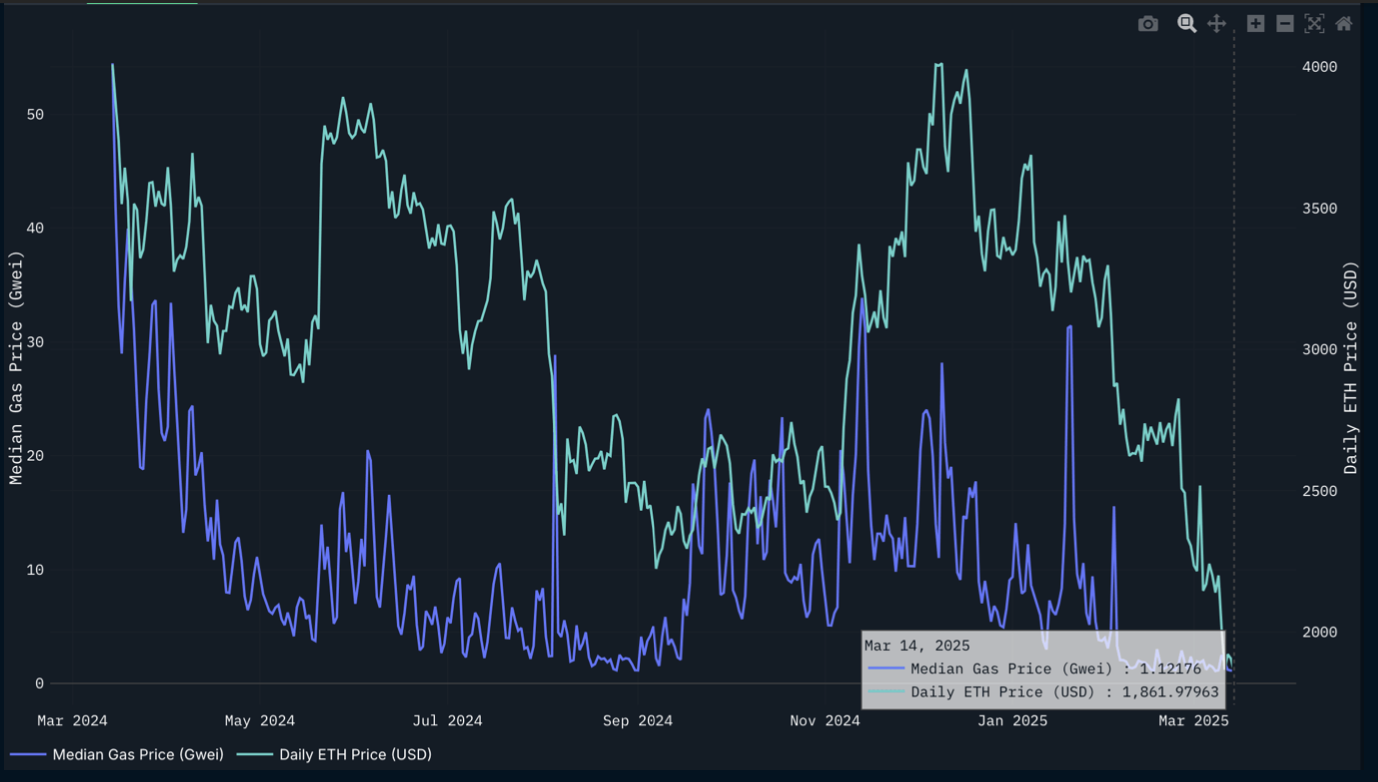
Comparison of Ethereum's median gas fees and Ether price (in USD). Source: Nansen
Data analysis platform Nansen stated in its latest report: "Although Ether's price experienced a second rebound by the end of 2024, the mainnet activity measured by gas consumption has never fully recovered." The report further noted, "This is due to various factors, but in 2024, most activity has shifted to Solana and Layer 2 networks (L2)."
Nansen believes that due to the unfavorable risk/reward ratio of Ether compared to Bitcoin, and its lack of advantage over undervalued altcoins focused on niche markets, they maintain a cautious bearish outlook on Ether.
Further evidence of insufficient market demand for Ether relative to Bitcoin can be seen in Ethereum's futures trading volume data.
Notably, Bitcoin's futures trading volume has rebounded by 32% from a low on February 23, reaching $57 billion on March 18. In contrast, according to on-chain data platform Glassnode, Ethereum's trading activity has remained relatively stable.
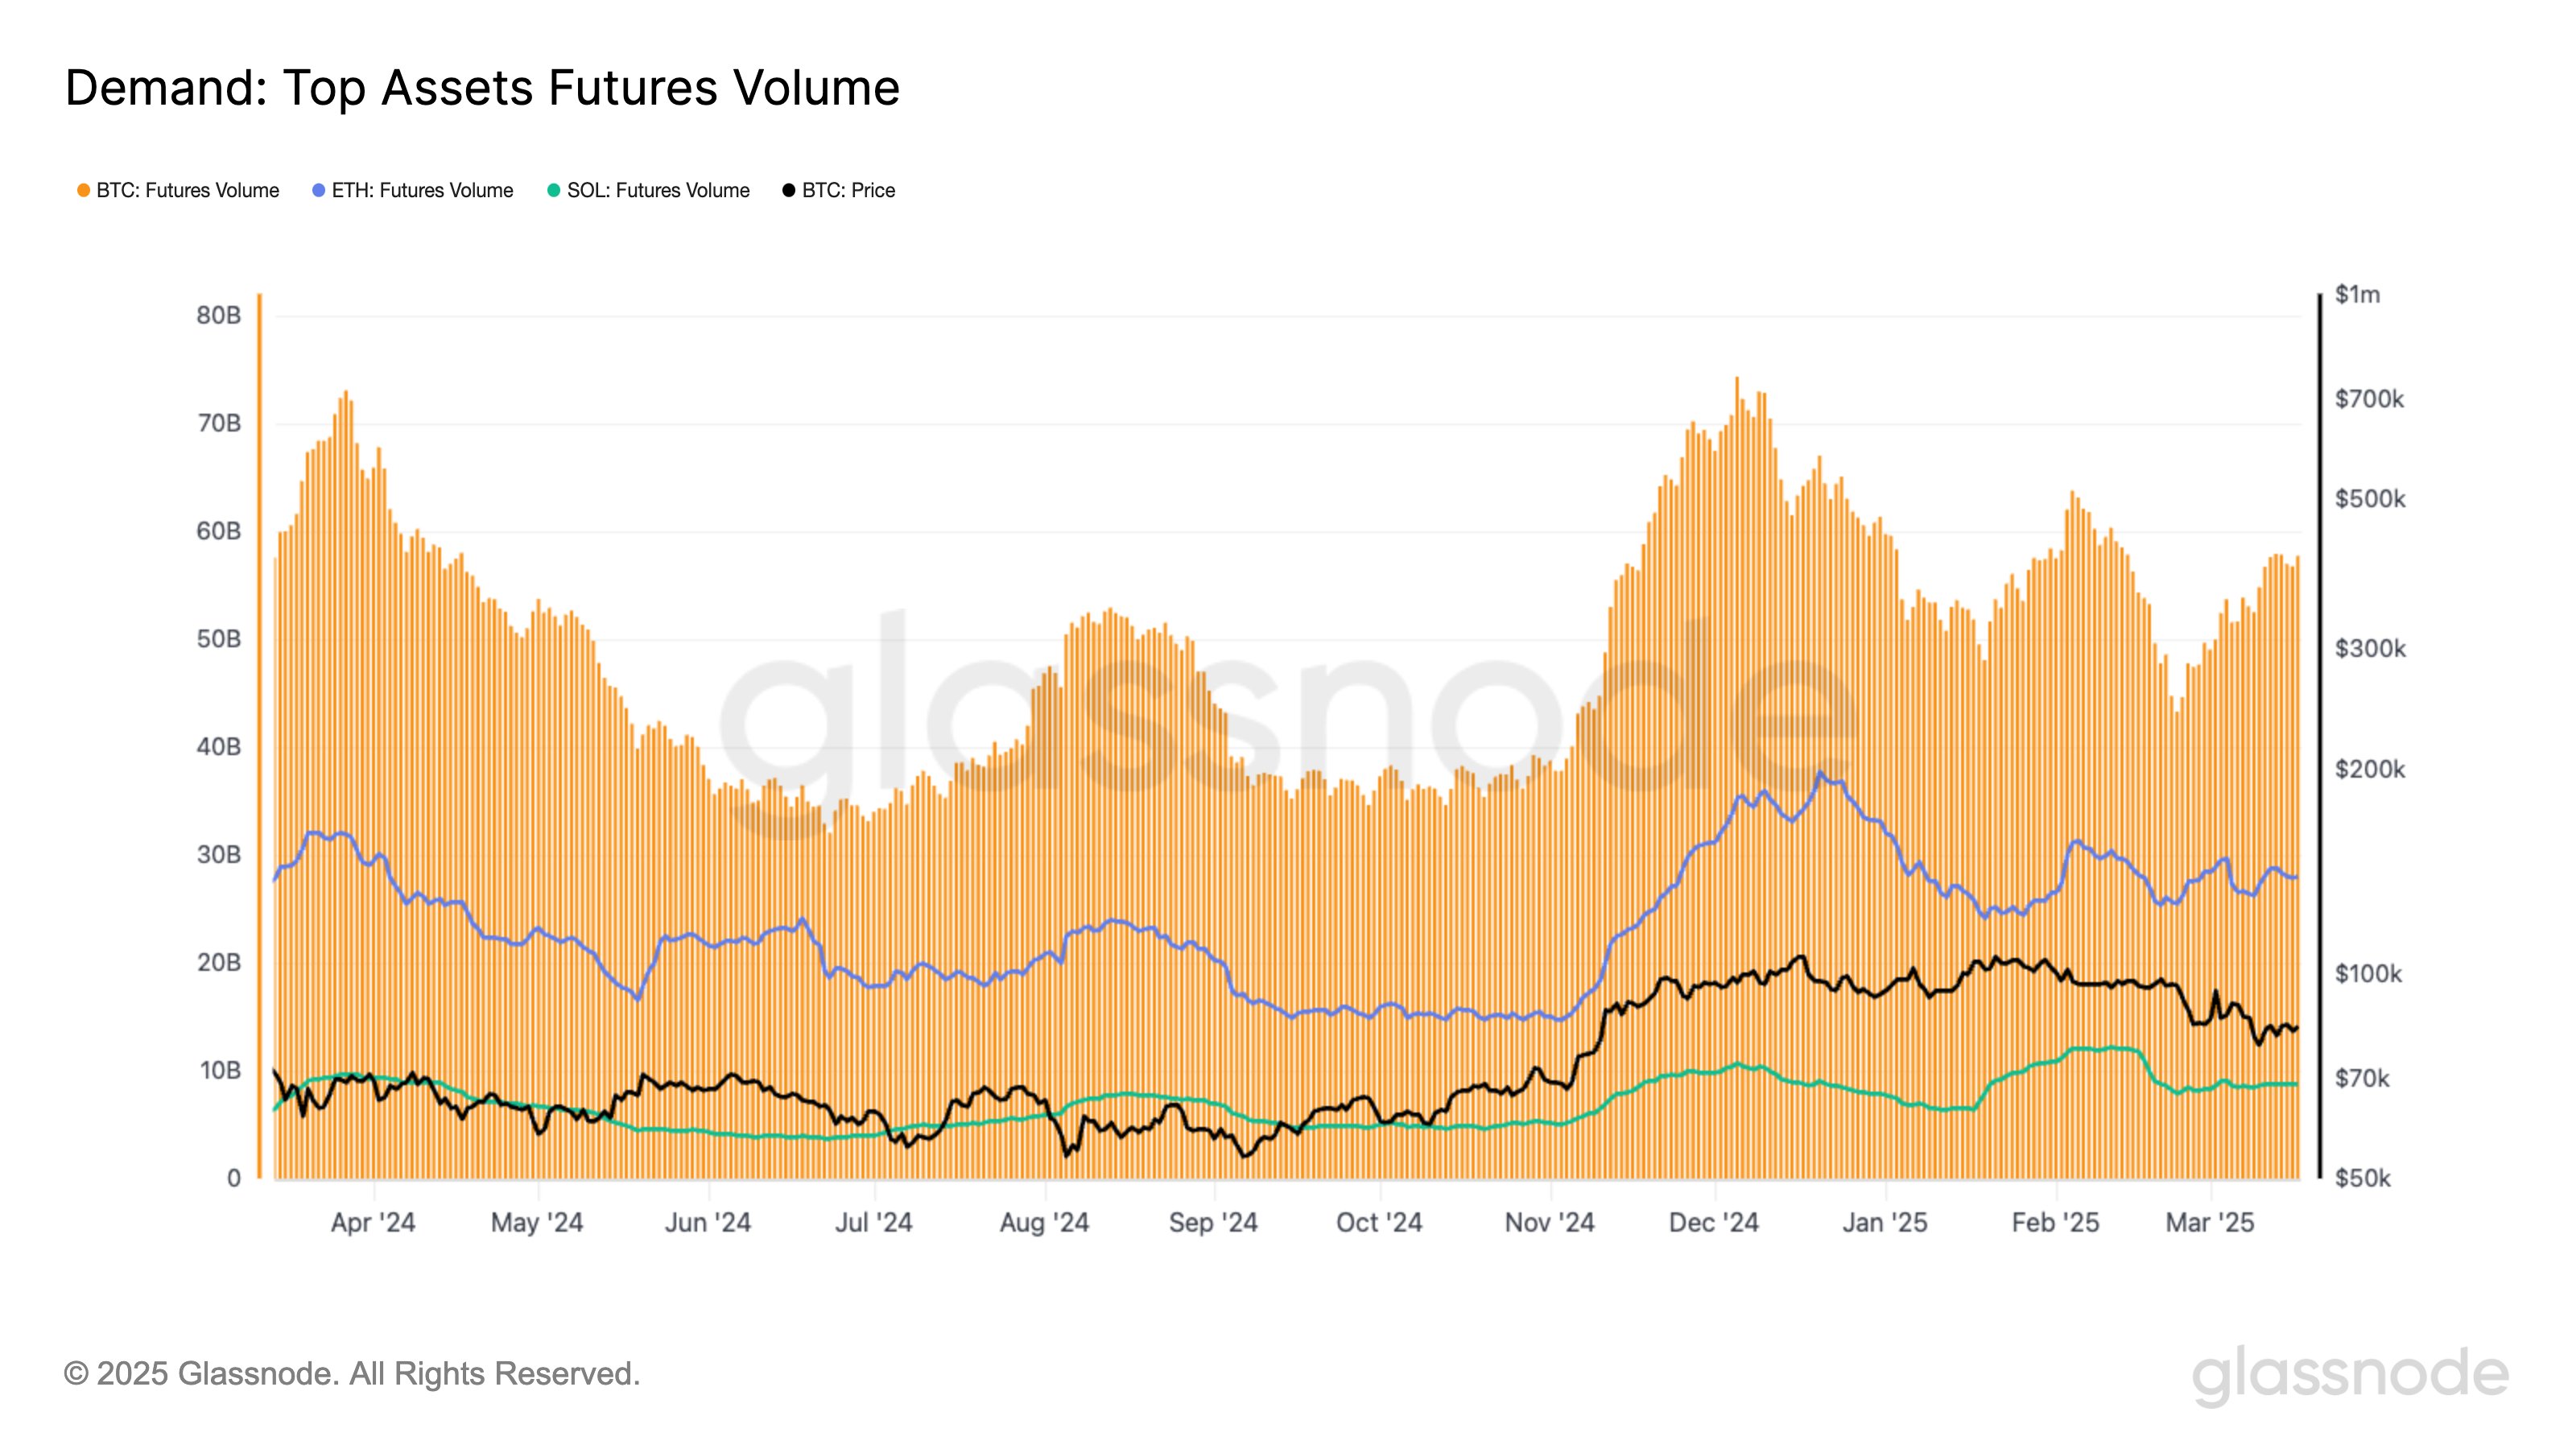
Comparison of futures trading volumes for Bitcoin, Ethereum, and Solana. Source: Glassnode
ETH/BTC trading pair may drop another 15%
The ETH/BTC trading pair is forming a bearish flag pattern on the daily chart, characterized by a consolidation period within converging trendlines following a significant decline.
From a technical perspective, the bearish flag pattern is confirmed when the price breaks below the lower trendline and declines by an amount comparable to the previous downtrend. Applying the same rules to ETH/BTC, the target price for April's decline is set at 0.01968 BTC, which is 15% lower than the current level.
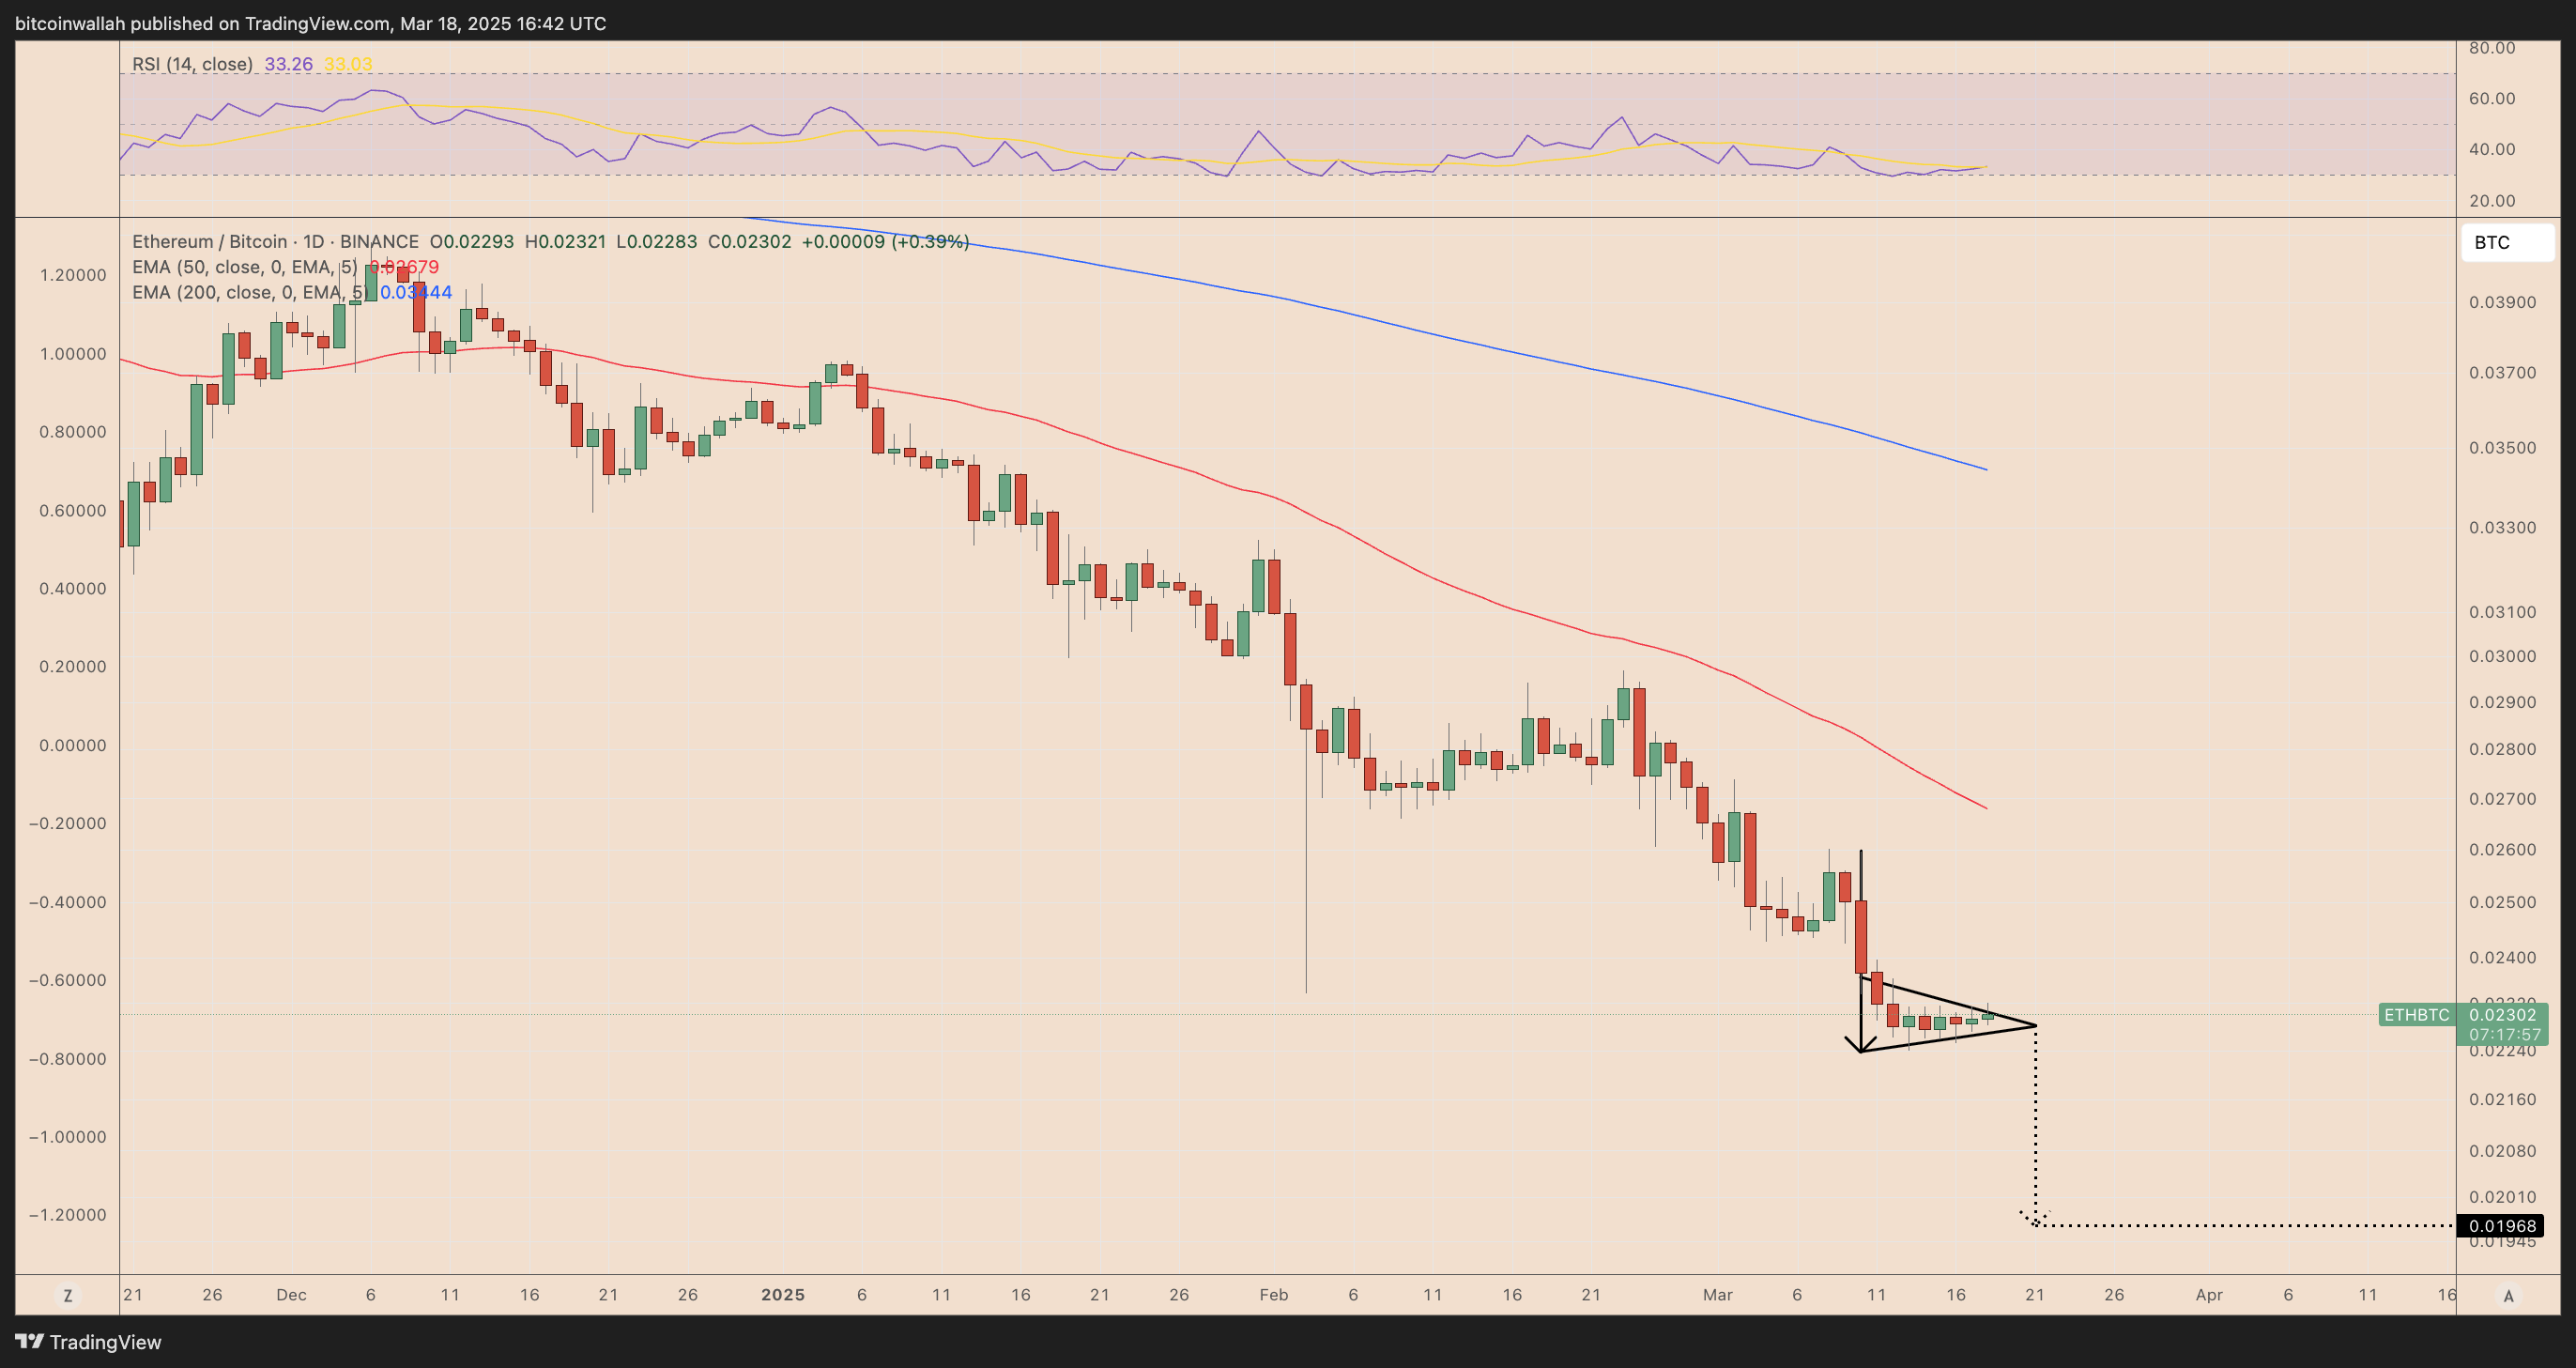
ETH/BTC daily price chart. Source: TradingView
Additionally, the 50-day EMA and 200-day EMA remain on a sharply downward trajectory, with the trading price of the ETH/BTC pair significantly below these key levels, indicating a continued bearish market structure.
Despite the evident downside risks, a bullish scenario could emerge if ETH/BTC breaks above the resistance of the flag pattern and turns the 50-day EMA into a support level.
This article does not contain investment advice or recommendations. Every investment and trading action carries risks, and readers should conduct their own research when making decisions.
Related: Standard Chartered cuts 2025 Ethereum price forecast by 60% to $4,000.
免责声明:本文章仅代表作者个人观点,不代表本平台的立场和观点。本文章仅供信息分享,不构成对任何人的任何投资建议。用户与作者之间的任何争议,与本平台无关。如网页中刊载的文章或图片涉及侵权,请提供相关的权利证明和身份证明发送邮件到support@aicoin.com,本平台相关工作人员将会进行核查。


