Hello everyone, on the afternoon of March 13, we won't delve into those lofty and complex theories; instead, let's talk about the most basic concepts in volume-price analysis: "Three Consecutive Up Days" and "Three Consecutive Down Days." Don't underestimate their simplicity; if used correctly, they can help you seize many opportunities!
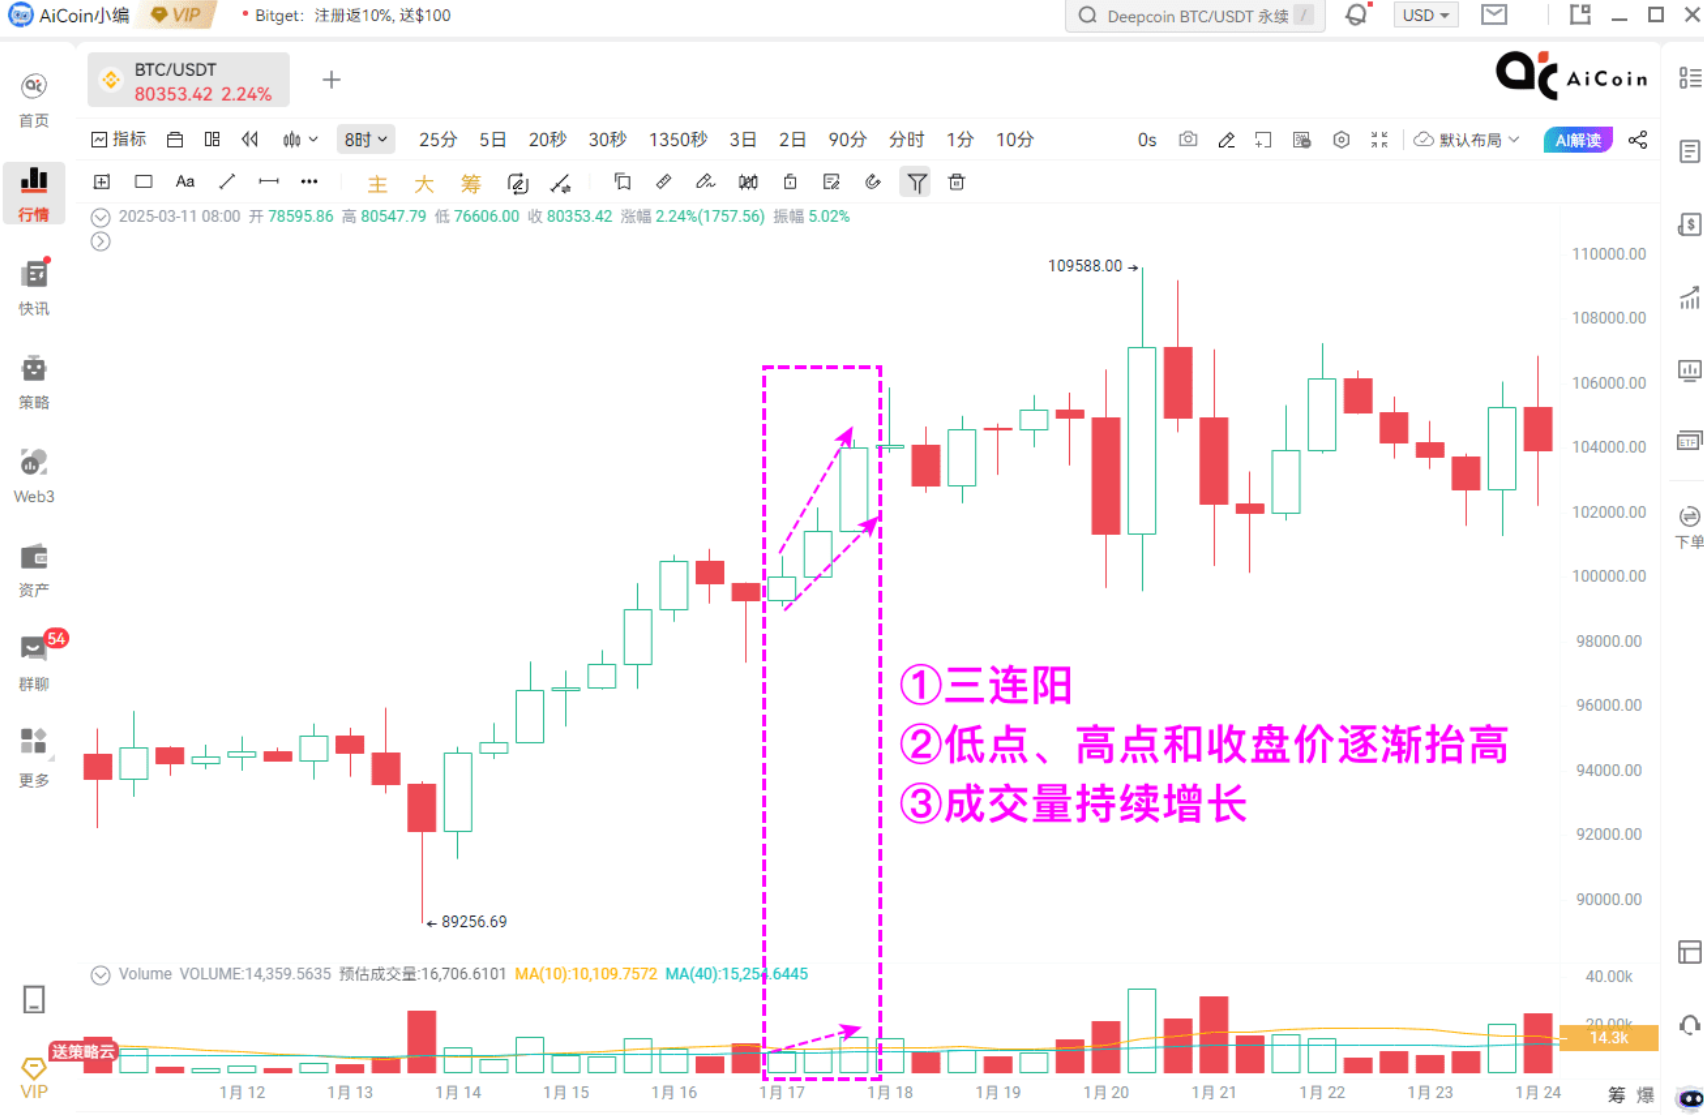
First, let's discuss "Demand Expansion Type Three Consecutive Up Days" — this refers to three consecutive bullish candles where the low, high, and closing prices are all moving upwards, and the trading volume is increasing like climbing stairs. This pattern generally indicates three things: first, the main force may have entered the market, and the trend may accelerate; second, this is a good time to look for buying points; third, be cautious of getting trapped if the price rises too much in the short term.
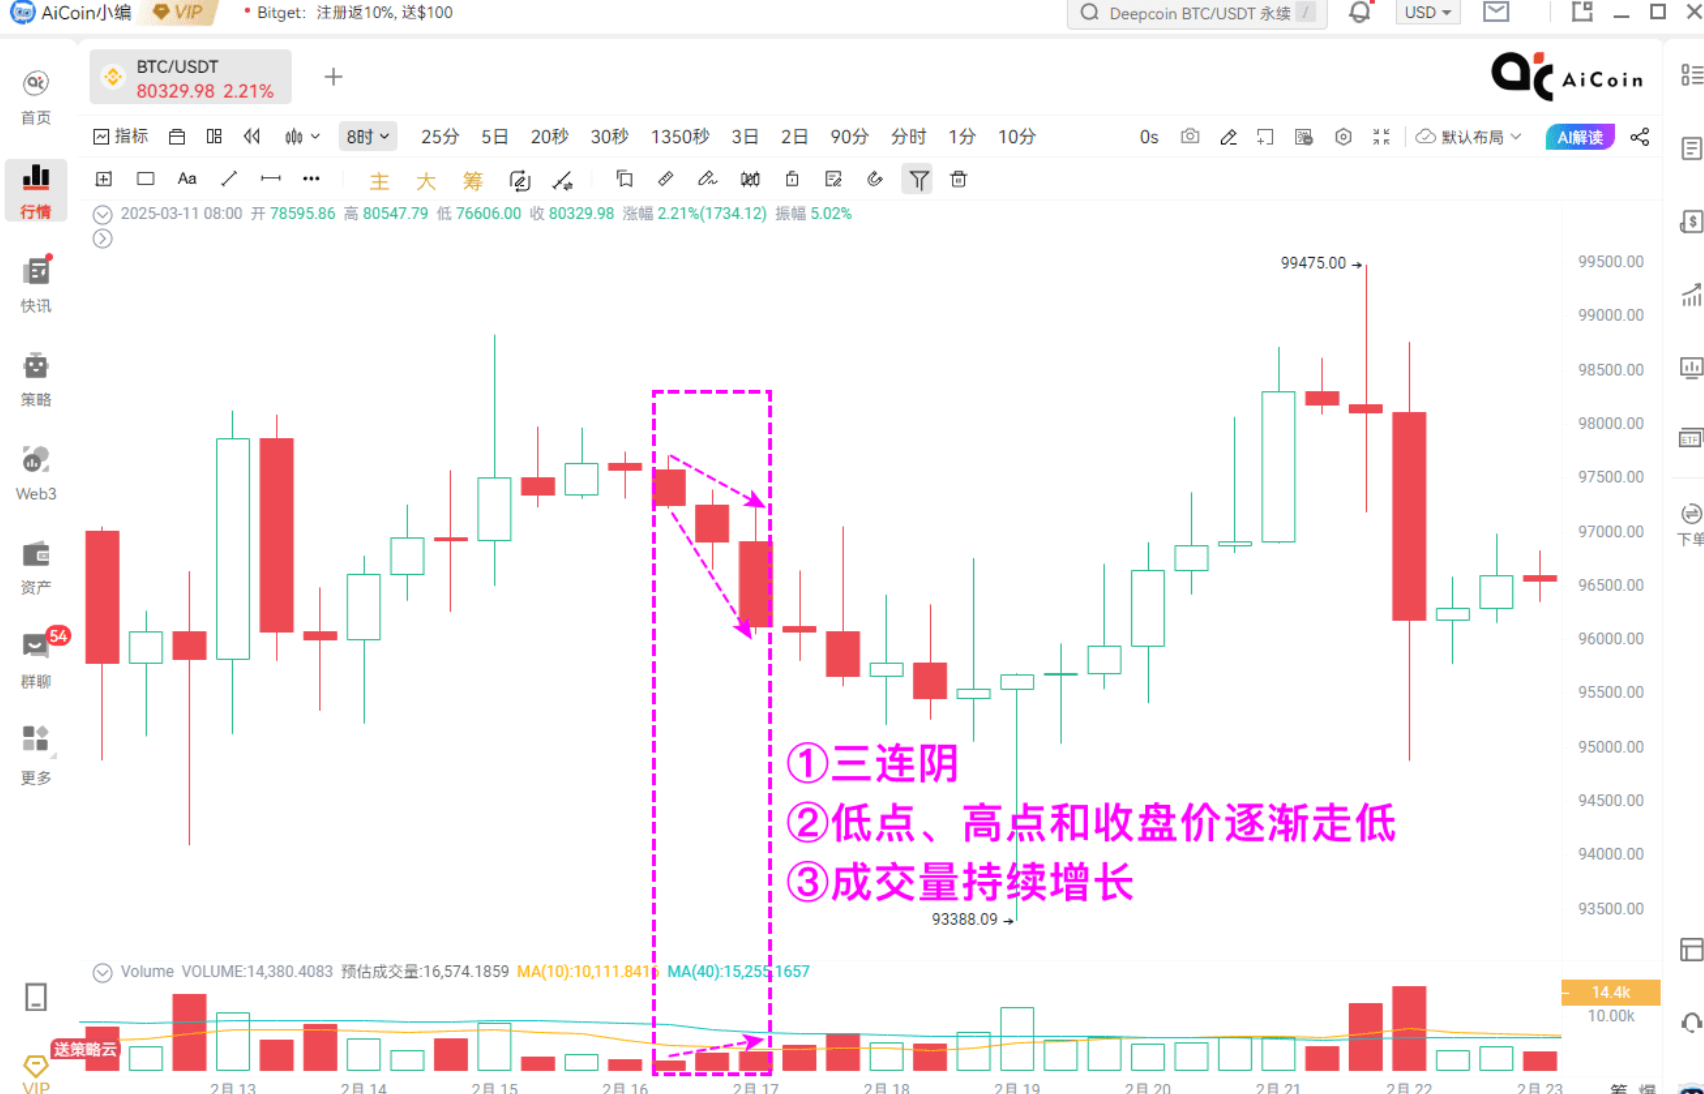
 Now, let's talk about "Supply Out of Control Type Three Consecutive Down Days" — the exact opposite, where three consecutive bearish candles have their high, low, and closing prices all moving downwards, with increasing trading volume. This pattern indicates: first, the main force may be unloading; second, a decline may be starting; third, if it has been falling for a while, don't rush to catch the bottom, as it can be risky!

Remember, in volume-price analysis, the most important aspect of three consecutive down days and three consecutive up days is whether the trading volume keeps up. How the price moves is not important; the key is to look at the trading volume! Without volume, there is no price! Here are three mnemonic phrases for you:
"Don't rush with one bullish candle, three bullish candles with volume signal a rise"
"Don't panic with one big bearish candle, three bearish candles breaking the line means to clear out quickly"
"In a bull market, three bullish candles are a starting point; in a bear market, three bearish candles do not indicate a bottom"
How to use this specifically? For example, if three consecutive up days with increasing volume appear at the bottom, it may indicate that the main force is secretly accumulating; if they appear during an upward trend, it suggests that the price can continue to rise; but if they appear at a high level, it is likely that the main force is pushing the price up to unload. Conversely, if three consecutive down days with increasing volume appear during a decline, it indicates strong bearish momentum, so don't rush to catch the bottom.
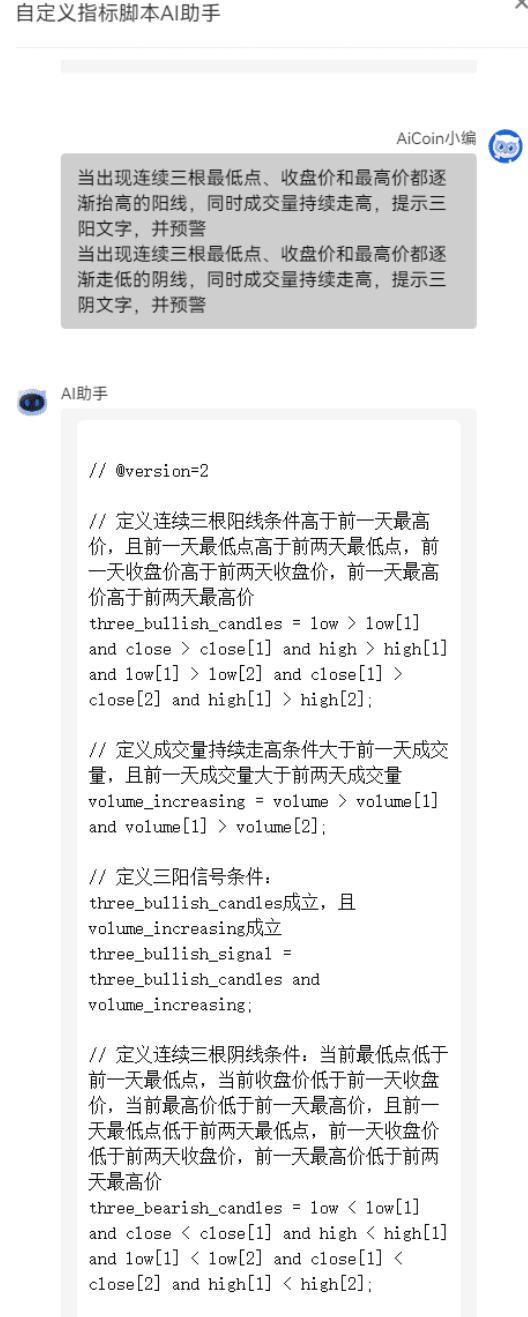
The most convenient part is that we have ready-made custom indicators for these signals on AICoin. They can not only be displayed directly on the chart but also set alerts. As long as you clarify the logic, AI can help you write the indicators and run them on the strategy cloud, which is particularly convenient!

Want to learn more volume-price analysis techniques? Remember to tune in to the AICoin live stream every Monday and Thursday! See you next time!
Finally, I recommend reading the following articles to help you better understand CME gaps and other trading strategies:
For more live content, please follow the AICoin “AiCoin - Leading Data Market and Smart Tools Platform” section, and feel free to download AiCoin - Leading Data Market and Smart Tools Platform.
Risk Warning: The content of this article is for educational purposes only and does not constitute investment advice. Trading should be done with caution, and profits and losses are your own responsibility.
免责声明:本文章仅代表作者个人观点,不代表本平台的立场和观点。本文章仅供信息分享,不构成对任何人的任何投资建议。用户与作者之间的任何争议,与本平台无关。如网页中刊载的文章或图片涉及侵权,请提供相关的权利证明和身份证明发送邮件到support@aicoin.com,本平台相关工作人员将会进行核查。


