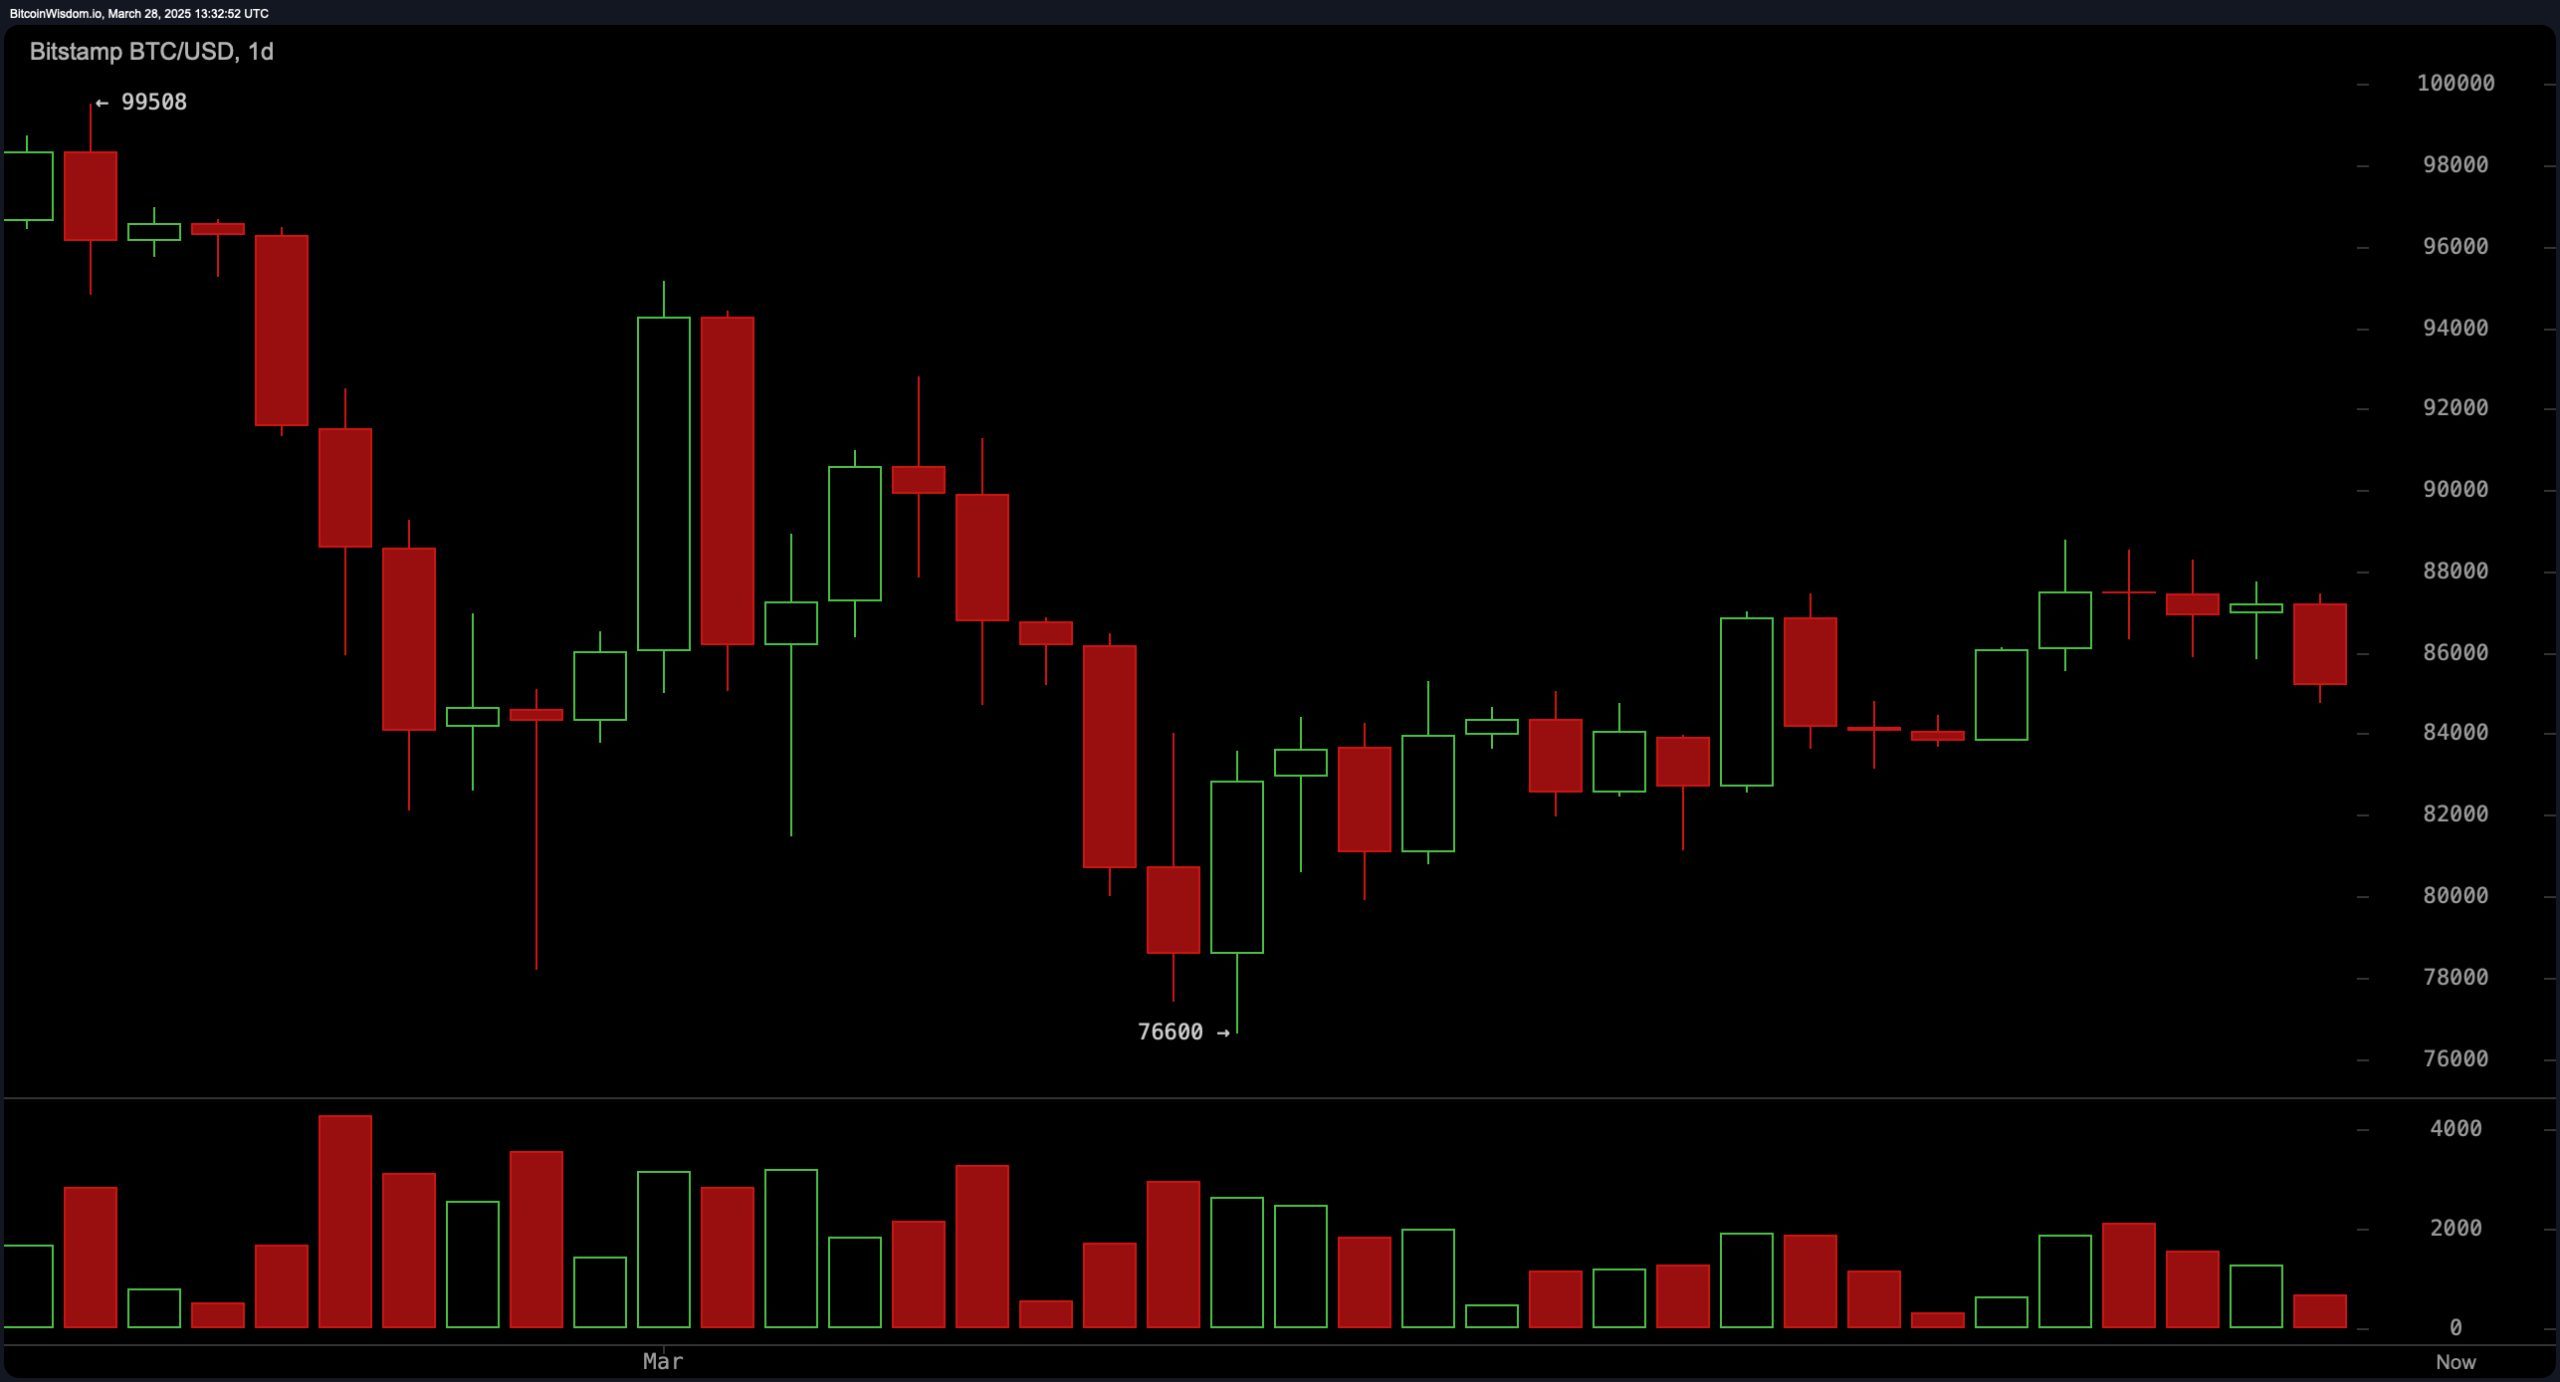
The daily chart shows bitcoin in a consolidation phase, following a significant pullback from its previous high near $99,508. Support is established at $76,600, representing a critical level for buyers. On the upside, resistance is found between $88,000 and $90,000, where recent price attempts failed to break through. The declining volume during this consolidation phase indicates a lack of strong buying interest, further contributing to market uncertainty. A decisive break above $88,000, supported by increasing volume, could shift sentiment toward bullish, while a fall below $76,600 may signal a continuation of the downtrend.

BTC/USD 1D chart via Bitstamp on March 28, 2025.
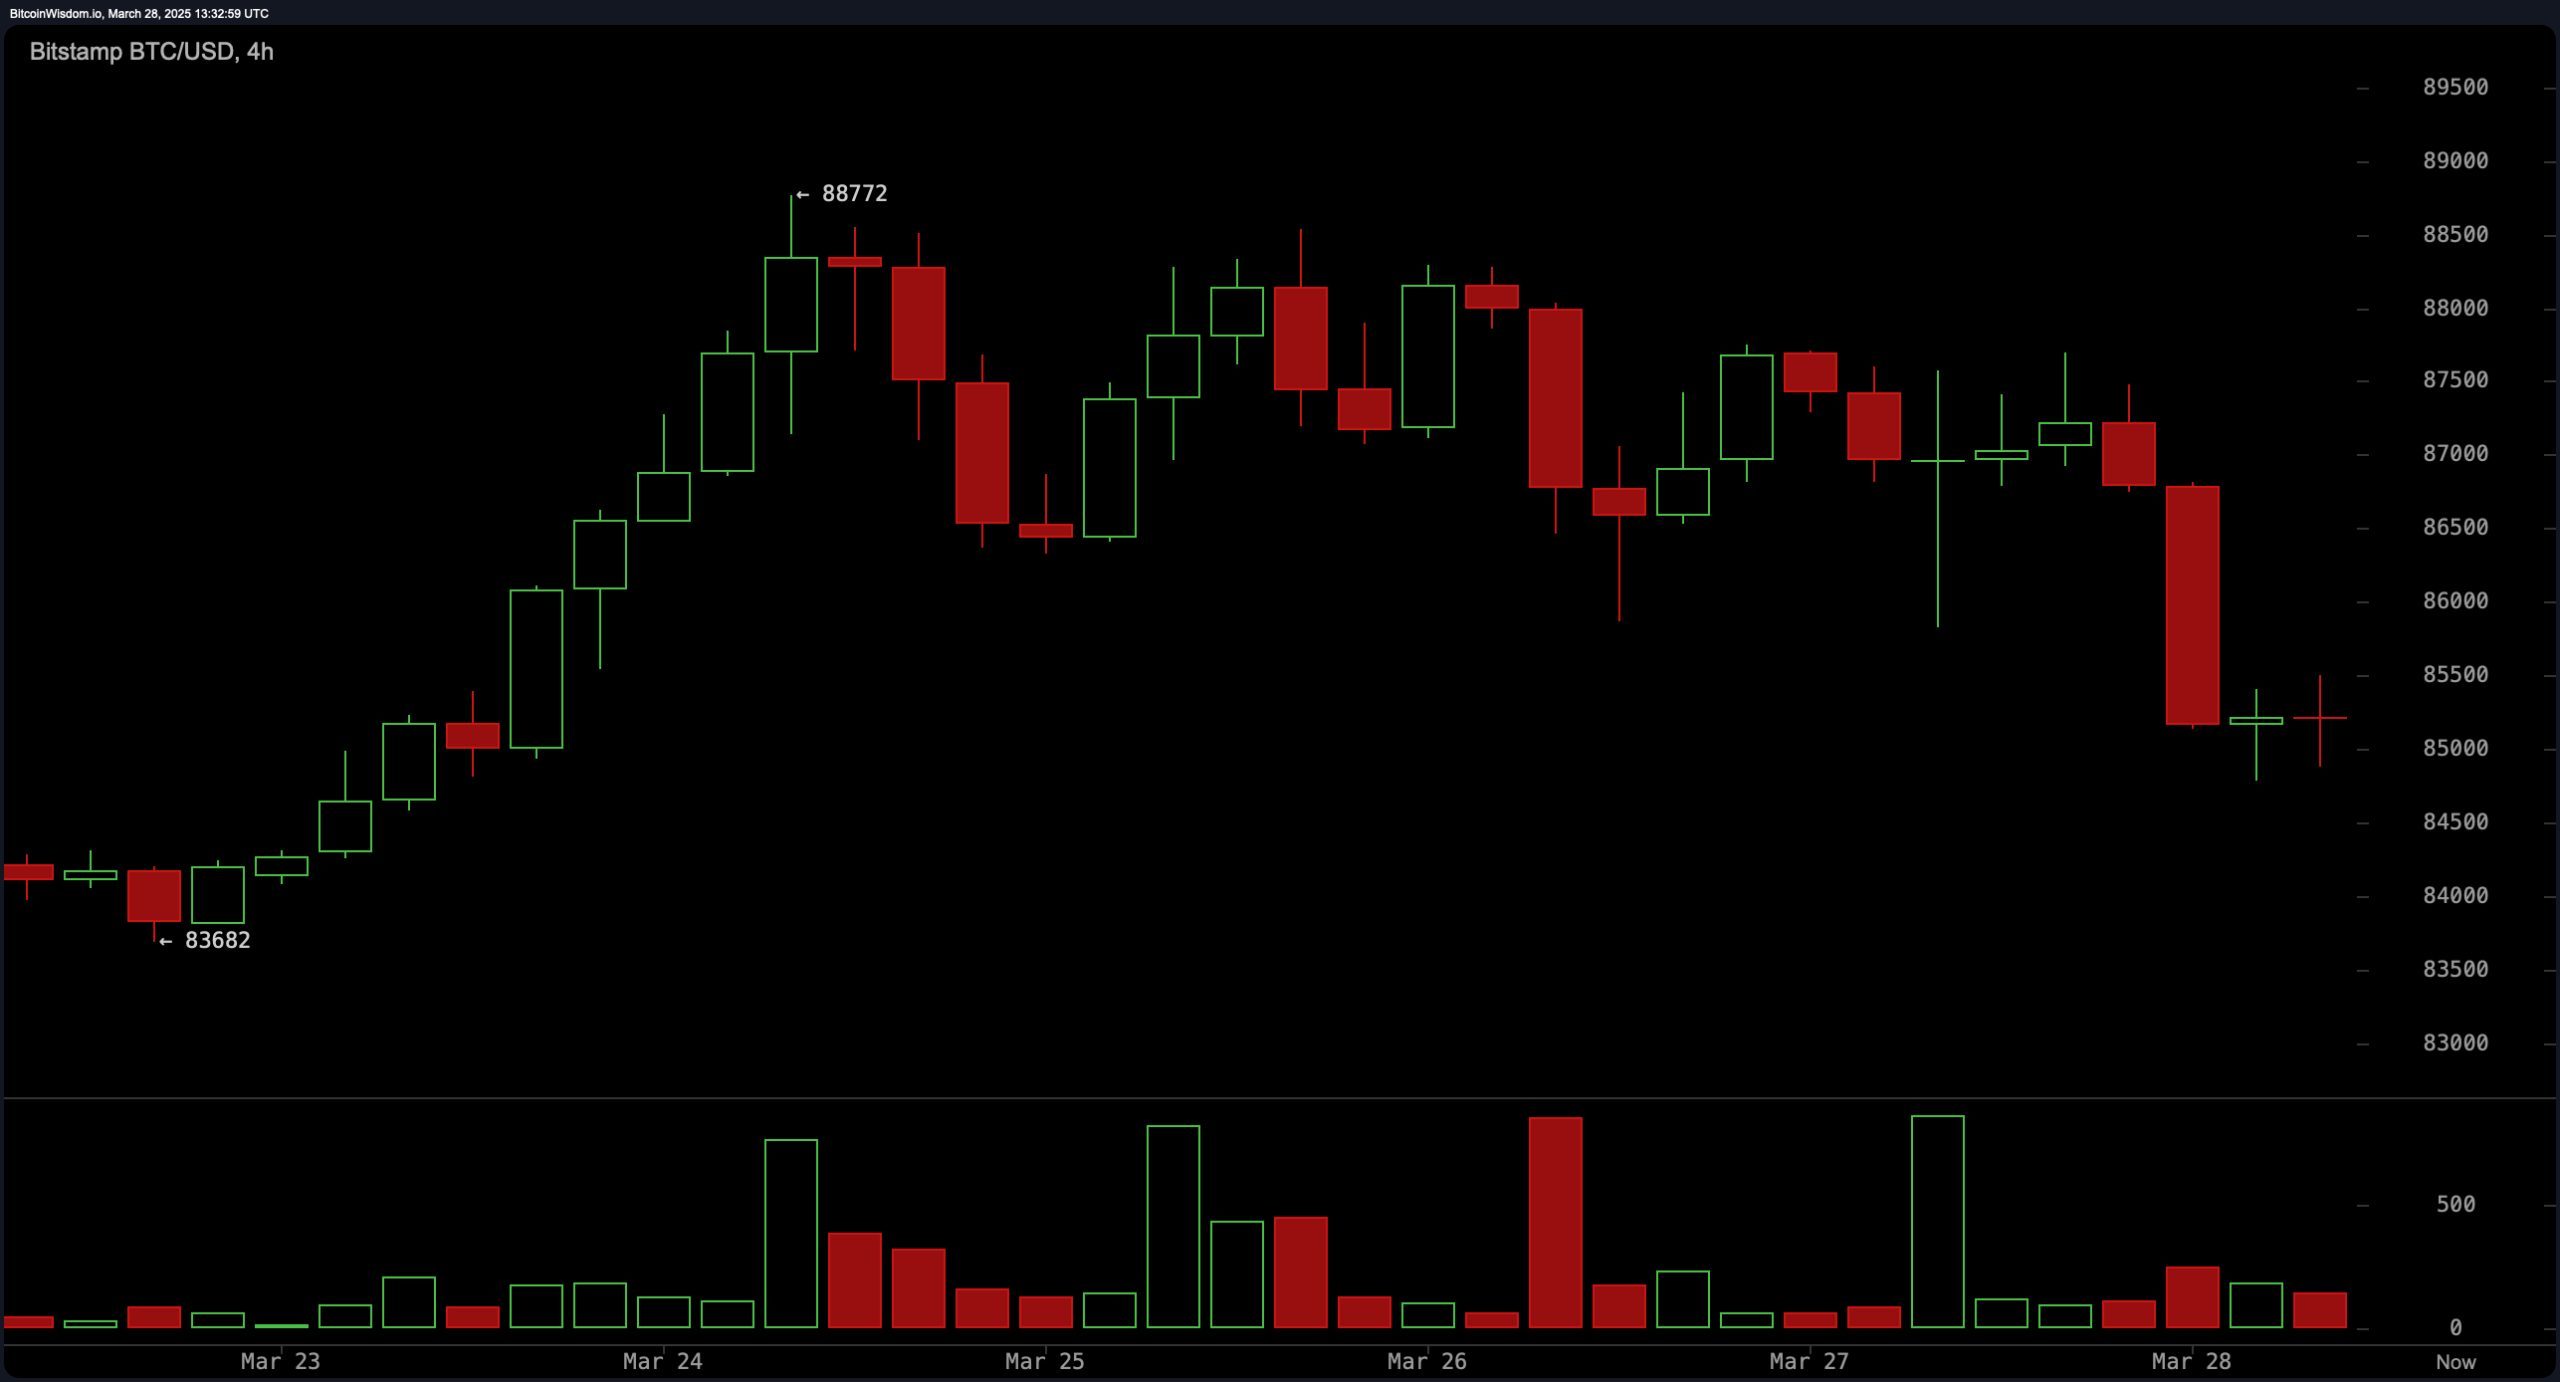
On the 4-hour chart, bitcoin has faced sustained bearish pressure after declining from a recent high of $88,772. The immediate support level stands at $83,682, with resistance near $88,772. Sellers have maintained control, evident from the consecutive lower highs and the absence of meaningful buying activity. The MACD level of -590.2 indicates a potential buying opportunity, but caution is warranted as the momentum indicator remains firmly negative. If the price can reclaim $86,000 and maintain strength, a bullish reversal could materialize. Conversely, further losses may occur if bitcoin breaks below $83,682.

BTC/USD 4H chart via Bitstamp on March 28, 2025.
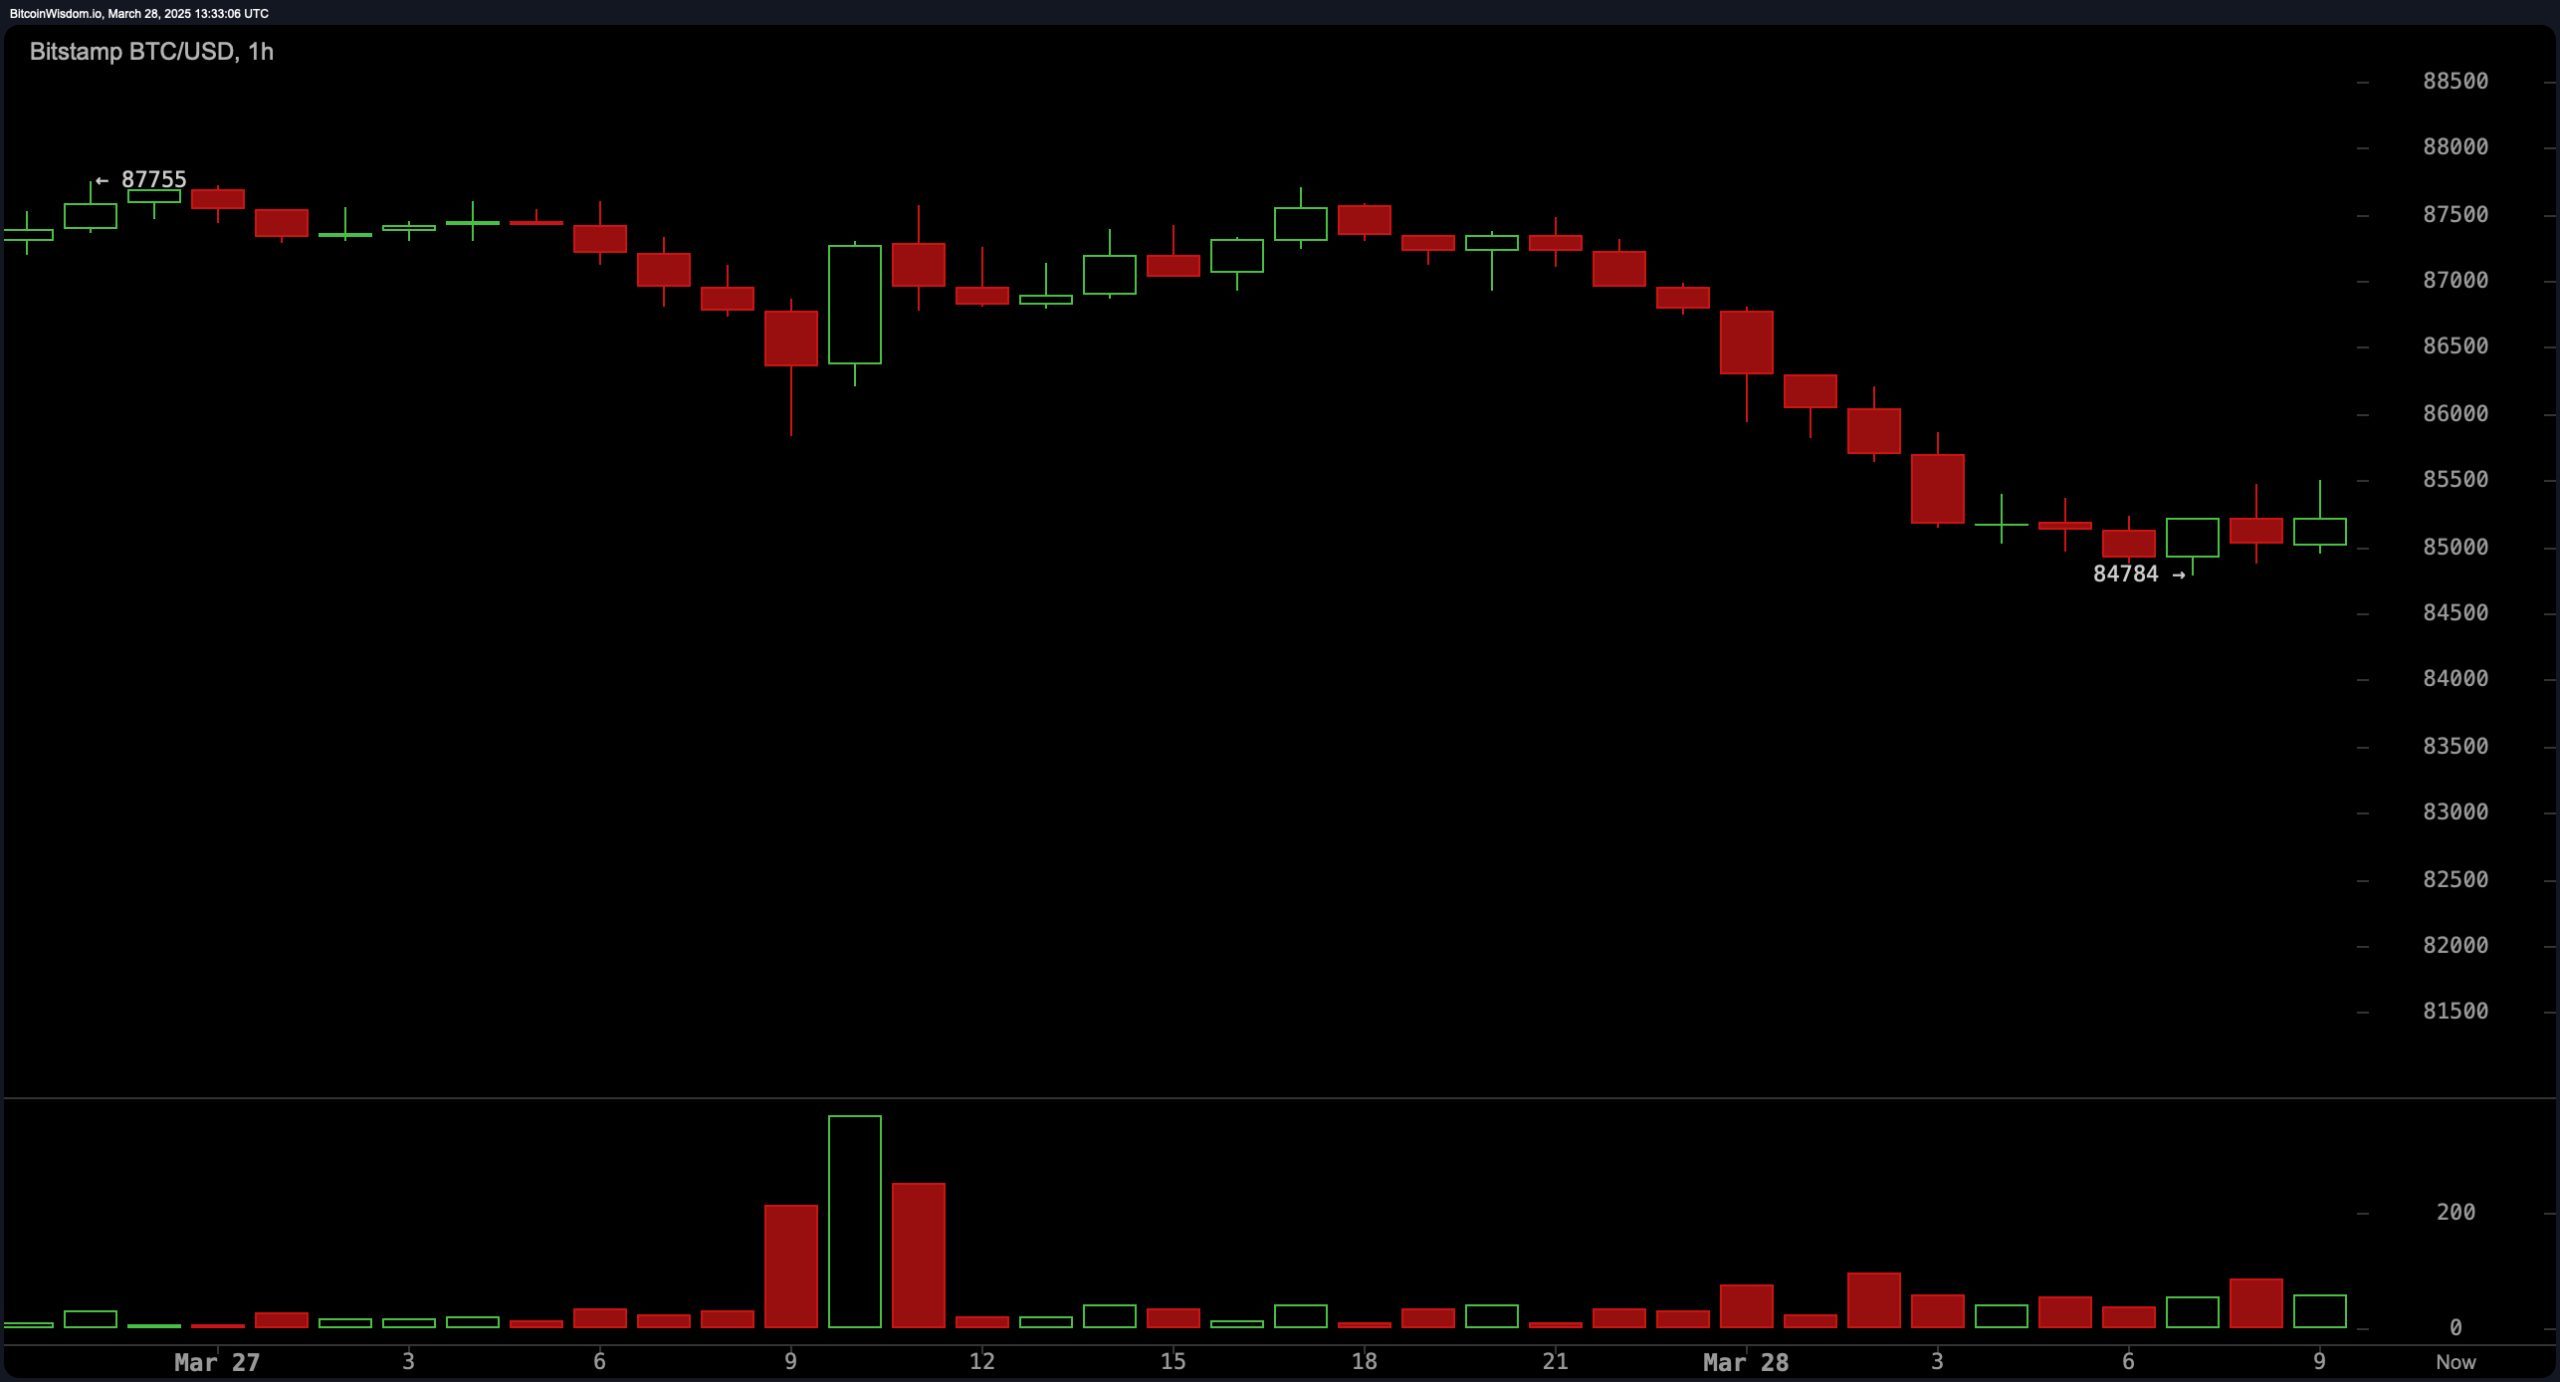
The 1-hour chart reflects a short-term downtrend, with the price struggling to gain momentum. Support is established at $84,784, with minor resistance at $87,755. Recent price action suggests that sellers remain dominant, while any attempts at recovery face significant resistance. Volume remains subdued, limiting the probability of a strong rebound. Short-term traders may consider short positions on breakdowns below $84,000, while a sustained move above $85,500 could trigger a potential reversal. A wait-and-see approach may be prudent as the market establishes clearer directional momentum.

BTC/USD 1H chart via Bitstamp on March 28, 2025.
Oscillators provide a neutral outlook, with the relative strength index (RSI) at 47.3 and the stochastic oscillator at 71.2, both indicating indecision. The commodity channel index (CCI) sits at 65.3, further emphasizing a lack of conviction from buyers or sellers. The average directional index (ADX) at 22.6 suggests weak trend strength. The momentum indicator, currently at 2,558, signals bearishness, while the MACD level of -590.2 provides a counteracting bullish signal. Given these mixed readings, traders may look for additional confirmation before committing to directional positions.
Moving averages strongly favor a bearish stance, with both short-term and long-term indicators providing negative signals. The 10-period EMA and SMA stand at $85,871 and $85,934, respectively, both indicating downward momentum. Similarly, the 20, 30, 50, 100, and 200-period EMAs and SMAs all suggest negative sentiment, with values ranging from $85,556 to $94,036. Only the 20-period SMA, currently at $84,191, suggests positivity, implying a possible support level. Until bitcoin decisively reclaims higher levels, the dominance of sell signals highlights ongoing bearish sentiment.
Fibonacci retracement levels provide additional insights into potential support and resistance. On the daily chart, bitcoin is currently near the 61.8% retracement level at $85,350, a key point often regarded as a significant support zone. A break below this level may lead to a further decline toward the $76,600 level, representing a full retracement of the previous upward move. The 4-hour chart places the 50% retracement level at $86,227, with sellers maintaining control as the price remains below this mark. Similarly, on the 1-hour chart, the 50% retracement is at $86,269, with further support at the 61.8% level of $85,918. A sustained break below these levels could confirm further downside pressure, while a recovery above key retracement points may indicate a reversal.
Overall, bitcoin’s technical outlook remains extremely cautious. While oscillators show mixed signals, the dominance of bearish indicators from moving averages suggests a continuation of the downward trend. A breakout above $88,000 with strong volume could shift sentiment toward bullish, while a failure to maintain support at $84,000 may accelerate further losses. Traders are advised to monitor key levels closely and remain adaptable to changing market conditions.
Bull Verdict:
If bitcoin manages to reclaim and sustain a position above $88,000 with strong buying volume, it could signal a bullish reversal. This would invalidate the prevailing bearish sentiment and potentially set the stage for a move toward the $90,000 resistance zone. A surge in momentum, supported by positive MACD signals and increased demand, would further reinforce the bullish case. Traders may consider long positions if bitcoin demonstrates resilience above key moving averages and Fibonacci levels.
Bear Verdict:
A failure to maintain support at $84,000 could intensify selling pressure, leading bitcoin toward the $83,682 level and potentially lower. With most moving averages and momentum indicators aligned to the downside, a bearish continuation remains likely. A break below the 61.8% Fibonacci retracement on all timeframes would further confirm the downward trend, increasing the probability of a retest of the $76,600 support. Short positions may present favorable opportunities if bearish momentum persists.
免责声明:本文章仅代表作者个人观点,不代表本平台的立场和观点。本文章仅供信息分享,不构成对任何人的任何投资建议。用户与作者之间的任何争议,与本平台无关。如网页中刊载的文章或图片涉及侵权,请提供相关的权利证明和身份证明发送邮件到support@aicoin.com,本平台相关工作人员将会进行核查。


