Yesterday morning, my throat started to feel uncomfortable, and today it's worse than yesterday. I just tried speaking and it came out unclear, like a duck. I can't record a video, so I can only send a short text to briefly discuss the market situation. Additionally, in a couple of days, it will be the Qingming Festival, and I plan to take a break for two days. After Qingming, I will continue working. Wishing everyone a peaceful and healthy Qingming in advance!
Returning to the current market situation, since the three sells have appeared on the 4-hour chart, we will patiently wait for the internal structure of the next segment to consider whether to start intervening. Generally, a 4-hour trend lasts at least 10 days to half a month, so from the high point of 88765 on the 24th to today, April 1st, only a week has passed. Besides the lack of structure in the downward segment, the time cycle is also insufficient. Here’s the chart:
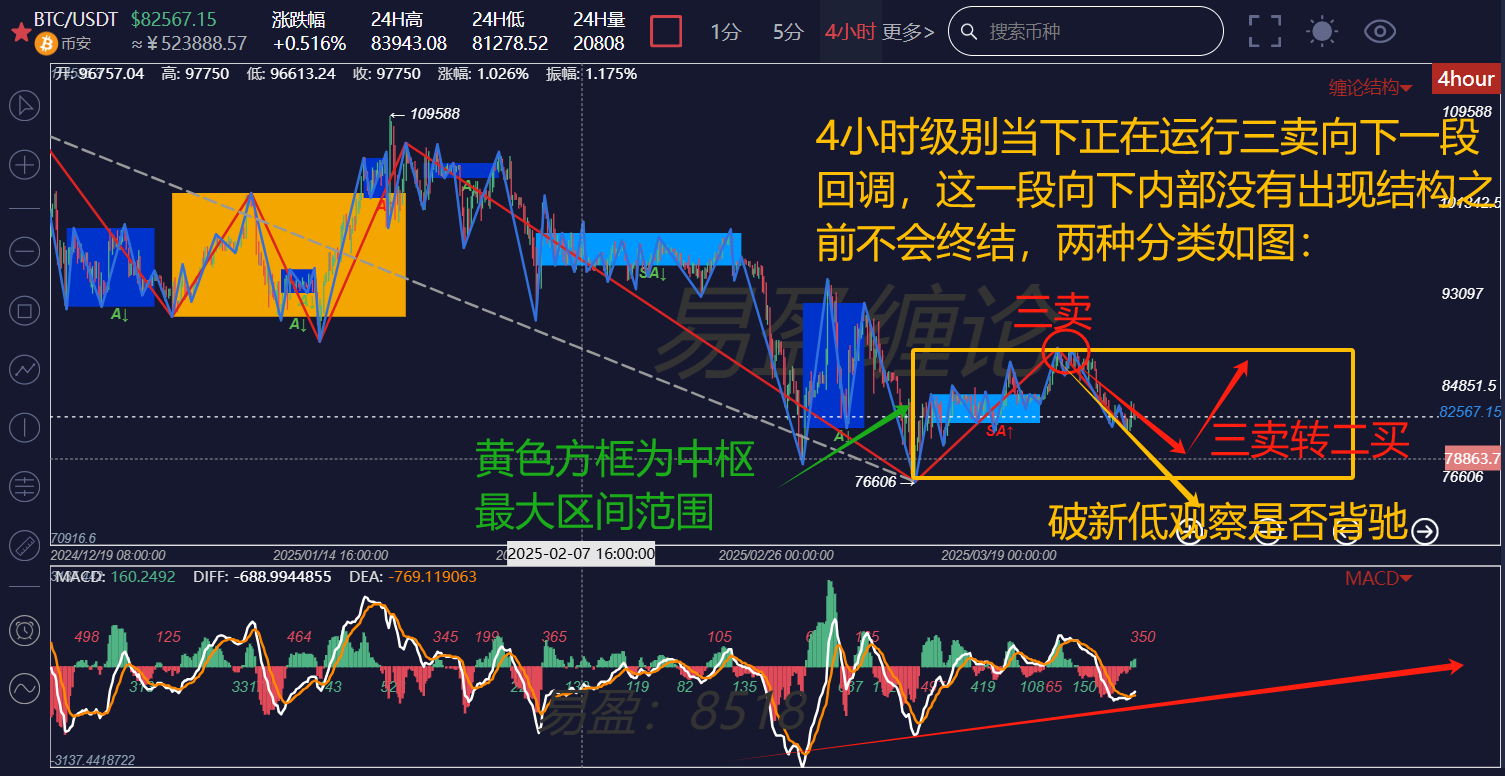
From the perspective of the 4-hour chart, the appearance of the three sells indicates that the downward trend of the major coin has shifted from a central consolidation to a downward trend with two centers, and we are currently constructing the second center. There are no significant trading opportunities until the second center is completed! The major trading opportunity lies in the buying point when the second center is completed and breaks the new low with divergence, which will likely occur from mid-April to early May at the earliest.
Next, we need to pay attention to the conversion relationship of buying and selling points after the three sells: whether it will be a second buy without making a new low or a first buy with divergence after breaking the new low. As for which trend the market will choose, we do not need to predict; we just need to follow the growth evolution of the downward trend on the 30-minute chart.
As for when it is safer to bottom fish, a basic judgment standard is the daily bottom formation. The downward trend will not end without the daily bottom formation appearing. More specifically, without the daily bottom formation, the daily level cannot produce an upward move. In simpler terms, there is no daily level increase, only rebounds at the 4-hour level or lower levels. This involves issues of levels, and I won't elaborate further today due to limited space.
See you next week!
The above analysis is for reference only and does not constitute any investment advice!
If friends are interested in the theory of trading, want to obtain free learning materials, watch public live broadcasts, participate in offline training camps, improve their trading skills, build their trading systems to achieve stable profit goals, and use trading techniques to escape peaks and bottom fish in a timely manner, you can scan the QR code to follow the public account and privately chat to get and add this WeChat account!

免责声明:本文章仅代表作者个人观点,不代表本平台的立场和观点。本文章仅供信息分享,不构成对任何人的任何投资建议。用户与作者之间的任何争议,与本平台无关。如网页中刊载的文章或图片涉及侵权,请提供相关的权利证明和身份证明发送邮件到support@aicoin.com,本平台相关工作人员将会进行核查。