Do not worry about the road ahead without friends; on the investment path, there are like-minded individuals. Good afternoon, everyone! I am the King of Coins from the Coin Victory Group. Thank you all for coming here to watch the articles and videos from the King. Every day, I bring you different news from the crypto world and precise market analysis.
Click the link to watch the video: https://www.bilibili.com/video/BV1E4ZbYcEiQ/
Cryptocurrency Market Trend Analysis Report (April 2025)
Multidimensional Assessment Based on Technical Indicators and Market Behavior
I. Current Market Core Logic: Harvesting Cycle Dominated by Bears
Macroeconomic Environment Suppression
The global financial market lacks significant positive catalysts, and the Federal Reserve's hawkish policies continue to suppress risk appetite. According to on-chain data, institutions are continuously accumulating Bitcoin through ETFs (monthly increase of 12%), while retail holdings have dropped below 40%. Market liquidity is concentrated in the resistance zone above $85,000, indicating a lack of willingness from major funds to take over at high levels.
Verification of Operator Strategies
The current market structure highly aligns with historical harvesting cycles:
Spot Control + Contract Harvesting: Operators trigger stop-loss orders by lowering prices while establishing short positions in the contract market, creating a dual harvesting effect (typical case seen in LIBRA token manipulation);
High-Interest Staking Trap: On-chain data from Ethereum shows that the liquidation volume in the lending market reached a 12-month high in February, locking a large number of retail chips, allowing operators to reduce circulation to strengthen control.

II. In-Depth Technical Analysis: Bearish Outlook from Monthly and Weekly Resonance
1. Bitcoin (BTC) Key Indicators
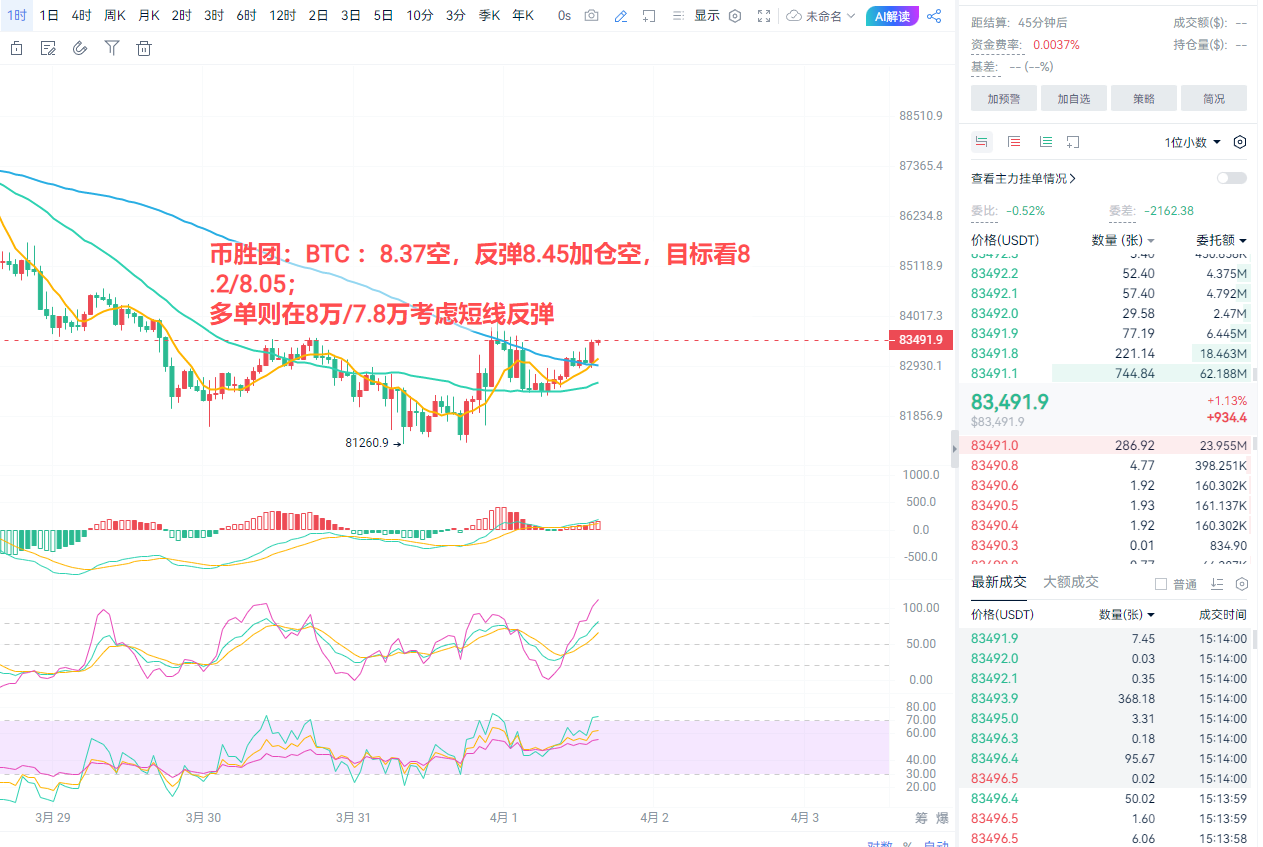
Monthly: Closing with a doji candlestick, MA30 support lost, MACD momentum continues to contract, confirming trend reversal.
Weekly: BOLL lower band broken, MA5/10 moving averages dead cross, RSI falls below 50, accelerating downward risk.
Short-term pressure zone: $83,200 - $83,500 (4-hour MA10 resistance).
Key support levels: $80,000 (psychological level) → $78,000 (previous low area) → $75,000 (December 2024 pullback level).
2. Ethereum (ETH) Key Indicators
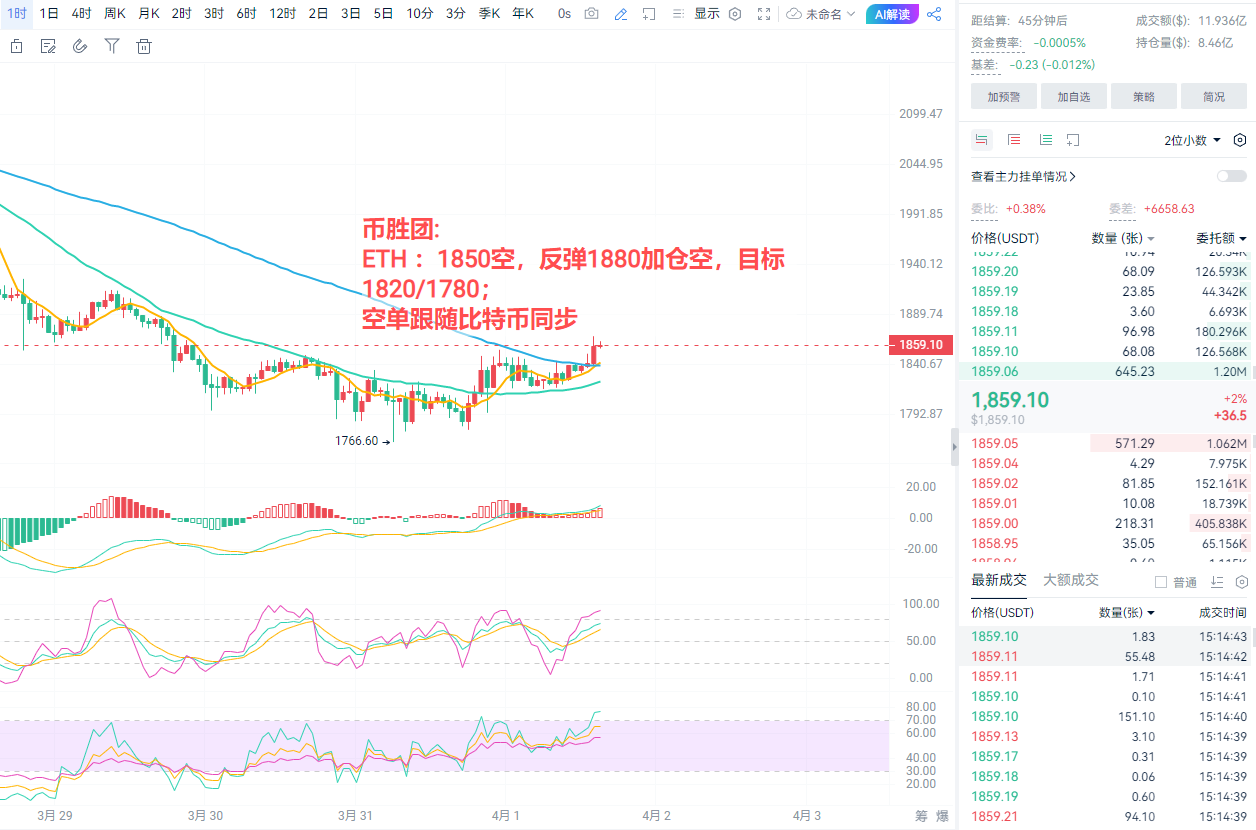
Monthly: Dropped below the bullish starting point of 2023, MACD bearish cross, reinforcing bear market structure.
Weekly: Closed with a bare-bones bearish candle, Stoch RSI dropped to 14.6 in the oversold zone, selling pressure not fully released.
Short-term pressure zone: $1,818 - $1,840 (daily resistance zone).
Key support levels: $1,750 (March low) → $1,650 (technical calculation level) → $1,450 (June 2024 support).
III. Market Behavior Analysis: Retail Holdings and Major Fund Movements
Current Status of Retail Holdings
High Leverage Risk Exposure: Coinglass data shows that retail long positions account for 62% of BTC contract holdings, concentrated in the $86,000 - $88,000 range;
Misalignment of Bottom-Fishing Sentiment: Santiment monitoring shows that the number of addresses holding <1 BTC decreased by 1.8%, while addresses holding >1,000 BTC increased by 2.3%, indicating that retail investors are still "holding on" while major funds continue to accumulate.
Deduction of Major Fund Harvesting Path
Phase One (April): Inducing retail investors through false rebounds (BTC target $85,000 - $88,000, ETH target $1,920 - $1,950) to attract them to add positions;
Phase Two (Before Mid-May): Triggering a series of liquidations using liquidity gaps, targeting to break through key supports of BTC $75,000 and ETH $1,600;
Ultimate Target: BTC $60,000 - $65,000 (corresponding to miner shutdown price), ETH $1,200 (2023 bear market low).

IV. Focus of Long-Short Game and Operational Strategies
1. Short-Term Rebound Conditions
Bitcoin: Needs to close above $85,000 on the daily chart with trading volume exceeding $18 billion;
Ethereum: Breakthrough resistance at $1,850 and ETF net inflow > $50 million in a single day.
2. Shorting Window and Risk Control
BTC $85,000 - $88,000, stop-loss at $89,000, target $75,000 → $65,000.
ETH $1,920 - $1,950, stop-loss at $1,980, target $1,600 → $1,200.
3. Extreme Risk Warning
Black Swan Event: If BTC falls below $78,000 or ETH loses $1,750, it may trigger $2 billion level liquidations in the futures market;
Policy Changes: A shift in the SEC's regulatory stance on ETH staking could become a short-term catalyst.
V. Historical Cycle Comparison and Mid-Long Term Outlook
Similarity to the 2017 Cycle
The current BTC weekly "shooting star" candlestick pattern highly aligns with the December 2017 top structure. If historical trends replicate, the depth of the pullback could reach 30%-40%.
Bull-Bear Transition Threshold
Bitcoin: The MA200 moving average ($72,000) serves as a long-term bull-bear dividing line; falling below confirms a bear market;
Ethereum: Needs to return above $2,000 to reverse the monthly bearish trend.
Conclusion: The current market is in a technically bearish phase dominated by bears, with major funds accelerating chip cleaning by creating rebound traps. It is recommended that investors focus on short positions during rebounds, strictly adhere to stop-loss discipline, and pay attention to the key support levels of $80,000/$1,750 for long-short contention. In the mid-long term, we need to wait for the miner surrender index (MPI) and MVRV ratio to signal a bottom, with the market bottom expected to gradually form in Q3 2025.
(This report's data is as of April 1, 2025)

This article is independently written by the Coin Victory Group. Friends in need of current price strategies and solutions can find the Coin Victory Group online. Recently, the market has been mainly characterized by fluctuations, accompanied by intermittent spikes. Therefore, when making trades, please remember to control your take-profit and stop-loss. In the future, when facing significant market data, the Coin Victory Group will also organize live broadcasts across the internet. Friends who wish to watch can find the Coin Victory Group online and contact me for the link. The focus is mainly on spot and contract trading for BTC/ETH/ETC/LTC/EOS/BSV/ATOM/XRP/BCH/LINK/TRX/DOT. Our expertise includes mobile locking strategies around high and low support and resistance for short-term fluctuations, mid-long term trend trades, daily extreme pullbacks, weekly K-top predictions, and monthly head predictions.
免责声明:本文章仅代表作者个人观点,不代表本平台的立场和观点。本文章仅供信息分享,不构成对任何人的任何投资建议。用户与作者之间的任何争议,与本平台无关。如网页中刊载的文章或图片涉及侵权,请提供相关的权利证明和身份证明发送邮件到support@aicoin.com,本平台相关工作人员将会进行核查。


