Stellar (XLM) has completed a death cross on its daily charts, its first major bearish signal of the year. The bearish technical formation comes on the heels of a significant drop in XLM’s price, fueling speculation of deeper downside risk.
The death cross, which occurs when the 50-day moving average crosses below the 200-day moving average, is one of the most closely observed technical indications on the market. Traditionally seen as a negative indication, its appearance often signals the beginning of a potential downward trend. The 50-day SMA has crossed below the 200-day SMA on Stellar's chart, indicating a death cross.
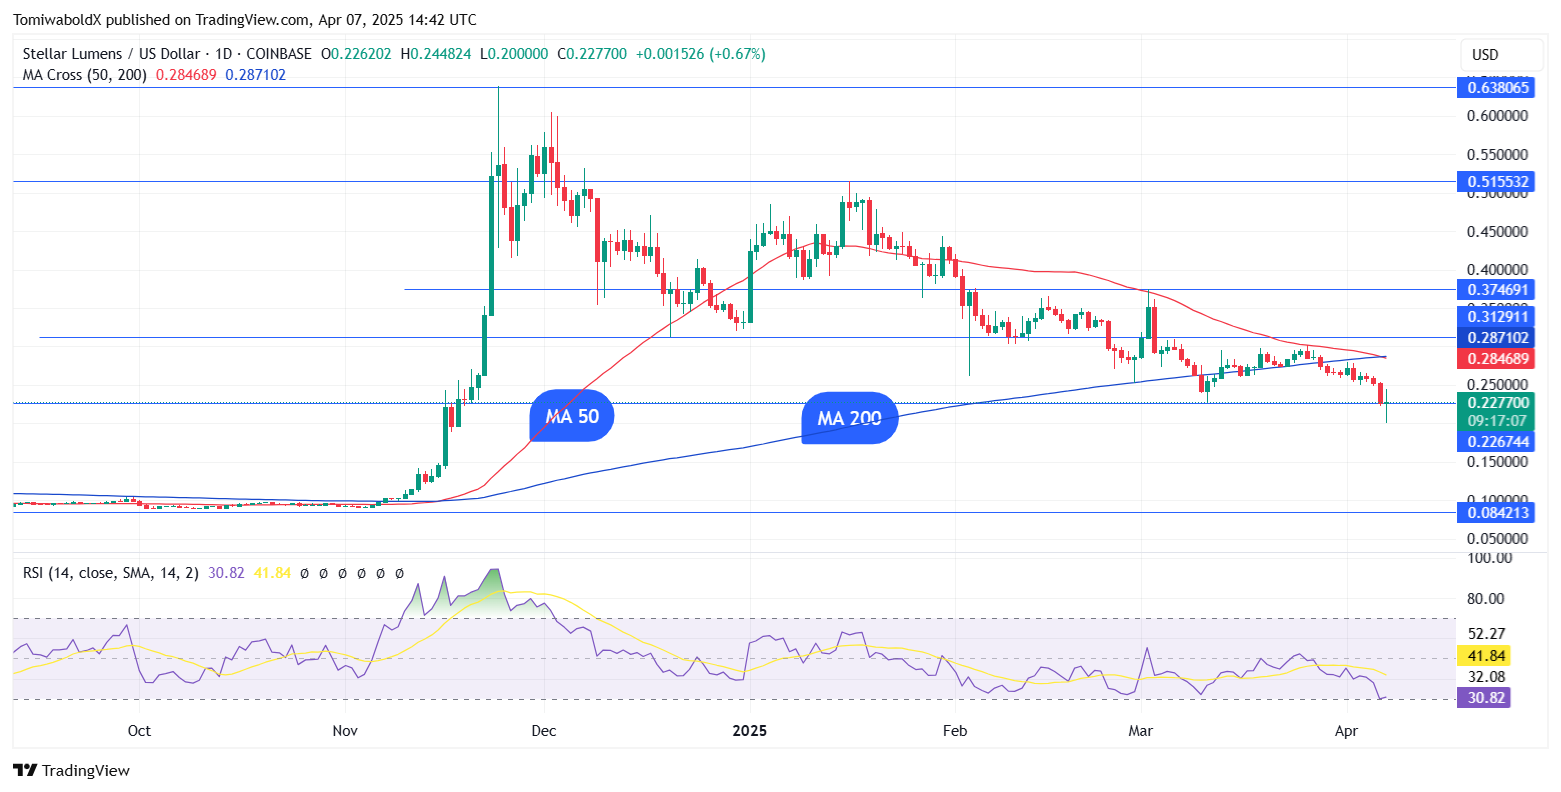
XLM/USD Daily Chart, Courtesy: TradingView
For Stellar, this is the first time such a crossover has occurred since mid-2024, raising concerns that the recent decline might be more than just a short-term pullback.
HOT Stories Breaking: XRP Collapses 8% in Minutes Because of This One Word 200,000,000 XRP Stun World's Largest Exchange Bitcoin (BTC) Confirms First Major "Death Cross" of 2025: What's Next? ETH/BTC Collapses Below 0.02
Related

Sun, 04/06/2025 - 15:24 Stellar (XLM) Potential Macro Trend Shift Detected: What to Expect
Tomiwabold Olajide
At press time, XLM was down 6.33% in the last 24 hours to $0.23 and down 16% weekly amid an extended market sell-off.
The market dip worsened in Monday's session, with major crypto assets, including Bitcoin, Ethereum, XRP, Solana and Stellar all experiencing significant declines. Weak market sentiment, rising liquidations and uncertainty around macroeconomic conditions have all contributed to the downturn.
What comes next?
While death crosses may indicate a probable downward trend, they do not guarantee protracted bear markets. However, they do serve as warning signs, especially when accompanied by price weakness and declining momentum.
Related

Sat, 03/29/2025 - 14:15 Stellar (XLM) Reverses Gains, What's Happening?
Godfrey Benjamin
XLM rebounded from lows of $0.20 in today's session, reaching $0.239 at press time. The RSI has sharply rebounded from oversold areas, highlighting the possibility of a relief rally in the short term. If the rebound is sustained, XLM would aim for a breach of its daily moving averages of 50 and 200 at $0.284 and $0.287, respectively. If successful, XLM would target $0.375 and $0.443 next.
On the other hand, if XLM's price turns down from its moving averages, it might retest support at $0.20. Meanwhile, major declines might aim for support at $0.10.
免责声明:本文章仅代表作者个人观点,不代表本平台的立场和观点。本文章仅供信息分享,不构成对任何人的任何投资建议。用户与作者之间的任何争议,与本平台无关。如网页中刊载的文章或图片涉及侵权,请提供相关的权利证明和身份证明发送邮件到support@aicoin.com,本平台相关工作人员将会进行核查。


