The tariff war could cause the U.S. PCE inflation rate to soar by 2%, leading to interest rate cuts or hikes? 25.8% of BTC is in a loss state, marking the largest correction of this bull market.
Macroeconomic Interpretation: As Trump wields the negotiation stick of "350 billion dollars in energy procurement" against the EU, a dramatic scene unfolds in the global capital markets. This president, well-versed in the art of "maximum pressure," has successfully put nearly 2 trillion dollars of global corporate investment commitments in the U.S. on the line after announcing tariffs on China, India, and the EU. The anxiety of multinational giants like Apple and Hyundai intertwines with the bear market alarms echoing from Wall Street, creating the most surreal economic landscape of 2025.
In this trade melee, the U.S. Chamber of Commerce is brewing an epic legal counterattack. This business empire, representing millions of enterprises, is attempting to pierce through tariff barriers with the sword of litigation. Dramatically, institutional estimates indicate that the new tariffs could cause the U.S. core PCE inflation rate to soar by 2%, forcing the Federal Reserve to raise its interest rate cut expectations for 2025-2026 from 4 times to 6.6 times. This "tariff-inflation-rate cut" death spiral is akin to feeding the capital markets honey laced with poison—short-term pain coupled with long-term easing expectations has brought Bitcoin, the "paradox" of the digital age, into the spotlight.
Interestingly, Bitcoin's performance in the face of this crisis resembles a well-trained golden bell. Bernstein analysis points out that compared to the 50% plummets during the COVID-19 pandemic, this round's 26% drop can be considered an "elegant correction." The underlying mystery is that as traditional markets are rattled by the tariff war, institutional investors are quietly incorporating Bitcoin into their risk-averse portfolios. Dalio's warning from Bridgewater provides a footnote to this shift: we are experiencing a once-in-a-century collapse of monetary and geopolitical order, and Bitcoin resembles Noah's Ark, revealing its unique value amid the flood of fiat currencies.
The fluctuations in the RMB exchange rate add an Eastern flavor to this grand drama. Matrixport analysis indicates that the trend of the dollar approaching a critical resistance level against the RMB is strikingly similar to the script of Bitcoin's initial suppression followed by a surge after the RMB devaluation in 2015. The current Bitcoin market is like a compressed spring—supply chain restructuring triggered by U.S. tariffs is weakening dollar hegemony, while subtle fluctuations in the RMB internationalization process are accumulating energy for the revaluation of crypto assets.
Historical experience tells us that when the storm of macroeconomics arrives, gold always shines. However, the script for 2025 introduces a new character: Bitcoin is stepping onto the stage as "digital gold 2.0." Goldman Sachs' prediction of an "event-driven bear market" resonates perfectly with BlackRock's downgrade of U.S. stock ratings—traditional capital is voting with its feet, seeking financial tools to break through geopolitical dilemmas. Coinank data shows that currently, 25.8% of Bitcoin's circulating supply is in a loss state, which may seem like a bearish indicator, but in the eyes of institutions, it becomes a rare value pit.
In this global capital migration, Bitcoin demonstrates surprising resilience. Its price fluctuations are no longer merely speculative indicators but have evolved into a new thermometer for measuring risk appetite. As Trump's tariff stick shatters traditional investment logic, and as the Federal Reserve's monetary policy walks a tightrope between inflation and recession, the crypto market is writing its own survival rules: neither completely detached from the traditional financial system nor fully integrated, but constructing an independent value judgment standard within the consensus mechanism.
The current turmoil is merely a prelude to greater changes. Dalio reminds us to pay attention to the struggle of the "five major forces," and Bitcoin is a representative work of technological power challenging the traditional monetary order. As the tariff war evolves into a prolonged war of attrition, and as the 10-year U.S. Treasury yield and the RMB exchange rate dance the tango, crypto assets may be completing a thrilling leap from the margins to the mainstream—this is not a simple capital game, but a gentle revolution initiated by digital civilization against industrial civilization.
Investors in this storm need to understand: within Bitcoin's candlestick chart, both the sharp edges of geopolitical conflicts and the vast sea of technological revolutions are reflected. As Wall Street's bear market alarms intertwine with the tariff counterattacks from China and Brussels, the breakout battle for digital gold has just begun. Perhaps, like the rise of gold during the Cold War, the new era's safe-haven legend is quietly being rewritten on the distributed ledger of blockchain.
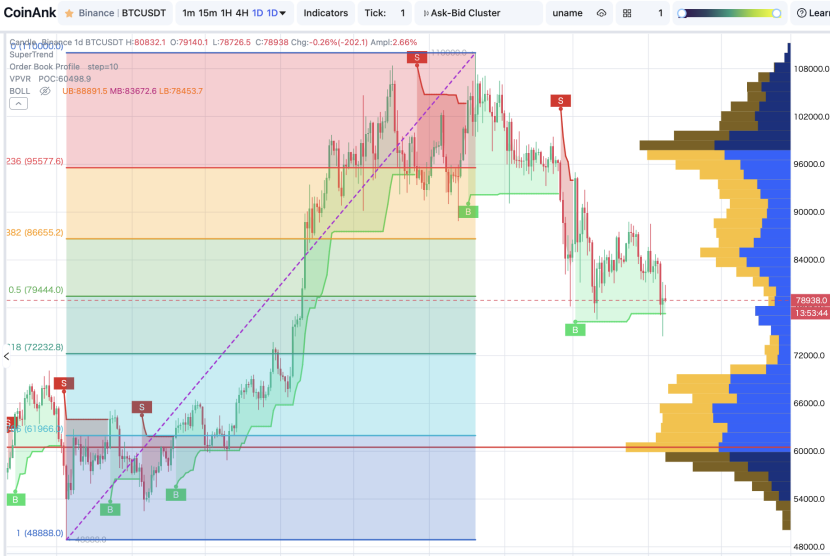
According to CoinAnk AI's intelligent analysis, the BTC daily market analysis report is as follows:
Main support level: 72871.33 USDT
Main resistance level: 86914.33 USDT
Current trend: Slightly bearish
Detailed Explanation:
Technical Indicators Summary:
Moving Average System: MA5=80799.48, MA10=81965.52, MA20=83681.09, MA120=93509.67. The current price is between MA5 and MA10, and both MA5 and MA10 are below MA20, indicating a bearish arrangement of short-term moving averages, with medium to long-term moving averages also showing a downward trend.
MACD: DIF=-1700.31, DEA=-1295.83, Histogram=-404.48. The MACD is in a death cross state, and the histogram is expanding in the negative region, indicating bearish market momentum.
BOLL: Upper band=88869.57, Middle band=83681.09, Lower band=78492.62. The current price is between the middle and lower bands, and %B=0.06%, indicating that the price is in a weak area.
RSI: RSI6=30.25, RSI12=37.20, RSI14=38.34, RSI24=41.07. The RSI indicators are overall in a neutral to weak area, with no signs of overselling, but also no clear signs of overbuying.
KDJ: K=29.45, D=29.29, J=29.76. The KDJ indicator is at a low level but has not formed a golden cross, indicating that the market may continue to oscillate in the short term.
Indicator Data:
Funding Rate: 0.00467200%. The funding rate is in a neutral area, with no significant bullish or bearish sentiment.
Volume Changes: Recent trading volume has increased, but prices have not risen significantly, indicating that the market may face selling pressure.
Capital Flow Data: Contract capital net inflow and outflow data show that there has been significant capital outflow recently, especially in the 4H and 6H time frames, indicating that the market may continue to face pressure in the short term.
Analysis Result
Direction: Cautiously bearish
Entry Timing: The current price is close to the resistance level; if the price cannot break through this resistance level, consider entering a short position.
Stop Loss Setting: Approximately 3.5%.
Target Price: Expected return rate of approximately 15%.
Note: This analysis is for reference only and does not constitute any investment advice!
免责声明:本文章仅代表作者个人观点,不代表本平台的立场和观点。本文章仅供信息分享,不构成对任何人的任何投资建议。用户与作者之间的任何争议,与本平台无关。如网页中刊载的文章或图片涉及侵权,请提供相关的权利证明和身份证明发送邮件到support@aicoin.com,本平台相关工作人员将会进行核查。


