Trump Delays Tariffs for 90 Days, Global Markets Rebound, BTC Faces CPI Data Test Tonight
Macroeconomic Interpretation: When U.S. President Trump announced a "90-day pause" on tariff policies, the global capital markets seemed to receive a shot of adrenaline. The Dow Jones surged by an epic 7.87% in a single day, and the Nasdaq recorded its second-largest single-day jump in history. This "tariff reprieve" that began in Washington not only revitalized traditional financial markets but also led to a remarkable comeback in the crypto world—Bitcoin jumped from a recent low of $74,500 to a peak of $83,588, with a perfect 24-hour increase of over 8.7%, perfectly illustrating the saying "one day in the crypto world is like a year in the real world."
Tonight, the U.S. Department of Labor is set to release the March CPI data, and astute investors have already sensed a turning point. The soaring prices of auto insurance may become the biggest "drama queen" in the CPI data, while tariff factors take a back seat. This expectation management can be considered an art, providing a preventive measure for the market while leaving room for imagination regarding the Federal Reserve's monetary policy adjustments. As expected, under the anticipation of easing inflationary pressures, gold's 3.27% daily increase resonated with Bitcoin's strong rebound, creating a remarkable alliance between traditional safe-haven assets and BTC at a specific moment.
However, the market's festive party is never without sober observers. The sharply declining VIX index coexists with a 5% rebound in crude oil, while the dollar index's hesitation dances strongly with gold. In this complex situation, is the crypto market's surge a rebirth or merely a flash in the pan? The answer may lie in tonight's CPI data—if inflation falls more than expected, the Fed's rate-cutting path may truly open, potentially giving rise to a new legend in the crypto market; conversely, the honeymoon period created by the 90-day tariff reprieve may just be the calm before the storm.
The undercurrents in the options market are even more intriguing. Data shows that $2.32 billion worth of Bitcoin options will expire on April 11, with the $82,000 pain point price acting like a magnet pulling the market. Although a large sell-off of call options for May and June has exposed short-term cautious sentiment, the continued buying of $100,000 call options for December reveals the "ambition" of institutional investors. This "short-term view on adjustments, long-term bet on breakthroughs" split mentality resembles the strategic betting and calling of a poker master before the flop.
Wall Street's hedge fund moguls, who once fiercely criticized tariff policies, are now praising Trump's decision, stating that the process of making sausage doesn't matter as long as the result is tasty. This pragmatic philosophy is also prevalent in the crypto market—when the EU announced it was considering a simultaneous 90-day pause on countermeasures, investors immediately voted with real money. Bitcoin reclaimed $83,000 in a single day, and Ethereum surged by 14.6%, all telling a truth: in the eyes of capital, the uncertainty of policy is like a roller coaster's safety bar; as long as it doesn't derail, the bumps themselves can become enjoyable.
On-chain data provides an alternative footnote to this celebration. Coinank data shows that even amid this week's market volatility, over 85% of Bitcoin holders remain calm. This peculiar phenomenon of "everyone panicking while I profit" may stem from the unique survival wisdom of crypto natives—just like Cardano's founder boldly predicting a "$250,000 Bitcoin vision," this seemingly crazy prophecy actually aligns with fundamental changes such as institutional entry and the approval of spot ETFs. As tech giants like Microsoft and Apple draw closer to the crypto world, Bitcoin's valuation system is undergoing a genetic mutation from "virtual asset" to "tech asset."
Looking back from the historical watershed, this V-shaped reversal in the crypto market resembles a concrete manifestation of blockchain technology: the blocks of policy games and economic data are being verified one by one, with each node's volatility writing new hash values for the decentralized financial future. When traditional capital meets the native forces of crypto in this global liquidity reconstruction, Bitcoin's price trend has long surpassed a simple digital game, evolving into a century-long experiment on monetary sovereignty and value storage.
CPI Data Analysis:
The U.S. will release key inflation indicators tonight at 20:30 (UTC+8), with the March unadjusted CPI year-on-year expected to fall from 2.8% to 2.6%, and core CPI possibly dropping to 3.0%, marking a near four-year low. The uniqueness of this data lies in its status as the last inflation report unaffected by tariffs before the implementation of Trump's new policies, with the market paying close attention to structural price change trends. According to investment banks, the rising costs of auto insurance are the main driving factor, while the tariff transmission effect has yet to manifest this month.
We believe that the current data may strengthen market expectations for a shift in Fed policy—if core inflation continues to cool, it may prompt the Fed to initiate a rate-cutting cycle earlier, thereby putting pressure on the dollar index while boosting the valuation of risk assets. The deeper significance of this data lies in revealing the "dual-track inflation" characteristic of the U.S. economy: the coexistence of cost stickiness in the service sector and deflationary pressures in the goods sector. This differentiated pattern may force the Fed to adopt a more nuanced balancing strategy in policy formulation, needing to guard against repeated inflation in the service industry while addressing growth risks from weak manufacturing demand.
Tonight, if the initial jobless claims expectation (223,000) exceeds the previous value of 219,000, it may create a combination of "falling inflation + loosening employment," which could exacerbate market volatility. Historical data shows that when CPI diverges from employment and unemployment data by more than one standard deviation, the probability of the S&P 500 index experiencing a daily fluctuation of over 2% reaches 68%.
For the crypto market, the CPI data will trigger a threefold game: first, if core inflation remains unexpectedly strong, it may suppress Bitcoin's short-term performance as an inflation hedge, due to heightened expectations for rising real interest rates (the current 10-year TIPS yield has rebounded to 2.15%); second, if unemployment data shows a cooling labor market, it may activate the "recession trade" logic, pushing funds toward high-risk areas like crypto assets; finally, the repricing of CME interest rate futures after the data release will directly impact the crypto derivatives market. Data from the past 12 months shows that for every 25 basis point change in Fed policy expectations, the open interest in Bitcoin futures fluctuates by $1.8 billion. It is important to note that structural inflation factors like auto insurance have persistence, which may further weaken the negative correlation between the crypto market and traditional assets in the second quarter.
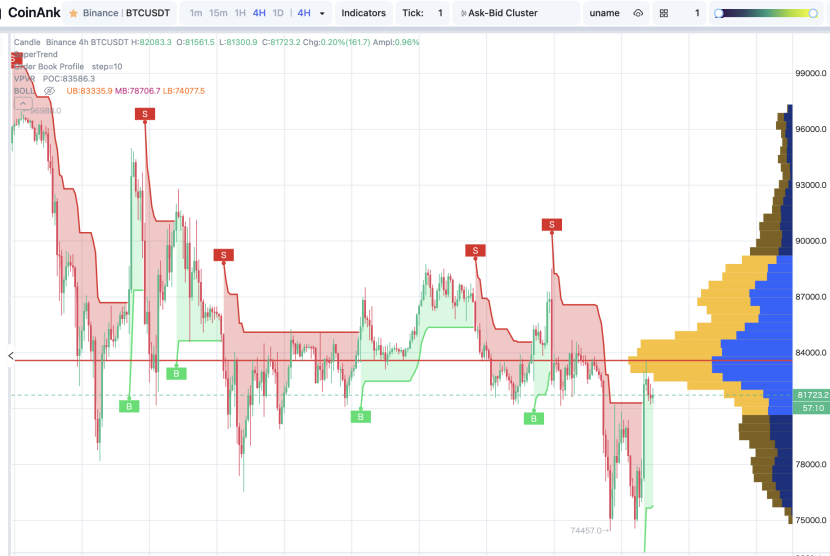
According to CoinAnk AI Smart Analysis, the BTC 4H Market Analysis Report is as follows:
Main Support Level: 77,013.37 USDT
Main Resistance Level: 84,832.37 USDT
Current Trend: Slightly Bullish
Technical Indicator Summary:
Moving Average System: Bullish arrangement. MA5=81,946.88, MA10=79,216.55, MA20=78,706.69, the moving averages show a bullish arrangement, indicating an upward short-term trend.
MACD: Golden cross in operation. DIF=84.48, DEA=-601.80, Histogram=686.28, MACD golden cross and the histogram continues to expand, indicating strong bullish momentum in the market.
BOLL: Price is above the middle band, close to the upper band. Upper band=83,335.92, middle band=78,706.69, lower band=74,077.46, %B=0.81%, indicating the price is in a strong zone.
RSI: Neutral to bullish. RSI6=63.59, RSI12=56.93, RSI14=55.57, RSI24=51.86, RSI indicators are in a neutral to bullish area, with no overbought or oversold signals.
KDJ: Golden cross in operation. K=74.70, D=66.67, J=90.76, KDJ golden cross and J line is at a high position, indicating upward momentum in the market in the short term.
Indicator Data:
Funding Rate: 0.00360400%. The funding rate is in a neutral range, with no clear long or short sentiment, and market sentiment is relatively stable.
Volume Changes: Recent trading volume has increased, especially during price rises, indicating that market participants are optimistic about price increases.
Capital Flow Data: 24-hour contract net inflow of 741,252,103.68 USDT, spot net inflow of 442,316,495.07 USDT, with significant capital inflow indicating active market participation supporting price increases.
Analysis Result:
Direction: Buy on Dips
Entry Timing: It is recommended to enter when the price pulls back to near MA5 or to chase long positions when the price breaks through resistance.
Stop Loss Setting: Set the stop loss below MA10, with a stop loss ratio of about 3%.
Target Price Levels: The first target is expected to yield about 7.8%; the second target is expected to yield about 13.4%.
Note: This analysis is for reference only and does not constitute any investment advice!
免责声明:本文章仅代表作者个人观点,不代表本平台的立场和观点。本文章仅供信息分享,不构成对任何人的任何投资建议。用户与作者之间的任何争议,与本平台无关。如网页中刊载的文章或图片涉及侵权,请提供相关的权利证明和身份证明发送邮件到support@aicoin.com,本平台相关工作人员将会进行核查。


