Track real-time hotspots in the cryptocurrency market and seize the best trading opportunities. Today is April 14, 2025, Monday, I am Wang Yibo! Good morning, crypto friends! ☀️ Die-hard fans check in! 👍 Like and make a fortune! 🍗🍗🌹🌹
==================================

==================================
In today's cryptocurrency market, price fluctuations seem to be entirely dominated by Trump's statements. Following a 90-day delay on tariffs, Trump recently announced that the tariff system has collapsed and declared exemptions for certain products from "reciprocal tariffs." As soon as this news broke, cryptocurrencies surged. However, last night, it was reported that the tariff exemptions are only temporary, and the cryptocurrency market was once again affected by this news, leading to increased selling pressure and a retreat to avoid risk. It is expected that all financial markets will enter a phase of emotional recovery in the coming period. Market participants need to take a breather to gradually regain their vitality. In the current state, the absence of positive news is equivalent to negative news; only the emergence of good news can drive the market out of the gloom and start the recovery process. On the operational level, it is essential to closely monitor macroeconomic conditions and the dynamic changes in news. Currently, the cryptocurrency market is highly correlated with the U.S. stock market, and whether an absolute bottom rebound can be achieved may require a few more days to observe if a reversal candlestick can effectively form. During this process, we will still use short-term indicators as the main basis for operations.
==================================
==================================
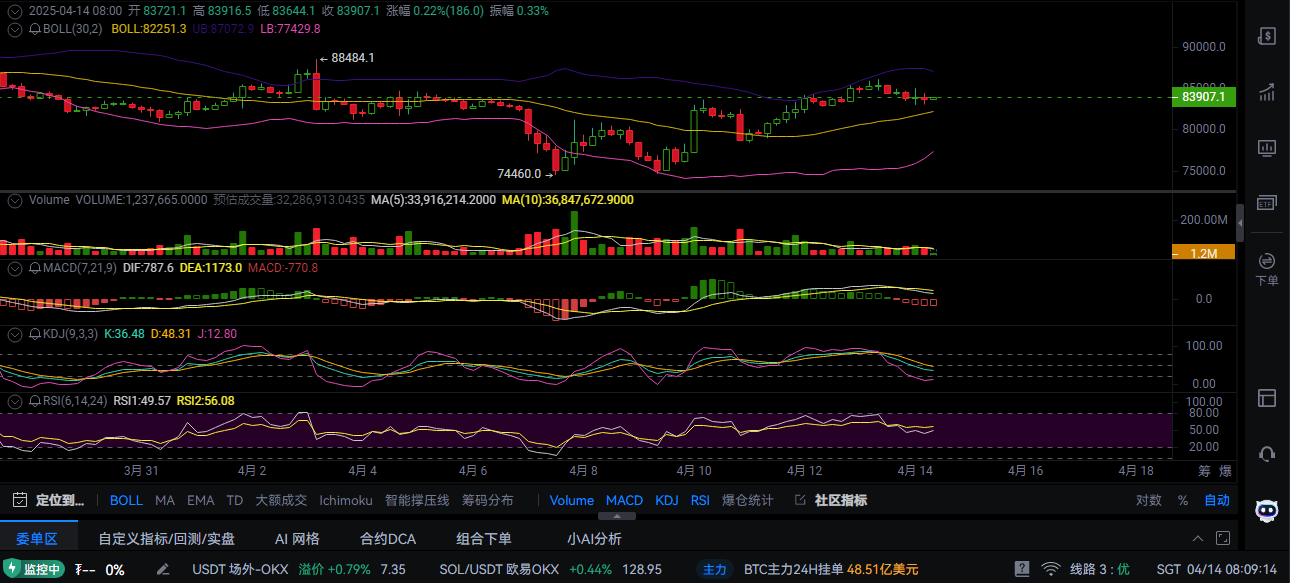
Bitcoin surged to a high of 86066 in the early morning yesterday before starting a pressured pullback. Both bulls and bears are frequently and intensely pulling at each other, resulting in significant price fluctuations. The overnight market continued to oscillate downward, briefly touching the 82956 position before temporarily halting, with the current price around 83400. From the daily chart, the price closed with a bullish candlestick on Saturday, successfully standing above the middle track, but yesterday the price oscillated and retreated, likely forming a bearish candlestick similar to Saturday's bullish candlestick, essentially giving back all the rebound space from yesterday. During the oscillation and pullback, Bitcoin's price has constructed a small stepped descending channel, showing a clear downward trend. After a significant bearish candlestick, a small bullish candlestick followed for correction, alternating between rebounds and declines, forming a standard oscillating stepped pattern. Meanwhile, on the 4-hour chart, the MACD indicator's fast and slow lines have not yet shown significant volume signs below the zero axis, indicating that there is still some support below. The subsequent situation will depend on whether the volume will increase. Therefore, in the morning's operational strategy, the focus is on whether the price can stabilize above 83300. If it can stabilize, the market will continue to maintain a range-bound oscillation.
==================================
==================================
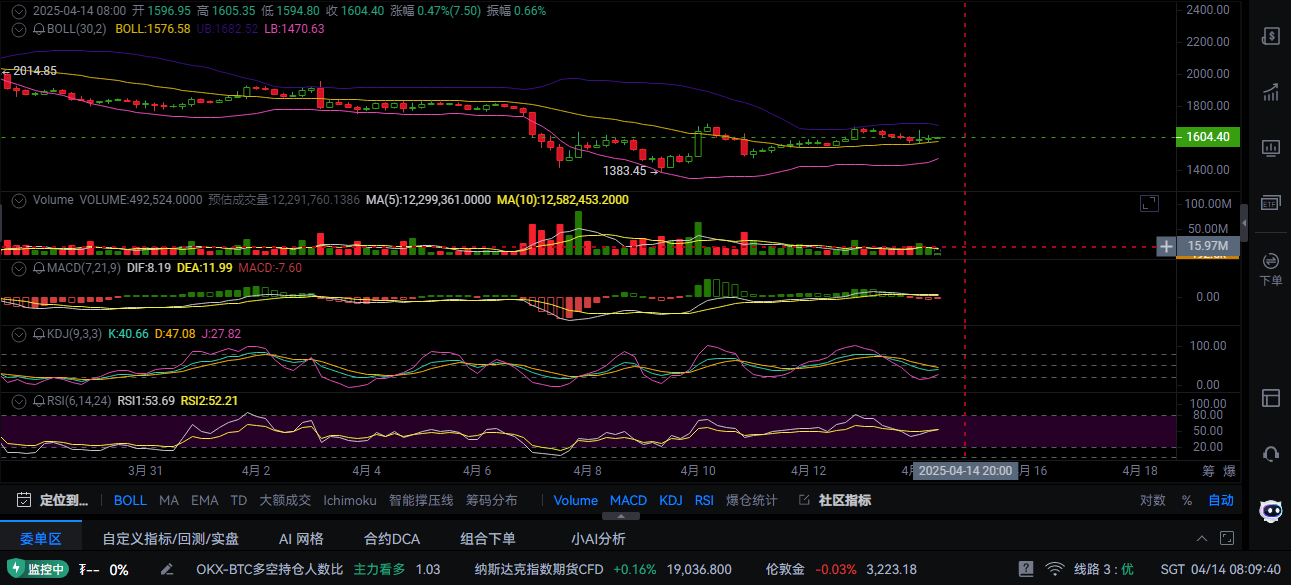
Ethereum's performance is relatively weaker, failing to break through the short-term high. After reaching a high of 1669, it also faced downward pressure and has seen a series of pullbacks. After suggesting a short position last night, the price dipped to a low of 1560 overnight, but the overall fluctuation range remains relatively narrow. The current price has rebounded again to around 1600. Although there has not yet been a decisive downward break, the technical indicators clearly show the early signs of a pullback, indicating that a downward trend is unlikely to reverse quickly in the short term. Observing the hourly chart, the Bollinger Bands have shown a clear downward divergence trend, with prices continuously testing downward during oscillations, trying to find a strong support level. Market sentiment is leaning towards weakness, and the overall market is still in a downward channel, with further adjustment pressure expected. Switching to the 4-hour level, the candlestick pattern shows an alternating situation of bullish and bearish, with bearish forces gradually gaining the upper hand, indicating that selling pressure remains strong in the short term, and the morning's operational strategy leans towards a high short position.
==================================
💎
💎
==================================
If you are feeling lost—don’t understand the technology, don’t know how to read the market, don’t know when to enter, don’t know how to set stop losses, don’t understand take profits, randomly increase positions, get stuck while trying to catch the bottom, can’t hold onto profits, miss out on opportunities… these are common problems for retail investors. But don’t worry, I can help you establish the correct trading mindset. A single profitable trade is worth more than a thousand words; finding the right direction is better than repeatedly failing. Instead of frequent trading, it’s better to strike precisely, making each trade more valuable. If you need real-time guidance, you can scan the QR code at the bottom of the article to follow my public account. The market changes rapidly, and due to the timeliness of reviews, subsequent trends will be based on real-time layouts. I look forward to moving steadily forward in the market with you.

免责声明:本文章仅代表作者个人观点,不代表本平台的立场和观点。本文章仅供信息分享,不构成对任何人的任何投资建议。用户与作者之间的任何争议,与本平台无关。如网页中刊载的文章或图片涉及侵权,请提供相关的权利证明和身份证明发送邮件到support@aicoin.com,本平台相关工作人员将会进行核查。