4 Alpha Core Insights This Week
Market Overview
- Abnormal Market Signals
Stock, bond, and currency markets all face turmoil: U.S. stocks experience extreme volatility (S&P up 5%), U.S. Treasury yields surge (10-year to 4.47%), and the dollar index falls below 100.
Divergence in safe-haven assets: Gold skyrockets (breaking $3200/ounce), the yen and Swiss franc strengthen, undermining the traditional safe-haven status of the dollar.
- Contradictory Economic Data
Early signs of stagflation: CPI declines (due to falling gasoline prices) but core inflation (housing + food) remains stubborn; PPI down 0.4% month-on-month (demand shrinkage + cost rigidity).
Tariff impacts not yet visible: Current data does not reflect the effects of new tariffs, with market pessimism leading the way.
3. Signs of a Liquidity Crisis
U.S. Treasury sell-off spiral: Long-term bonds plummet → collateral value shrinks → hedge funds forced to sell → yields rise further.
Pressure in the repo market: The spread between BGCR and SOFR widens, reflecting a sharp rise in collateral financing costs, exacerbating liquidity stratification.
4. Policy and External Risks
Trump’s tariff game: Tariffs on China rise to 145%, China retaliates with tariffs at 125%, trade war partially eases but long-term risks remain.
U.S. Treasury refinancing cliff: Nearly $9 trillion in debt maturing by 2025, if foreign holders sell off, liquidity pressure will intensify.
Outlook for Next Week
1. Market Shifts to Defensive Logic
Doubts about dollar credit: Funds shift to non-dollar safe-haven assets (gold, yen, Swiss franc).
Stagflation trades dominate: Long-term U.S. Treasuries and high-leverage equity assets face sell-off risks.
2. Key Monitoring Indicators
U.S. Treasury liquidity (whether 10-year yields break 5%), changes in Chinese bond holdings, Bank of Japan currency interventions, high-yield bond spreads.
Is capital fleeing the U.S.? What signals does the bond sell-off send?
1. Macroeconomic Review This Week
- 1. Market Overview
As the storm of reciprocal tariffs hits the financial markets, the Trump administration is forced to make some concessions; all countries except China receive a 90-day pause, but the trade confrontation with the U.S. has not ceased. As we warned in last week’s report, a series of trade news shocks have once again driven the market into extreme volatility. Currently, all tariff rates have been reduced to 10% except for China, where the previous tariff rate has been raised to 145%. In response, China has raised tariffs on U.S. imports to 125%.
U.S. Stocks: The S&P 500 index rose 5% this week, but the volatility was significant; the Dow Jones and Nasdaq also recorded gains of over 5%.
Safe-Haven Assets: The 10-year Treasury bond saw a rare continued drop, with yields rising to a high of 4.47%, and long-term bond sell-offs continue; meanwhile, the dollar index has unusually fallen below 100, leading to a simultaneous decline in stocks, bonds, and currencies. In contrast, spot gold continues to break new highs, exceeding $3200/ounce, with a weekly increase of over 5%.
Commodities: Due to the escalation of the tariff war, expectations of trade shrinkage have suppressed oil demand, with Brent crude continuing to weaken, down 5.5% this week to $62/barrel; copper prices also fell sharply by 13%, hitting a recent low.
Cryptocurrency: After a brief divergence from U.S. stocks last week, Bitcoin has resumed its correlation with U.S. stocks this week, with prices remaining suppressed below $85,000.
Chart: Historical Volatility and Returns of U.S. Stocks
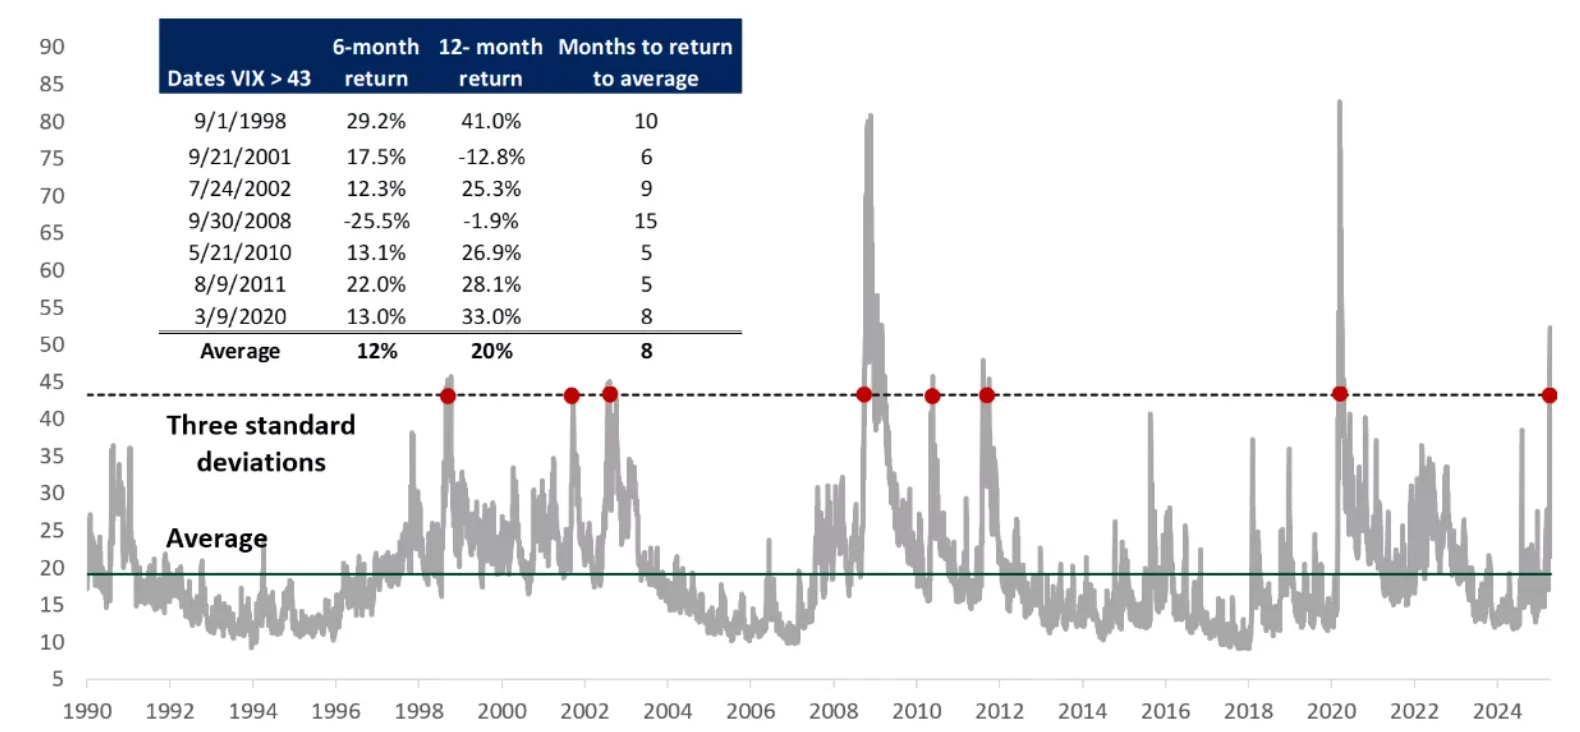
Source: Bloomberg
- 2. Economic Data Analysis
This week, attention continues to focus on Trump’s tariffs and CPI data.
2.1 Trump’s Tariff Analysis
Compared to the reciprocal tariffs announced last week, the Trump administration has made some concessions regarding tariffs this week.
The basic tariff rate is adjusted to 10%.
Specific tariffs on China are increased to 145%, while China has correspondingly raised tariffs on U.S. goods to 125%.
From this week’s observations, the announcement of tariffs has triggered global reactions, with some countries opting for countermeasures, such as China and Europe. Others have chosen negotiation, such as Japan, South Korea, and Vietnam. However, as the largest trade deficit country with the U.S., the escalation of the trade war between the two continues to shake global financial markets. As stock, bond, and currency markets have all seen significant declines approaching bear market territory, the U.S. government has made concessions, aligning with our predictions from last week that the tariff war surrounding trade will further trend towards easing, and the peak of uncertainty in trade policy has passed.
Chart: Impact of Tariffs on the U.S. Economy (Predictions from Different Institutions)
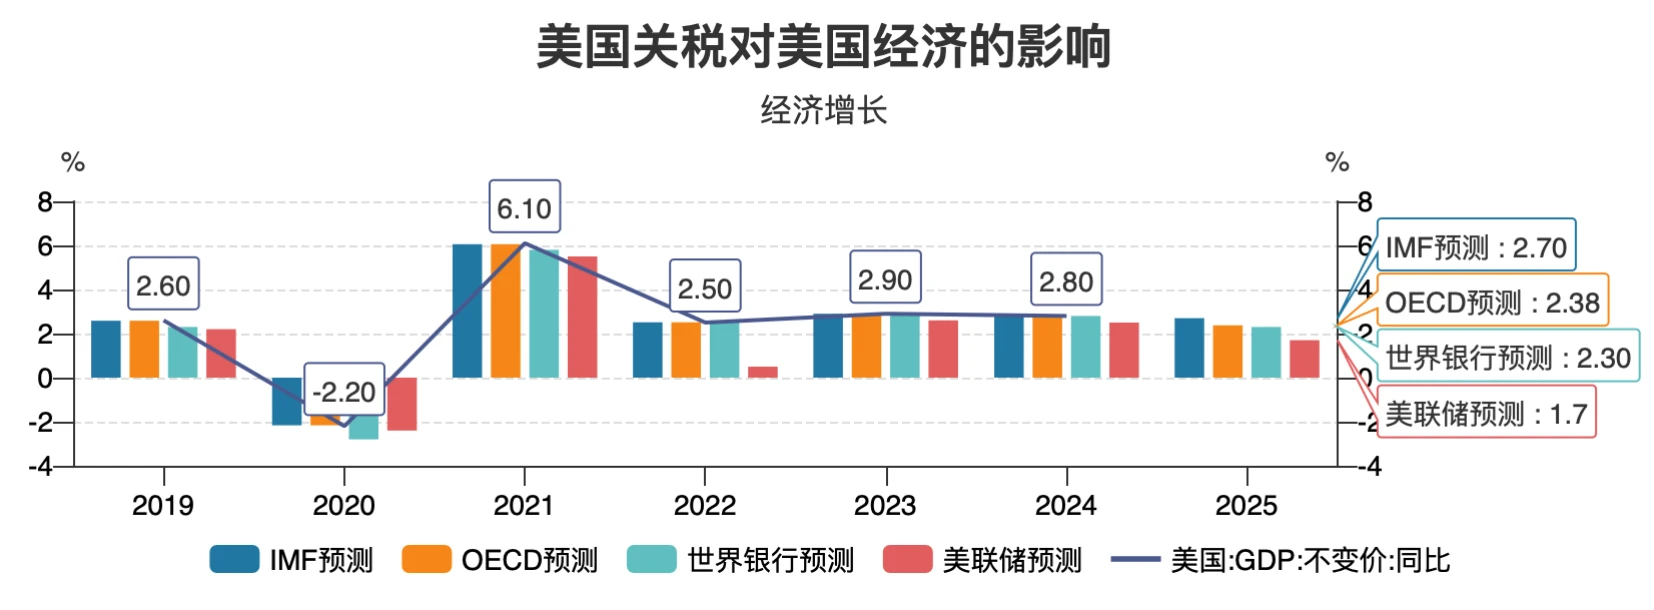
Source: Wind
2.2 CPI and PPI
This week’s CPI data unexpectedly declined, but considering that the data released this week does not include the impact of tariffs, the market reacted even more pessimistically.
Chart: U.S. March CPI Month-on-Month Performance
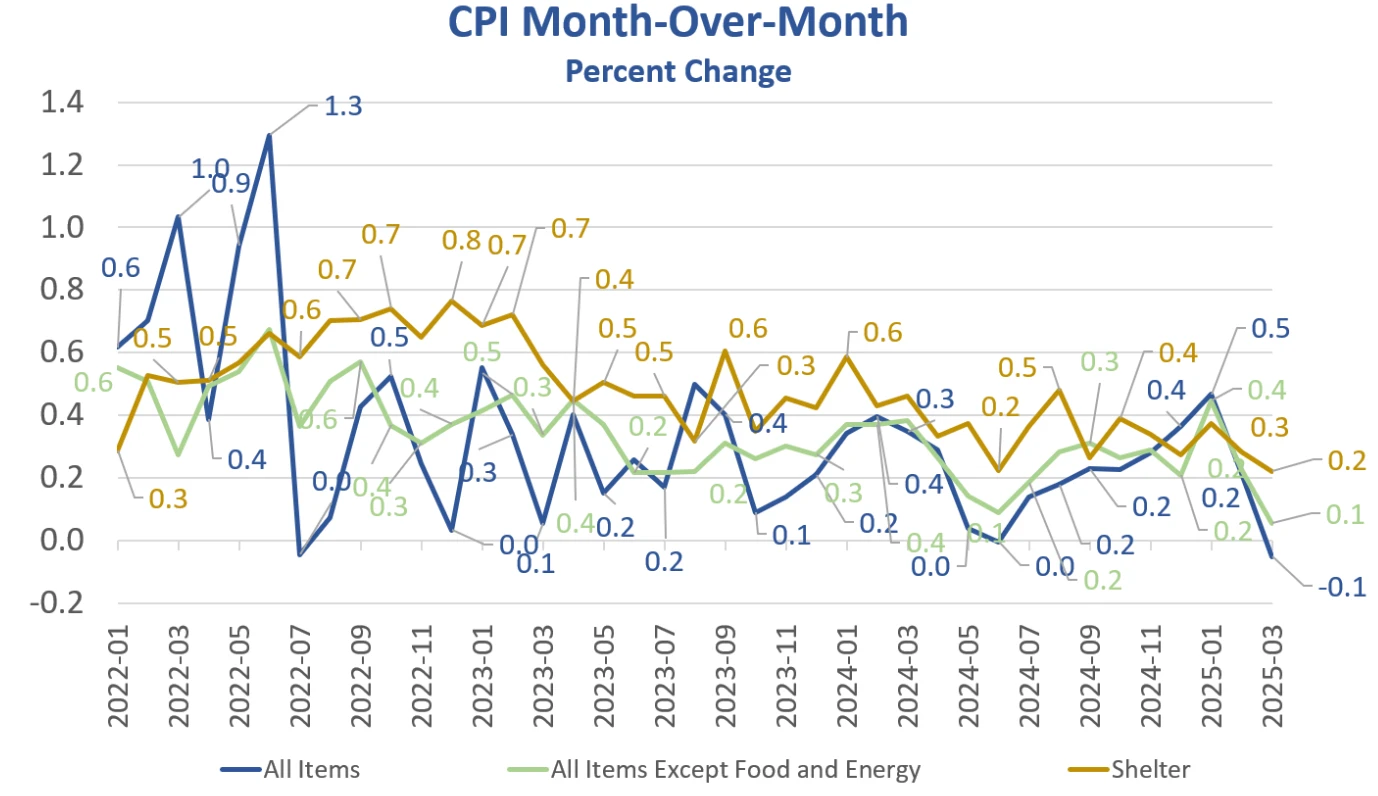
Source: MishTalk
This data represents the weakest figures since May 2020. From the breakdown of the data structure, the decline in gasoline prices improved the overall CPI situation; however, housing and food, as the largest rigid burdens for households, saw costs rise by 0.3% and 0.4%, respectively. Looking at core CPI, the price index of all goods excluding food and energy rose by 0.1%, compared to a 0.2% increase in February; major declines in March were seen in airline fares, motor vehicle insurance, used cars and trucks, and entertainment.
On Friday, the U.S. Department of Labor released PPI data, which, after seasonal adjustment, showed a month-on-month decline of 0.4% in March, marking the lowest monthly growth since the COVID-19 pandemic began. From the breakdown, the main reason was also the decline in commodity prices; energy and food prices saw slight decreases, but core goods excluding energy still rose, indicating that the cost pressures from tariffs have not eased; in the services sector, demand-sensitive areas such as transportation, warehousing, and wholesale have clearly contracted, while rigid services remain relatively stable.
Chart: U.S. March PPI Performance
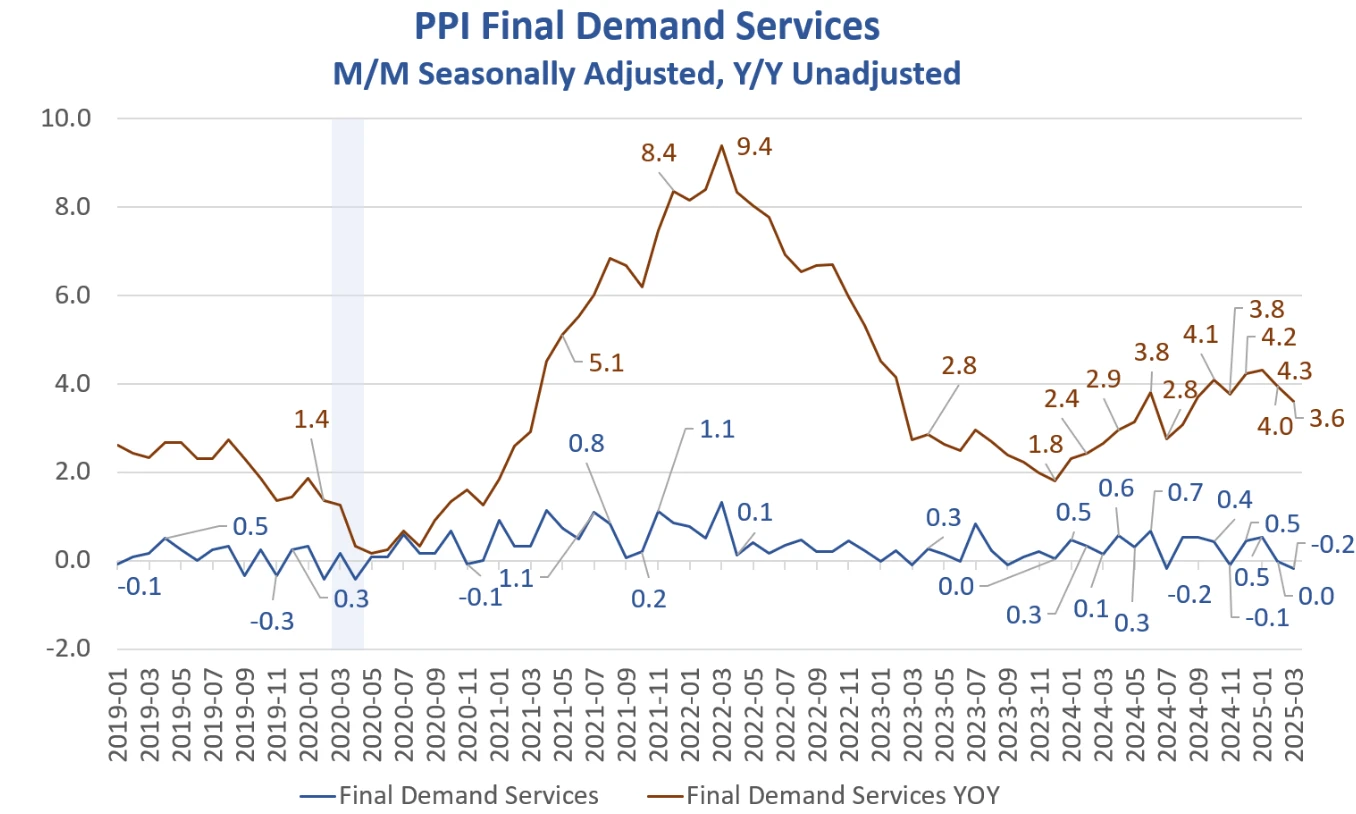
Source: MishTalk
In summary, the price signals from PPI conclude that supply-side cost pressures still exist, but the marginal weakening of demand-side trends is strengthening, showing preliminary signs of stagflation.
From the CPI and PPI data released this week, it can be clearly established that under the impact of tariffs and market pessimism, the shrinkage of demand and the rigidity of supply-side cost pressures will, on one hand, compress corporate profits and affect economic performance; on the other hand, they hinder the smooth decline of inflation, with stagflation risks gradually beginning to appear in the data.
- 3. Liquidity and Interest Rates
From the perspective of the Federal Reserve's balance sheet, this week, the Fed's broad liquidity has continued to marginally recover to $6.2 trillion, returning to positive year-on-year.
However, this week, the dollar index and U.S. Treasury market have sent another ominous signal.
Chart: Changes in U.S. Overnight Financing Rates and Treasury Yields
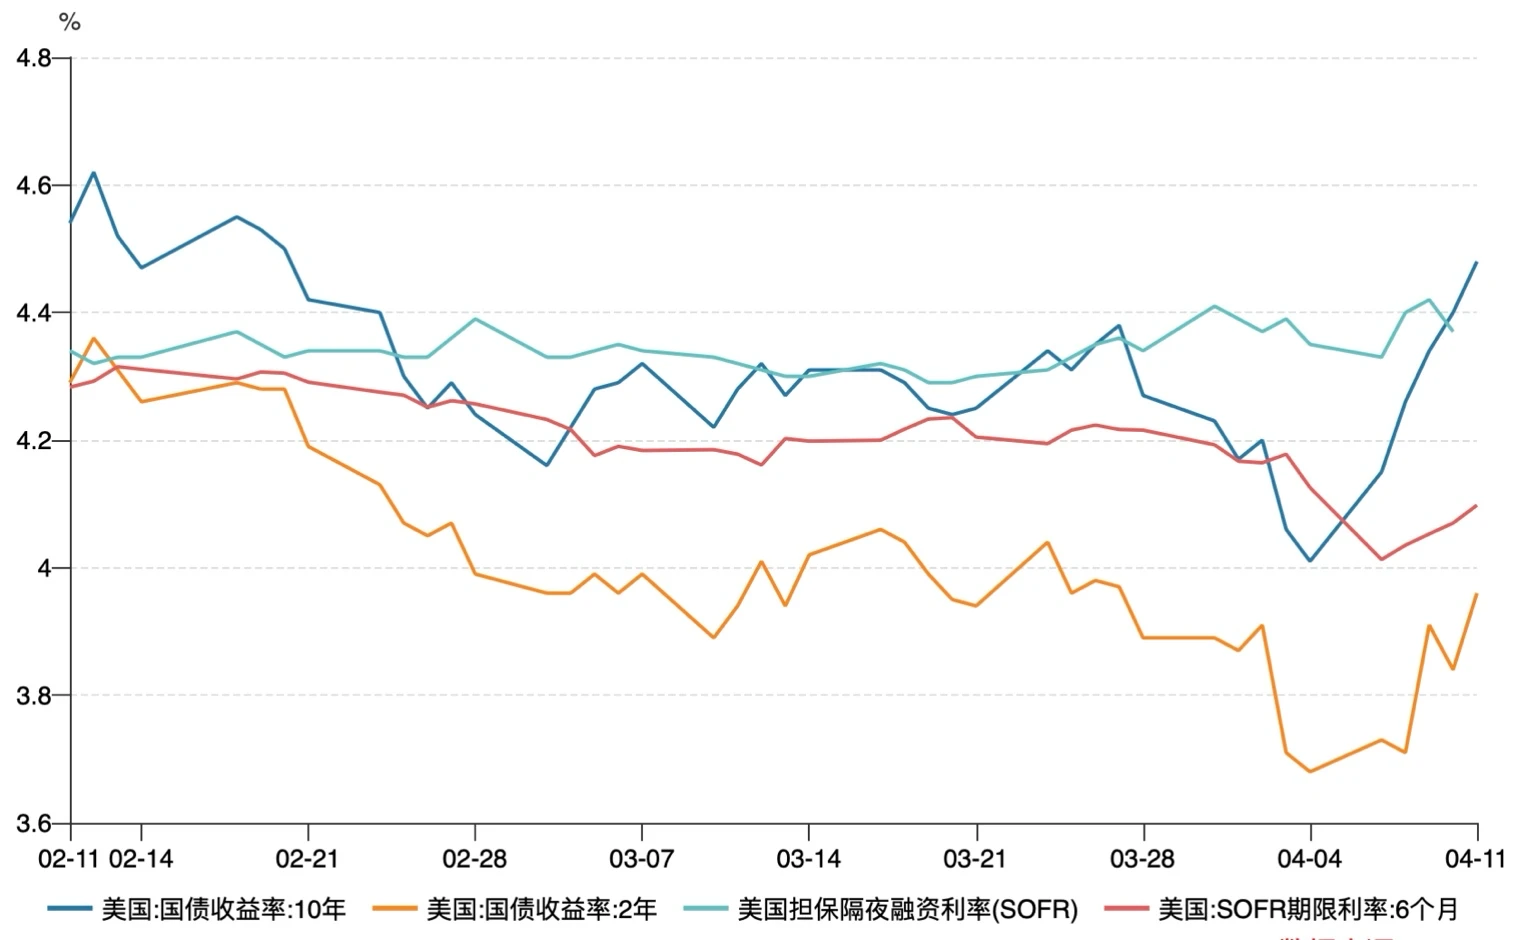
Source: Wind
As shown in the chart above:
1) The yield on the 10-year U.S. Treasury bond surged this week, indicating that the sell-off storm is still ongoing, with overall yields rising to around 4.45%.
2) SOFR term rates have rebounded this week, indicating that the market is pricing in the possibility that the Fed may continue to tighten monetary policy rather than quickly cut rates.
At the same time, further analysis of the dollar index reveals that the surge in U.S. Treasury yields coincides with a significant drop in the dollar index.
Chart: Changes in the Dollar Index
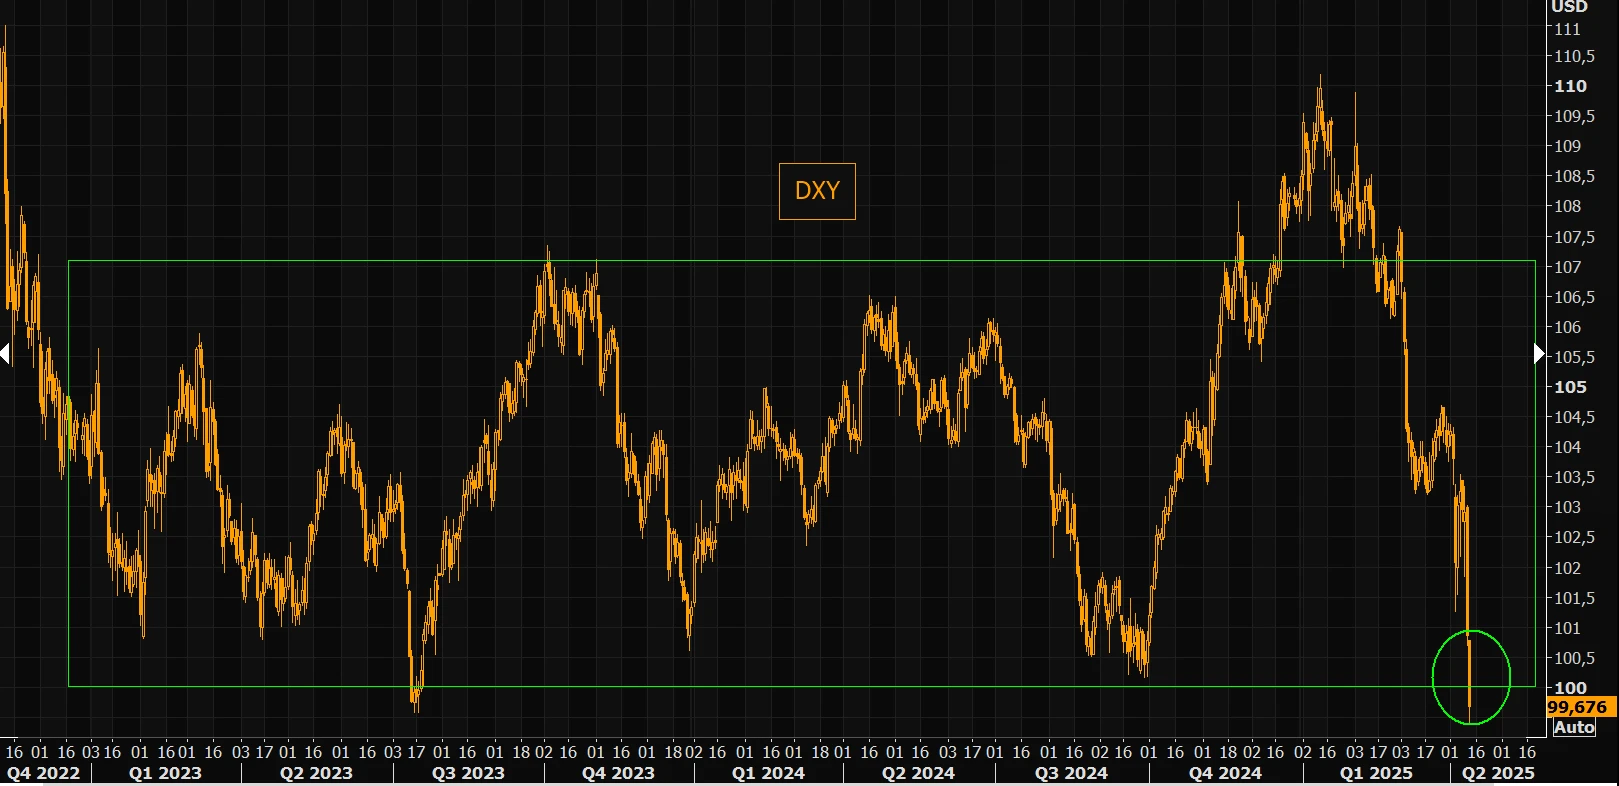
Source: ZeroHedge
This week’s anomaly is that the original expectation of falling oil prices and declining inflation data would further suppress the rise in U.S. Treasury yields, yet we have seen a simultaneous decline in stocks, bonds, and currencies. The dollar index has fallen below the 100 mark, hitting a new low for 2023 in July, while traditional safe-haven currencies like the Swiss franc and yen have strengthened simultaneously. Analyzing this anomaly further, we can draw the following conclusions.
1) As we analyzed above, under the impact of increased tariffs and the preliminary emergence of stagflation risks, the volatility index (Move Index) has surged, with the market pricing in the Fed's "higher for longer" stance. Long-term Treasury yields (such as 10/30 years) have risen rapidly, while swap rates are suppressed by recession expectations, leading to a narrowing or even inversion of the basis, compounded by sell-offs from foreign central banks. The rapid decline in long bond prices triggers a decrease in the value of collateralized Treasury bonds, forcing hedge funds to sell Treasuries to cover positions, creating a "decline → sell-off → further decline" spiral.
Furthermore, we can clearly see from the financing end rates of hedge fund leverage (BGCR) that from mid to late March to early April, the difference between BGCR and SOFR has significantly widened, especially after March 22, where BGCR (blue line) has clearly declined while SOFR (green line) has remained relatively stable. This indicates that the market may have experienced some severe liquidity changes or fluctuations in market sentiment at this time, leading to increased basis trading pressure and further triggering a series of forced liquidation actions.
Chart: Repo Market Rates and SOFR Rates Performance
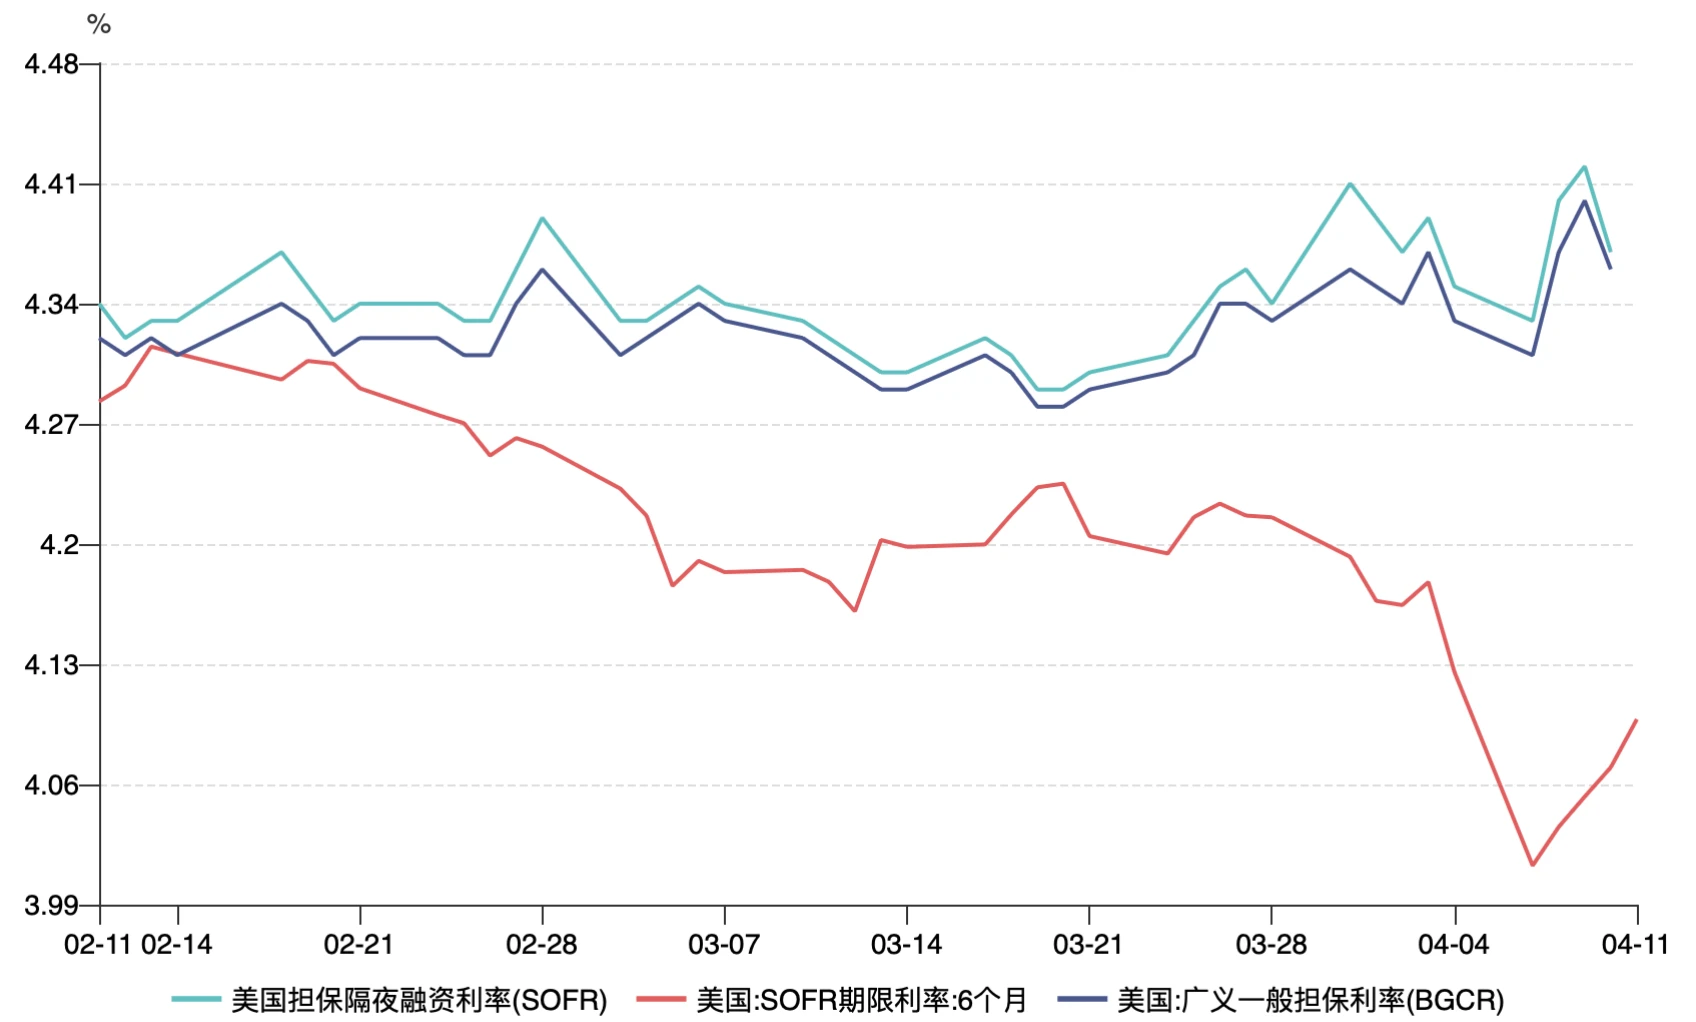
Source: Wind
2) The typical decline in the dollar index stems from the loosening of dollar liquidity; U.S. Treasury yields reflect expectations for economic growth. However, the simultaneous decline in the dollar index and U.S. Treasury prices (with yields rising) is not due to significant loosening of dollar liquidity or a clear improvement in economic growth, but rather a migration of funds away from the U.S. to safe havens in Japan and Europe (with the yen, euro, and Swiss franc appreciating). In other words, the traditional safe-haven logic of the dollar has failed.
3) U.S. Treasuries face significant refinancing pressure in 2025, with nearly $9 trillion in debt maturing, including $6 trillion due in June. All of this debt must be repaid through refinancing (borrowing new to pay old), and part of the implication of Trump's tariffs is to force other countries to purchase U.S. Treasuries, which may be difficult to achieve in the current scenario. This could lead foreign holders to sell U.S. Treasuries out of risk aversion.
In fact, from the above three points, it is clear that the current situation reflects a lack of trust in the dollar's credit itself. The migration of funds to safe havens and the repricing of debt risks have led to a liquidity crisis in the entire U.S. Treasury market.
II. Macroeconomic Outlook for Next Week
The current market is shifting from "inflation concerns" to a dual impact of "dollar credit crisis + stagflation," with the traditional negative correlation between stocks and bonds gradually breaking down. Attention should be paid to the following risks:
1) Stagflation risks emerging under tariff pressure: Current economic data, including CPI and PPI, indicate that the U.S. economy is facing stagflation risks. The coexistence of shrinking demand and rigid cost pressures on the supply side compresses corporate profit margins while making it difficult for inflation to decline rapidly. Stagflation typically signifies a dilemma of slowing economic growth and persistent inflation, creating significant uncertainty for the market's long-term performance.
2) Pressure in the bond market and tight dollar liquidity: The yield on 10-year U.S. Treasuries has surged to around 4.45%, indicating that the bond market sell-off is ongoing, and long-term bond prices are further declining, triggering pressure on basis trading, especially for institutions like hedge funds. This situation may lead to more debt sell-offs and a chain reaction, forming a "decline → sell-off → further decline" spiral, further increasing market instability.
3) U.S. Treasury refinancing pressure: The U.S. faces enormous refinancing pressure on its Treasuries, with about $9 trillion in debt maturing over the next few years, particularly around $6 trillion due in June. How to refinance and repay this debt will be a significant challenge for U.S. fiscal policy. Trump's tariff policy may attempt to force other countries to buy U.S. Treasuries, but in the current economic environment, this may be difficult to achieve, potentially leading foreign holders to sell U.S. Treasuries out of risk aversion, further exacerbating market risks.
Based on the aforementioned analysis, our overall view is:
The current trading benchmark remains primarily defensive.
Further attention is needed on the evolution of stagflation patterns to assess whether economic growth will accelerate into recession or inflation will decline less than expected.
Continued monitoring of the liquidity crisis in U.S. Treasuries, especially whether the high-yield credit bond market will also be affected.
The weakness of the dollar may continue to impact global markets, particularly in the context of global capital flows, with the strengthening of safe-haven currencies like the yen and Swiss franc warranting attention. Investors should consider how to adjust their allocations to dollar assets and monitor dynamics in the foreign exchange market.
Cryptocurrencies are primarily influenced by the dollar and currently lack sufficient upward momentum; the current safe-haven logic is not very strong, so a neutral stance is still recommended in the short term.
Attention should be paid to the evolution of tariffs; if they further slow down, it may boost risk appetite; if U.S. Treasury yields rise above 5%, further sell-offs by foreign holders and potential Fed intervention could trigger a deeper credit crisis.
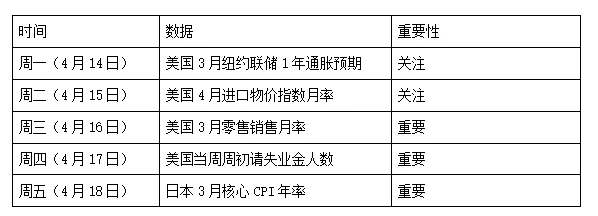
Key macroeconomic data for next week is as follows:
Disclaimer
This document is for internal reference only by 4Alpha Group, based on 4Alpha Group's independent research, analysis, and interpretation of existing data. The information contained in this document is not investment advice and does not constitute an offer or invitation to residents of the Hong Kong Special Administrative Region, the United States, Singapore, or any other countries or regions where such offers are prohibited to purchase, sell, or subscribe to any financial instruments, securities, or investment products. Readers should conduct their own due diligence and seek professional advice before contacting us or making any investment decisions.
This content is protected by copyright and may not be copied, distributed, or transmitted in any form or by any means without the prior written consent of 4Alpha Group. While we strive to ensure the accuracy and reliability of the information provided, we do not guarantee its completeness or timeliness and accept no liability for any loss or damage arising from reliance on this document.
By accessing this document, you acknowledge and agree to the terms of this disclaimer.
免责声明:本文章仅代表作者个人观点,不代表本平台的立场和观点。本文章仅供信息分享,不构成对任何人的任何投资建议。用户与作者之间的任何争议,与本平台无关。如网页中刊载的文章或图片涉及侵权,请提供相关的权利证明和身份证明发送邮件到support@aicoin.com,本平台相关工作人员将会进行核查。


