Source: Cointelegraph Original: "{title}"
Bitcoin (BTC) aimed for a new April high as Wall Street opened on April 15, with the market expressing skepticism about BTC price strength.
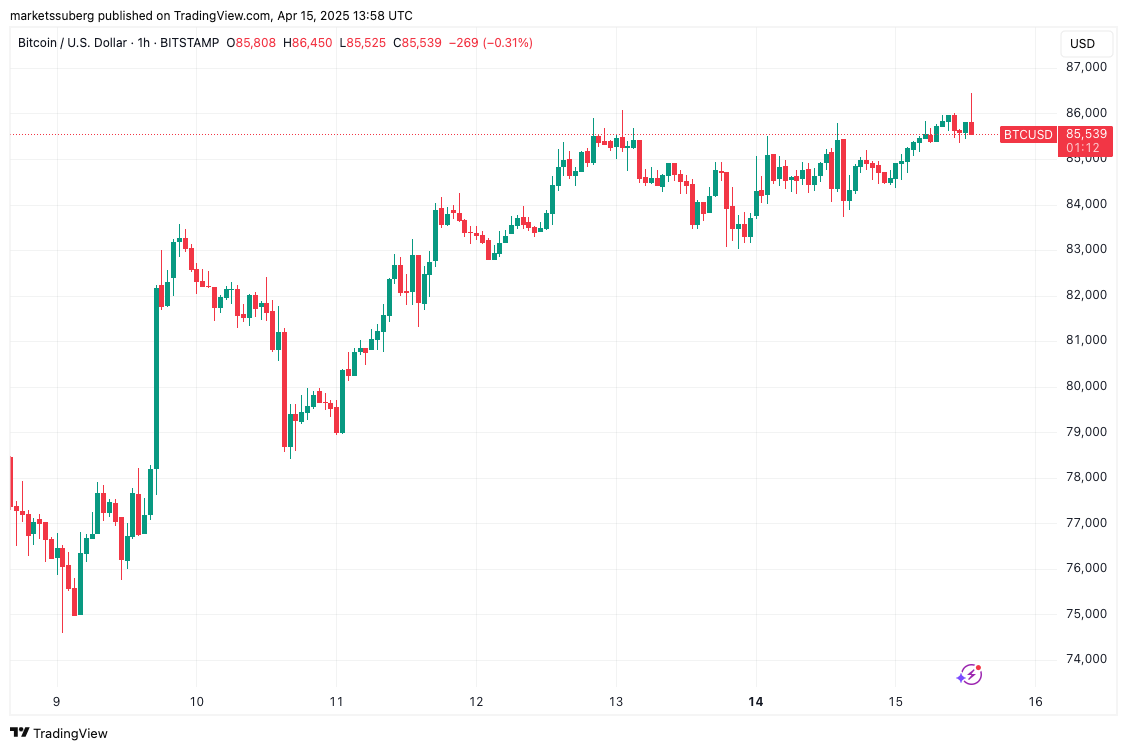
BTC/USD hourly chart. Source: Cointelegraph/TradingView
Data from Cointelegraph Markets Pro and TradingView indicates that BTC/USD is attempting to break through $86,000.
The continued strength over the weekend has set the stage for the BTC/USD trading pair to challenge the $90,000 mark, a level that has not been reached since early March.
However, concerns over macroeconomic volatility centered around the U.S. trade war have made market participants hesitant to declare that the Bitcoin bull market correction is over.
“It’s interesting to see market sentiment shift so quickly—just a few days ago, everyone was predicting $50,000, and now they are eager to turn bullish at the first green candle. This emotional rollercoaster is exactly why most traders lose money,” trading information platform Stockmoney Lizards wrote in their latest analysis on the X platform.
“While short-term momentum appears bullish, we still face multiple resistances before confirming that the correction is complete.”
Stockmoney Lizards expects the BTC price to continue oscillating within a range before breaking through the crucial long-term resistance near $100,000.
They predict: “We maintain a cautiously optimistic outlook—expecting Bitcoin to oscillate between $78,000 and $88,000 for several weeks, building energy for the next move.”
“Once we break through the $97,000 area, the path to surpassing $110,000 by the end of summer will become more feasible.”
A key topic of discussion among traders is BTC's attempt to break through a downward trend line that has been in place for several months.
As Cointelegraph previously reported, this trend line has existed since BTC/USD set its current all-time high in January. Now, its role as resistance seems to be weakening.
“It’s breaking the multi-month downtrend line not just for $86,000, but also looking to challenge higher points near the 200-day moving average,” noted prominent trader SuperBro in a recent update on the X platform.
SuperBro referred to the 200-day simple moving average (SMA), a classic bull market support trend line currently positioned at $87,566.
“If creating higher points is successful, which I think is quite likely, then it can pull back above any previous low to form a higher low, then surge towards the wedge target above $100,000,” he added.
However, not everyone believes that breaking the downward trend line will mark a turning point for Bitcoin bulls.
For veteran trader Peter Brandt, observing price behavior near the trend line is meaningless.
“Of all chart constructions, trend lines are the least important,” he told his followers on the X platform that day.
“A trend line break does not mean a trend reversal.”
Related: U.S. tariff exemption expectations ease pressure on U.S. bond yields, Bitcoin traders bet on breaking $90,000
免责声明:本文章仅代表作者个人观点,不代表本平台的立场和观点。本文章仅供信息分享,不构成对任何人的任何投资建议。用户与作者之间的任何争议,与本平台无关。如网页中刊载的文章或图片涉及侵权,请提供相关的权利证明和身份证明发送邮件到support@aicoin.com,本平台相关工作人员将会进行核查。


