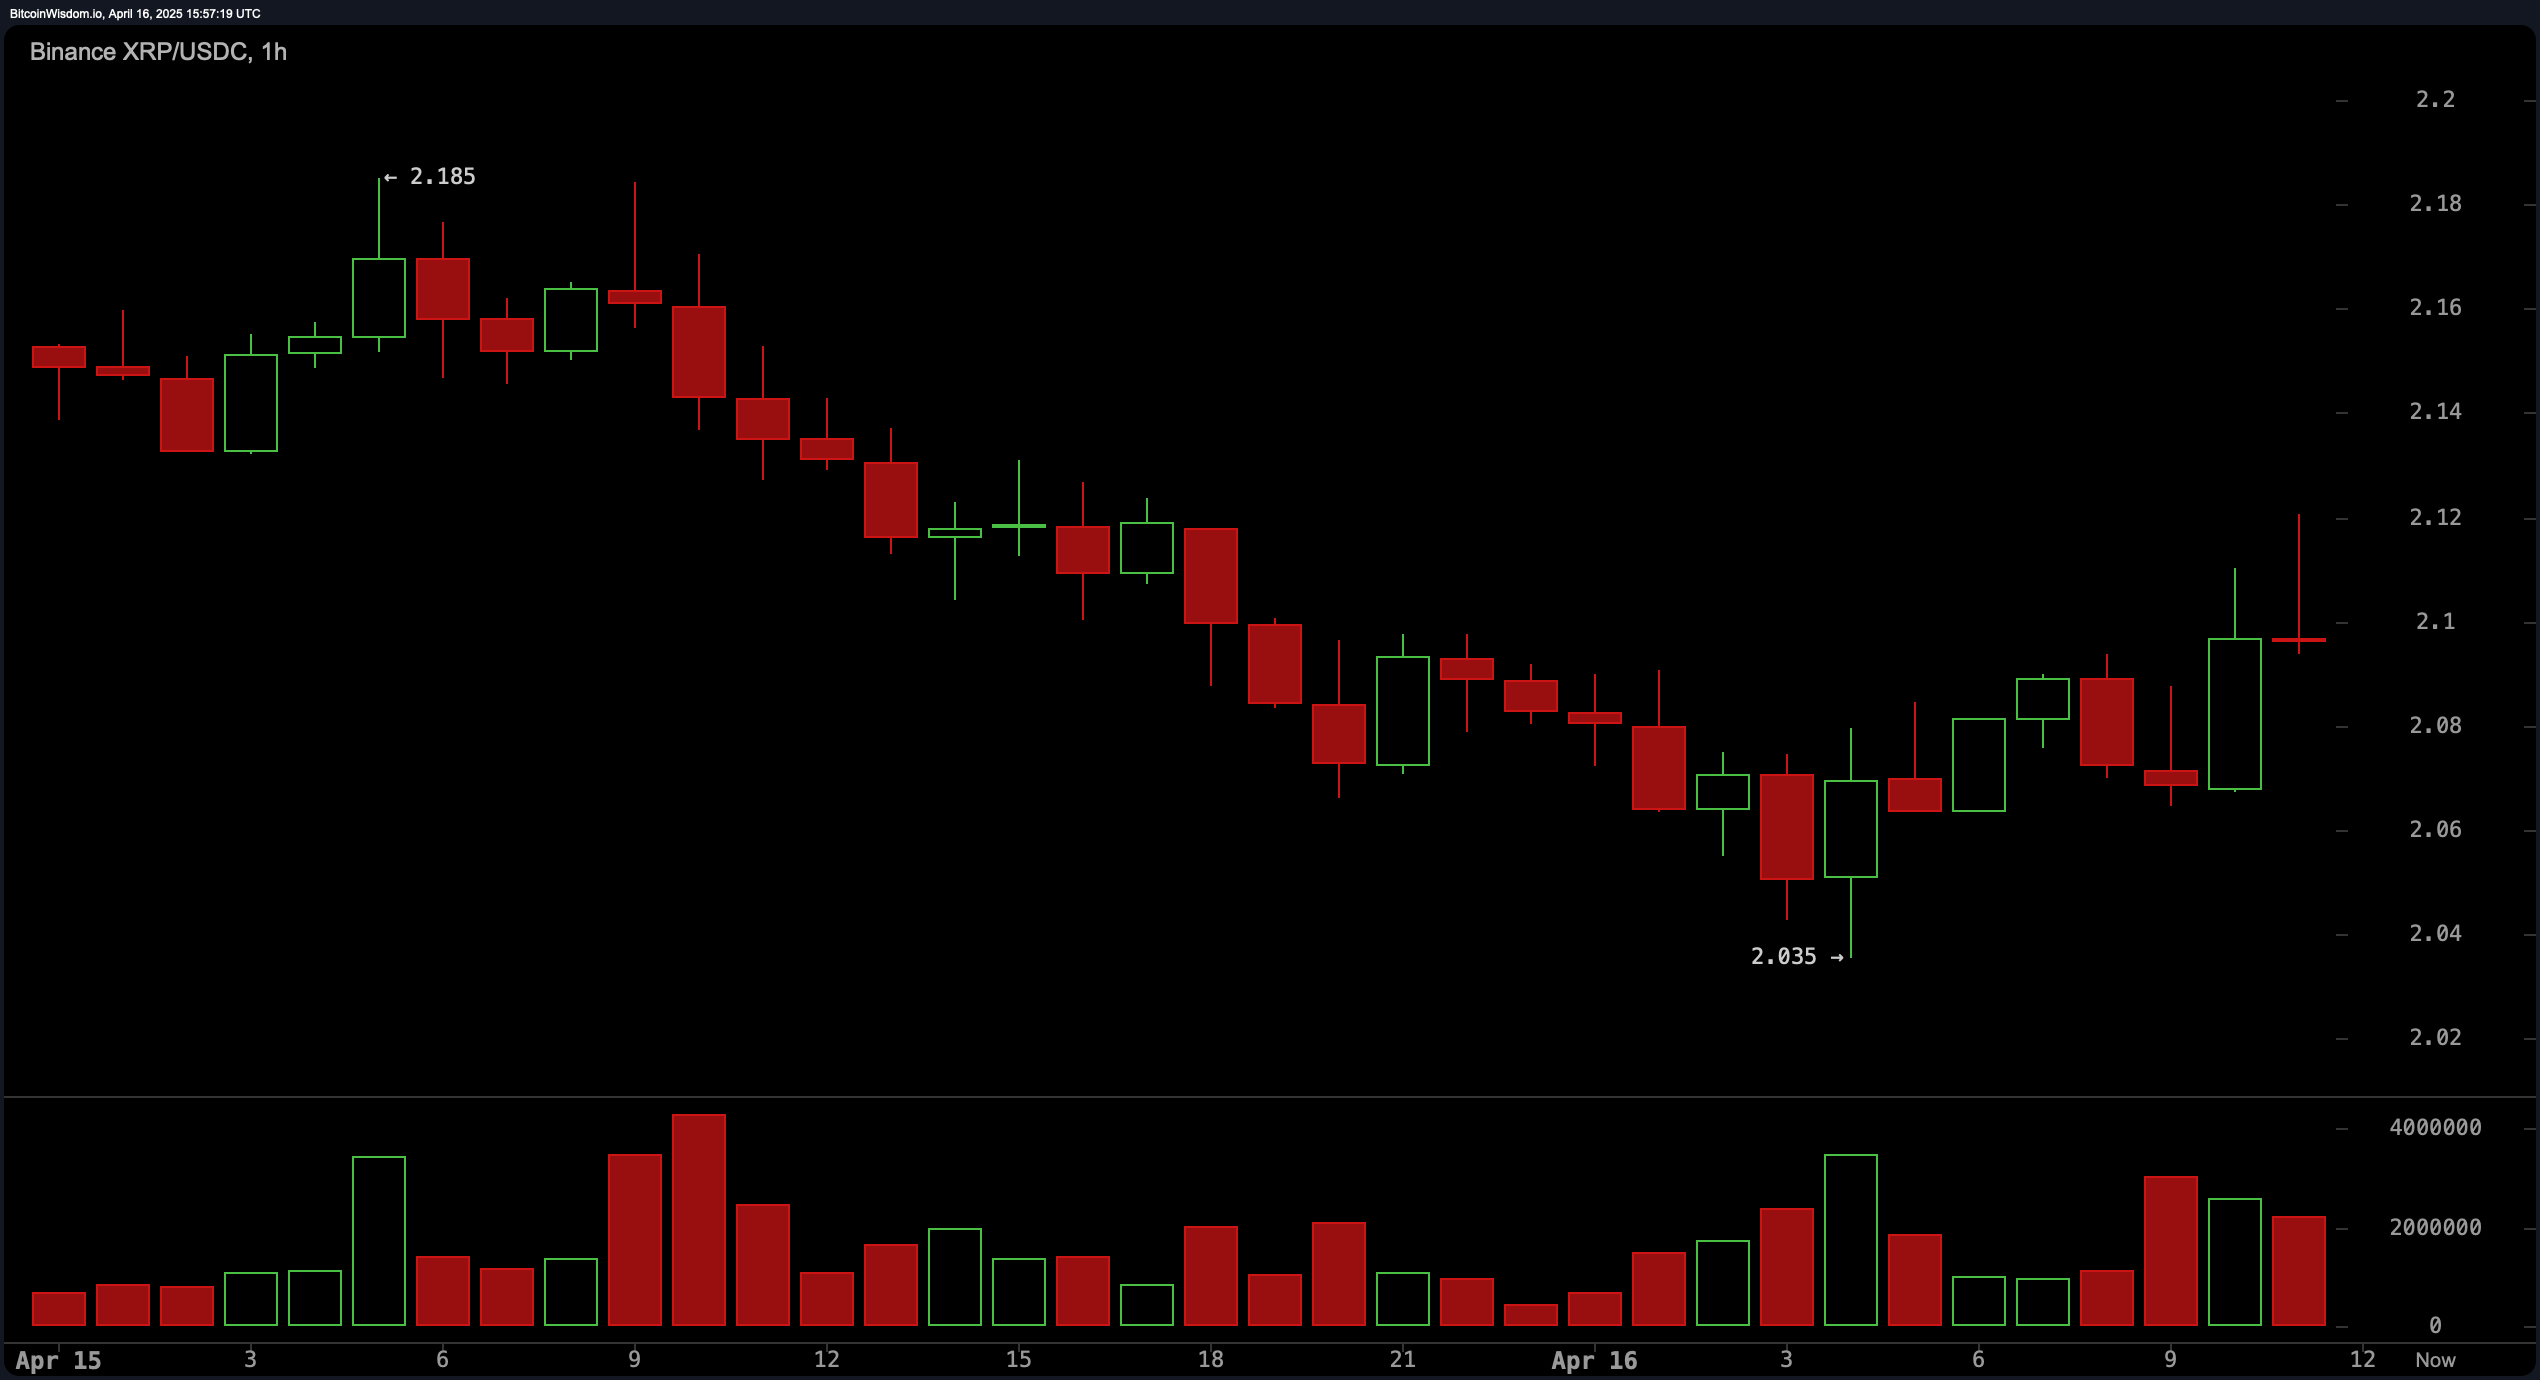
The 1-hour chart shows XRP recovering from a downtrend that saw prices dip to $2.035, forming a potential double-bottom reversal pattern. A recent green candle near $2.10, accompanied by rising volume, suggests bullish momentum resurgence. Traders eye a break above the minor resistance at $2.105 to confirm upward continuation, targeting $2.15–$2.18. A stop loss below $2.06 is advised to manage downside risk in this volatile intraday setup.

XRP/USDC via Binance on April 16, 2025. 1 hour chart.
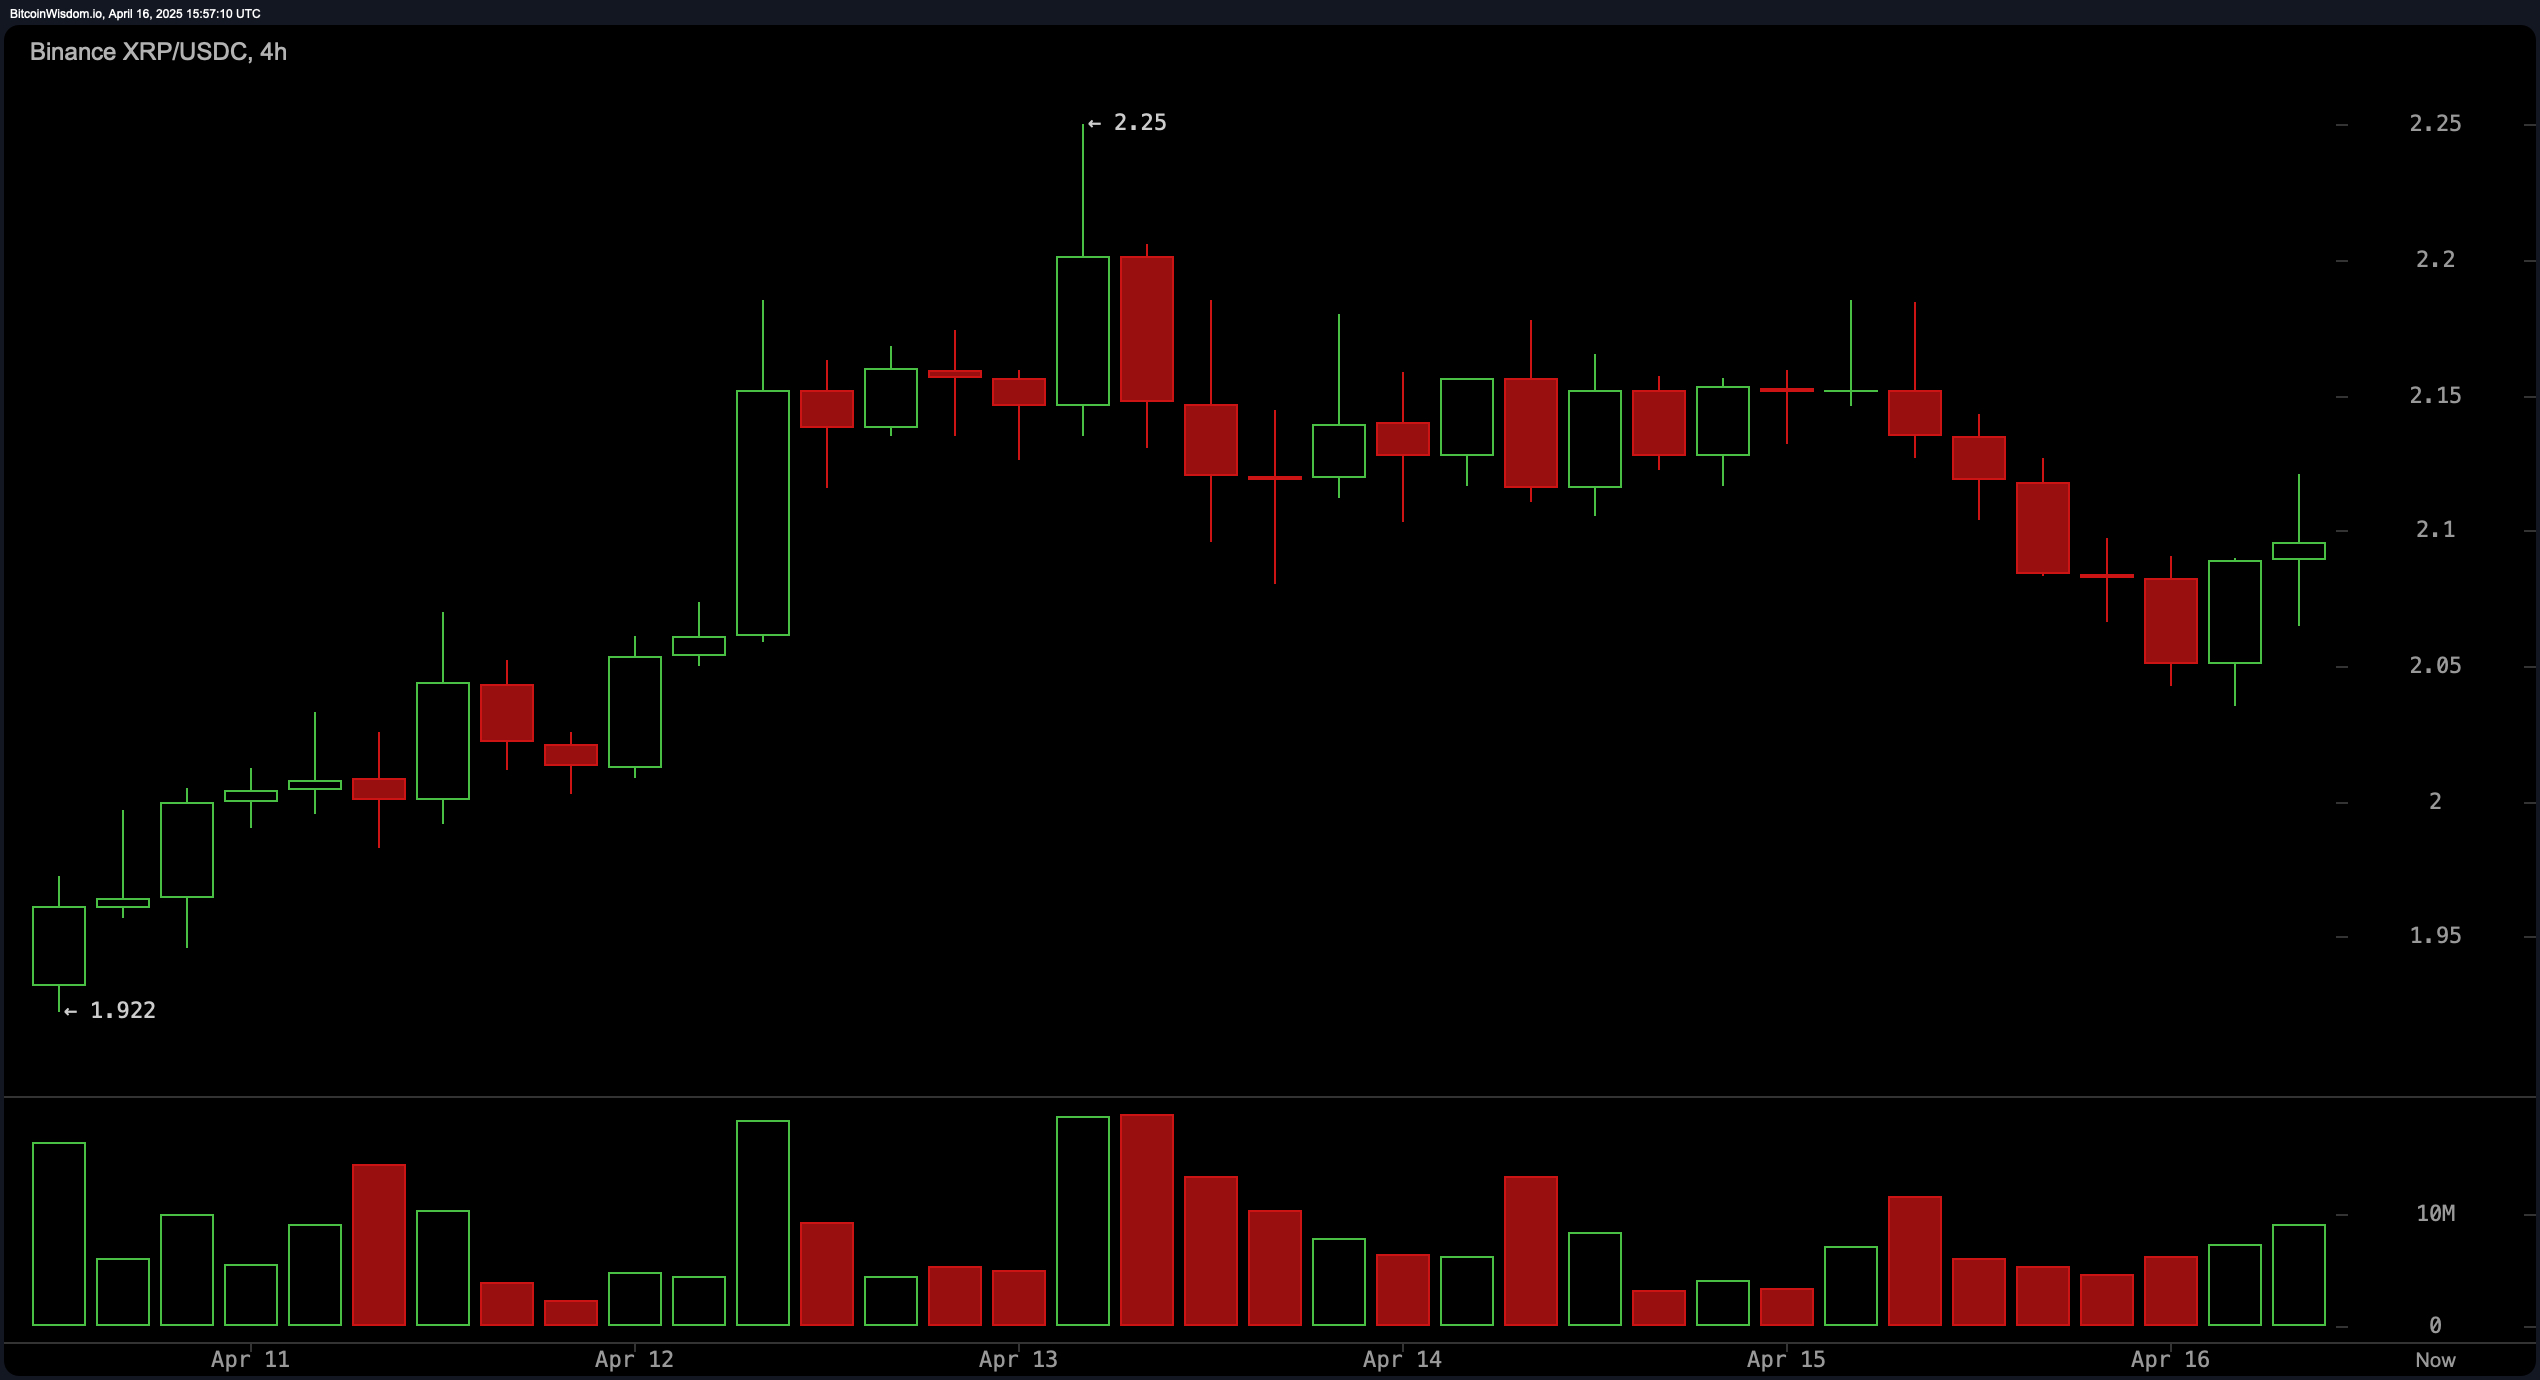
On the 4-hour timeframe, XRP has traded sideways between $2.05 and $2.15 after rallying from $1.92 to $2.25. While bullish pressure appears tentative, a decisive close above $2.16 with elevated volume could signal another leg up toward $2.25–$2.30. The stop loss below $2.05 aligns with recent support zones. This neutral-bullish bias reflects cautious optimism as markets await clearer directional cues.

XRP/USDC via Binance on April 16, 2025. 4-hour chart.
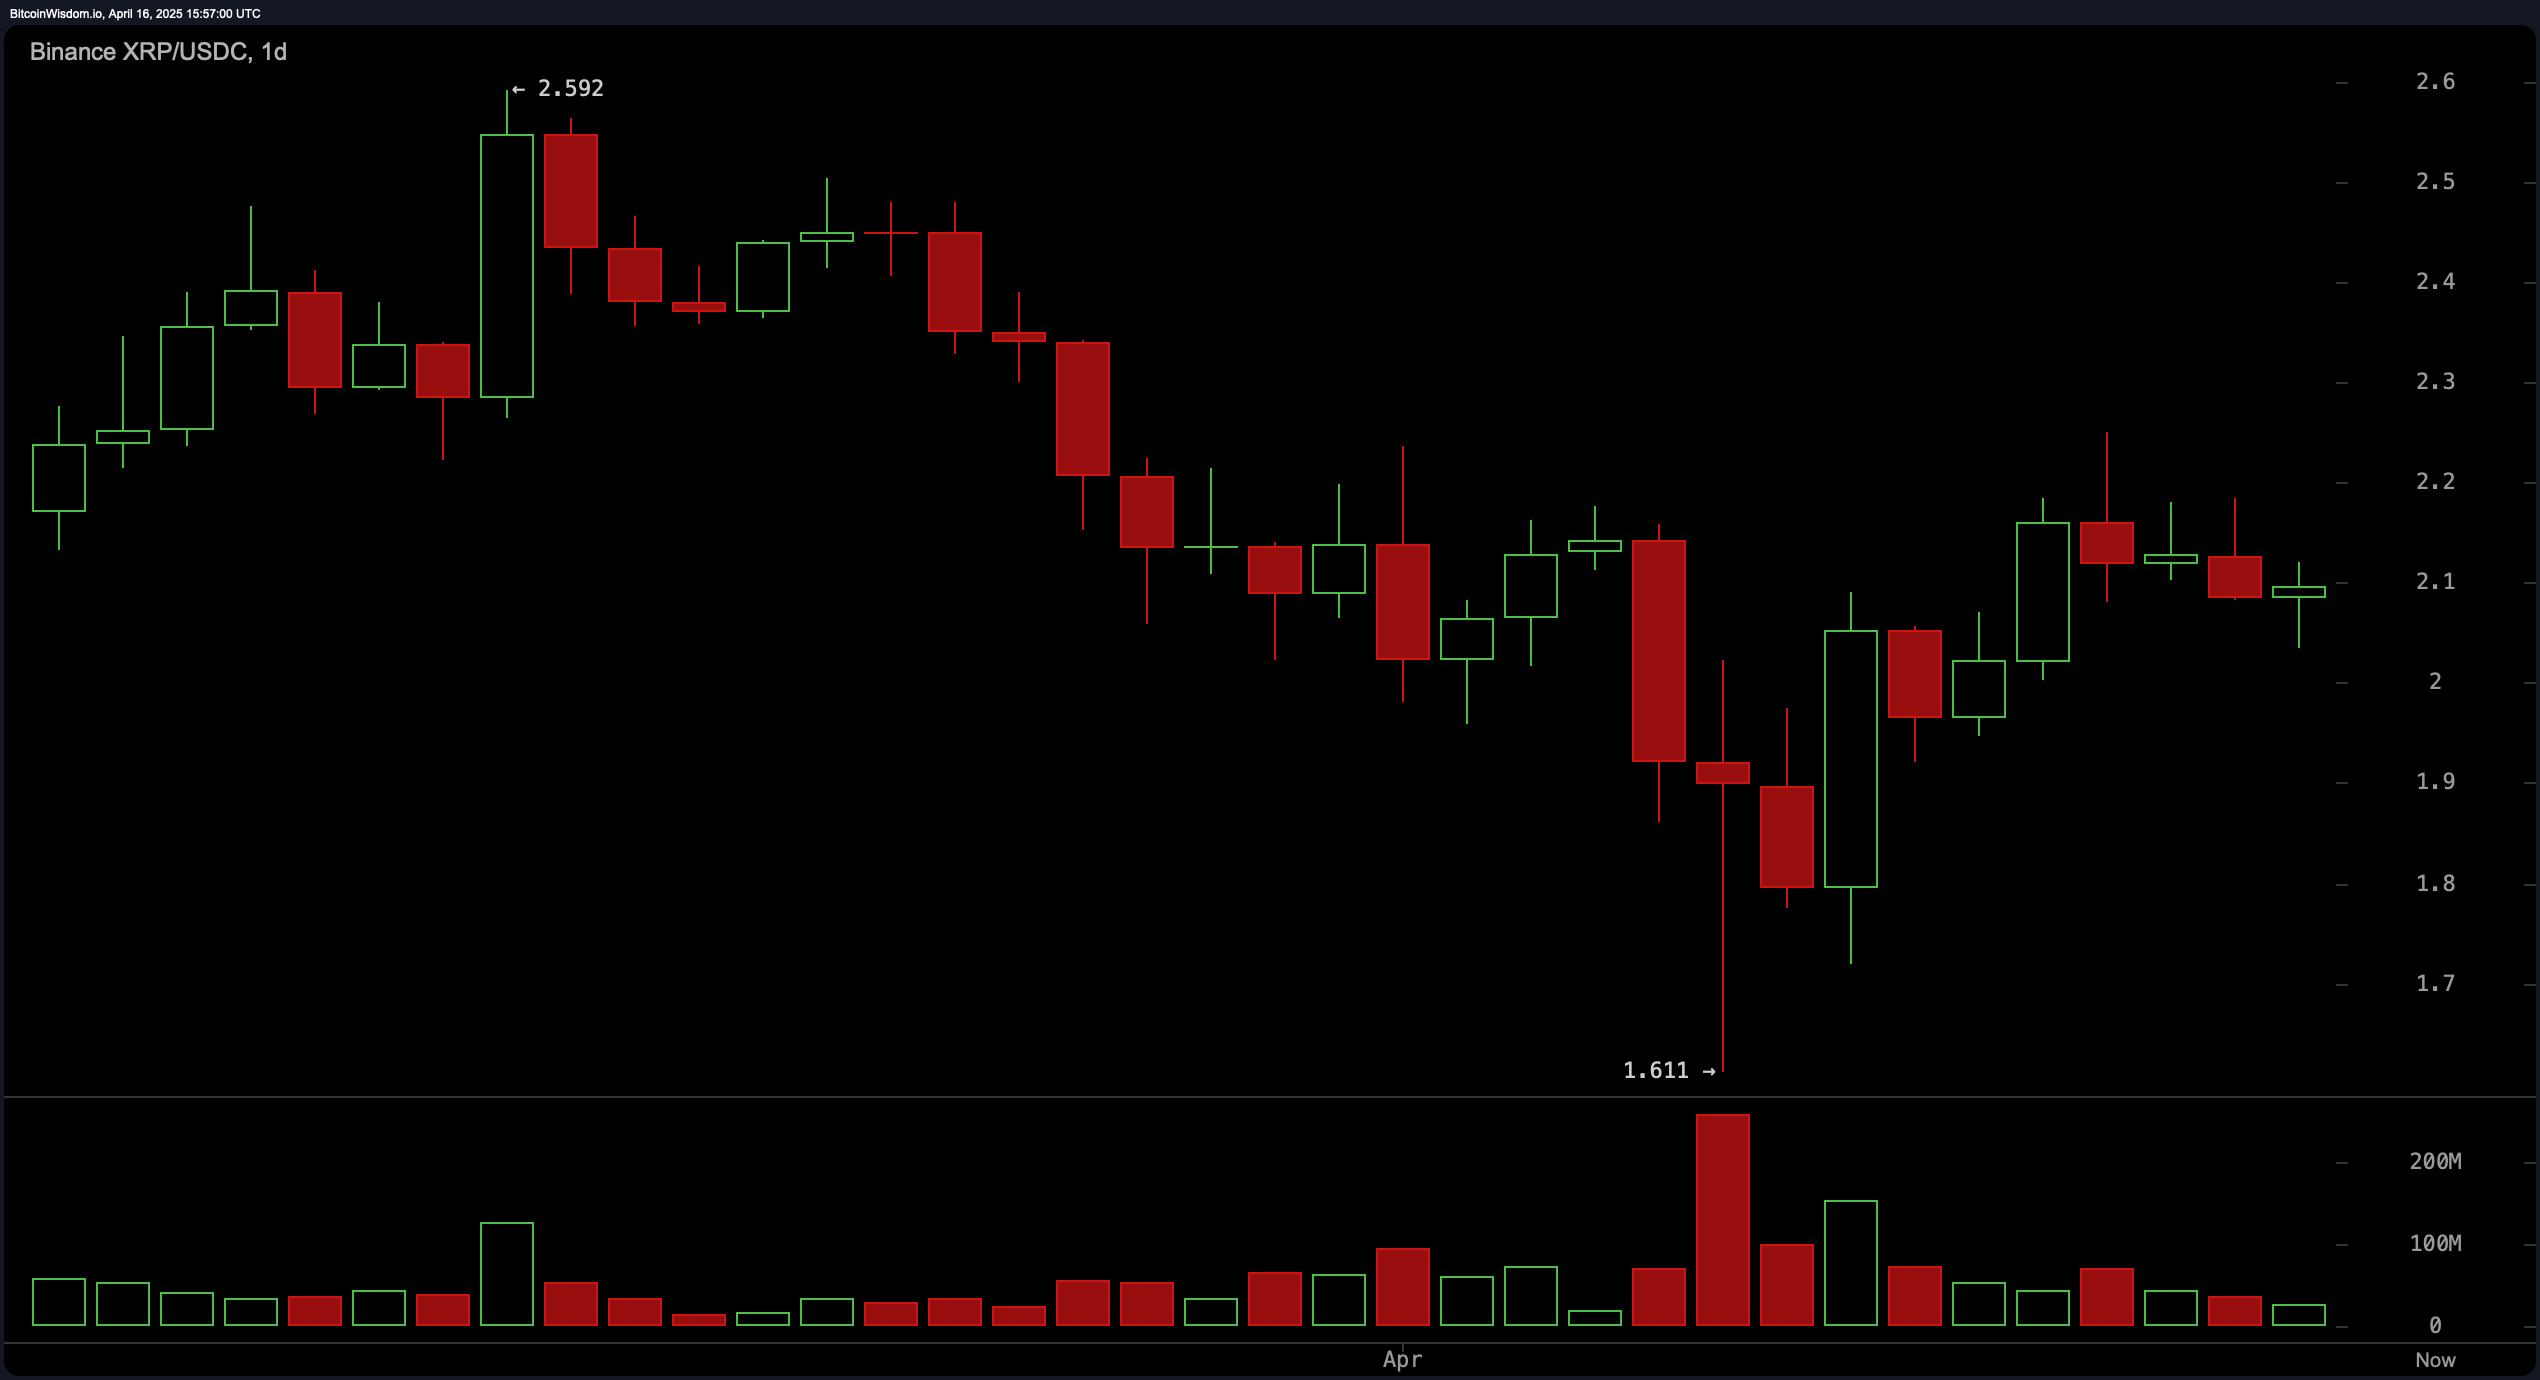
The daily chart reveals a medium-term downtrend from a peak of $2.592 to a low of $1.611, marked by a high-volume capitulation candle. The subsequent recovery to $2.10 and consolidation near the moving average (MA) support hints at accumulation. A breakout above $2.20 could validate a bullish reversal, targeting $2.30–$2.40. Swing traders may consider entries near $2.00–$2.05, with a stop loss below $1.90 to protect against downside volatility.

XRP/USDC via Binance on April 16, 2025. Daily chart.
Key oscillators present a neutral-to-cautiously-bullish stance. The relative strength index (RSI) at 47.98 and stochastic at 77.35 remain neutral, while momentum (0.17) and moving average convergence divergence (MACD) (-0.05296) signal buys. However, the awesome oscillator (-0.07663) and commodity channel index (14.60) reflect indecision. This divergence underscores a market balancing recovery hopes against lingering bearish pressure.
Shorter-term moving averages show mixed bias: the exponential moving average (EMA) (10) at $2.08 and simple moving average (SMA) (10) at $2.03 signal buys, while EMA (20) at $2.11 and SMA (30) at $2.18 indicate sells. Longer-term SMAs (200) at $1.91 and EMA (200) at $1.96 reinforce bullish support, contrasting with bearish signals from SMA (100) ($2.48) and EMA (50) ($2.22). Traders must weigh these conflicting cues against price action for clarity.
Bull Verdict:
XRP shows promising signs of a bullish reversal, particularly on the daily chart, where a recovery from the $1.61 capitulation low suggests accumulation. Short-term momentum is strengthening, with the 1-hour chart forming a double-bottom near $2.035 and the 4-hour chart eyeing a breakout above $2.16. Key moving averages (EMA 10, SMA 10, and SMA/EMA 200) support upside potential, while the MACD and Momentum indicators signal buy opportunities. A decisive close above $2.20 could confirm a rally toward $2.30–$2.40.
Bear Verdict:
Despite the rebound, XRP remains trapped in a broader downtrend, with resistance at $2.20–$2.40 posing a major hurdle. Most oscillators (RSI, Stochastic, CCI) are neutral, reflecting indecision, while longer-term moving averages (EMA 50, SMA 100) suggest lingering bearish pressure. Failure to hold $2.05 support risks a retest of $1.90 or lower, especially if Bitcoin or macro conditions weaken. Until XRP reclaims $2.40, the bears retain control.
Final Take:
Traders should watch $2.05–$2.20 for confirmation—breakouts favor bulls, while rejection signals another leg down.
免责声明:本文章仅代表作者个人观点,不代表本平台的立场和观点。本文章仅供信息分享,不构成对任何人的任何投资建议。用户与作者之间的任何争议,与本平台无关。如网页中刊载的文章或图片涉及侵权,请提供相关的权利证明和身份证明发送邮件到support@aicoin.com,本平台相关工作人员将会进行核查。


