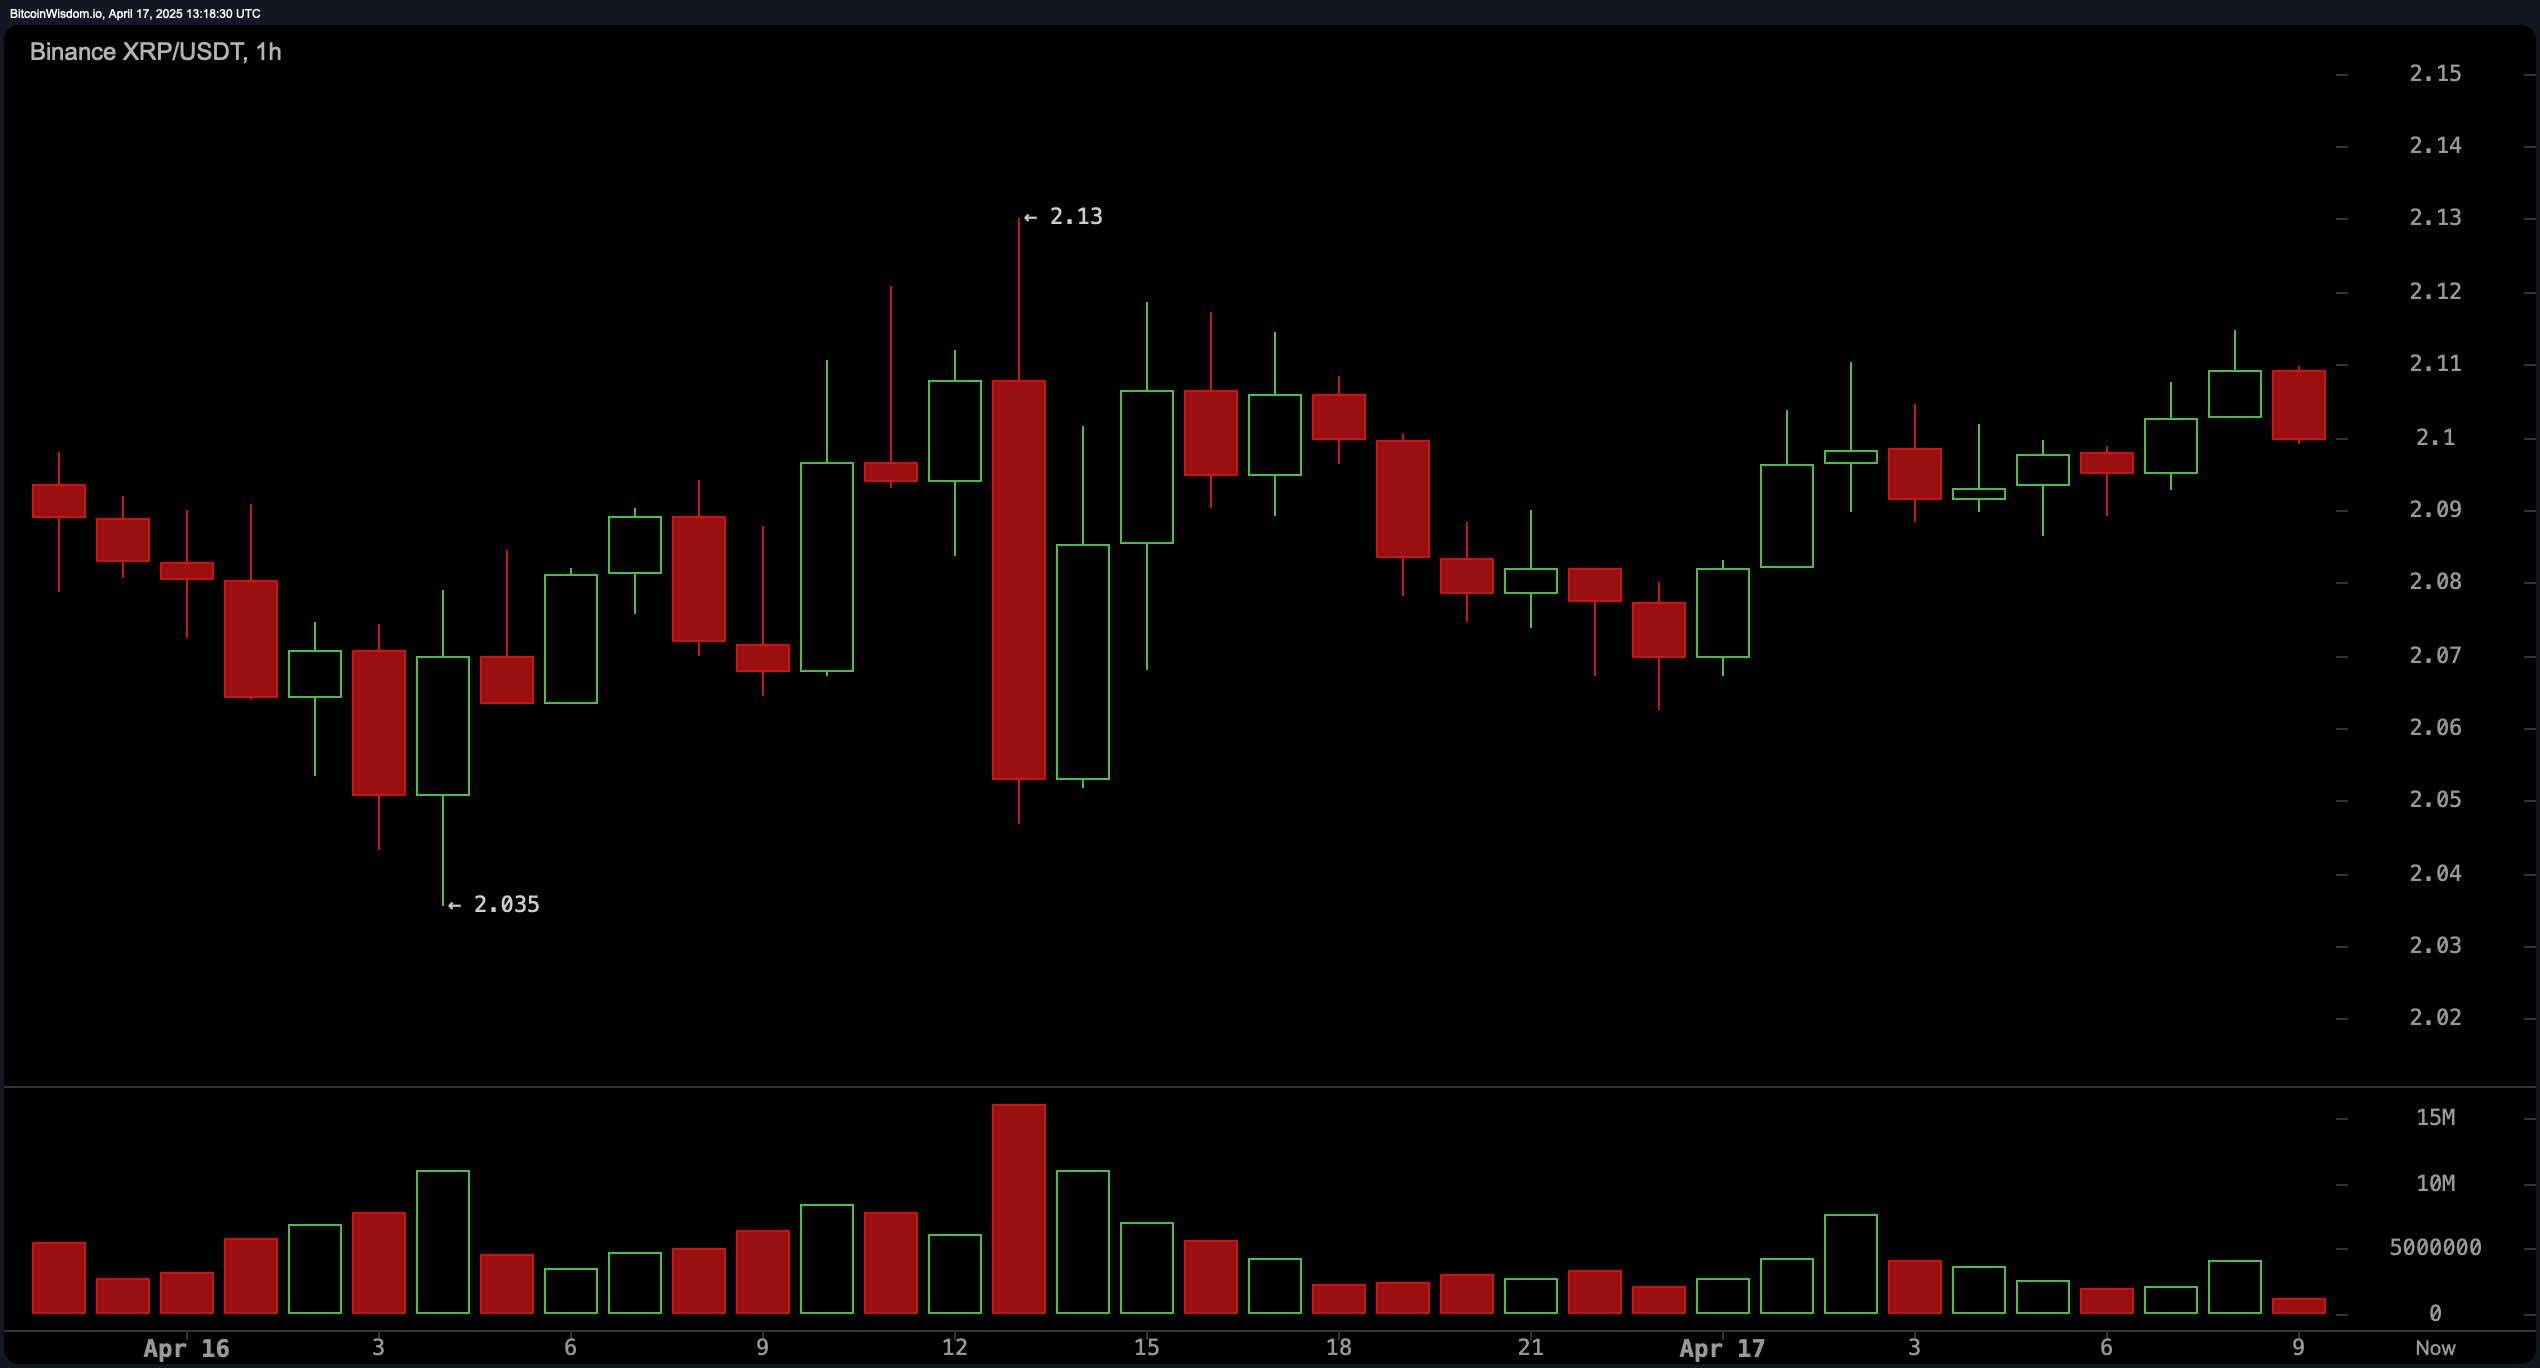
In the one‑hour view, XRP continues to unwind a compact wedge that has printed progressively higher lows from the $2.035 trough while failing to vault the $2.13 ceiling. Compressed volume and shrinking candle bodies underscore an imminent expansion; bulls appear willing to defend $2.09, yet sellers reliably cap every spike toward the mid‑$2.10s. A convincing hourly close above $2.13 would likely invite momentum buying toward $2.20, whereas a slip beneath $2.06 risks spilling the token back to the psychological $2 handle.

XRP/ USDT via Binance on April 17, 2025. 1 hour chart.
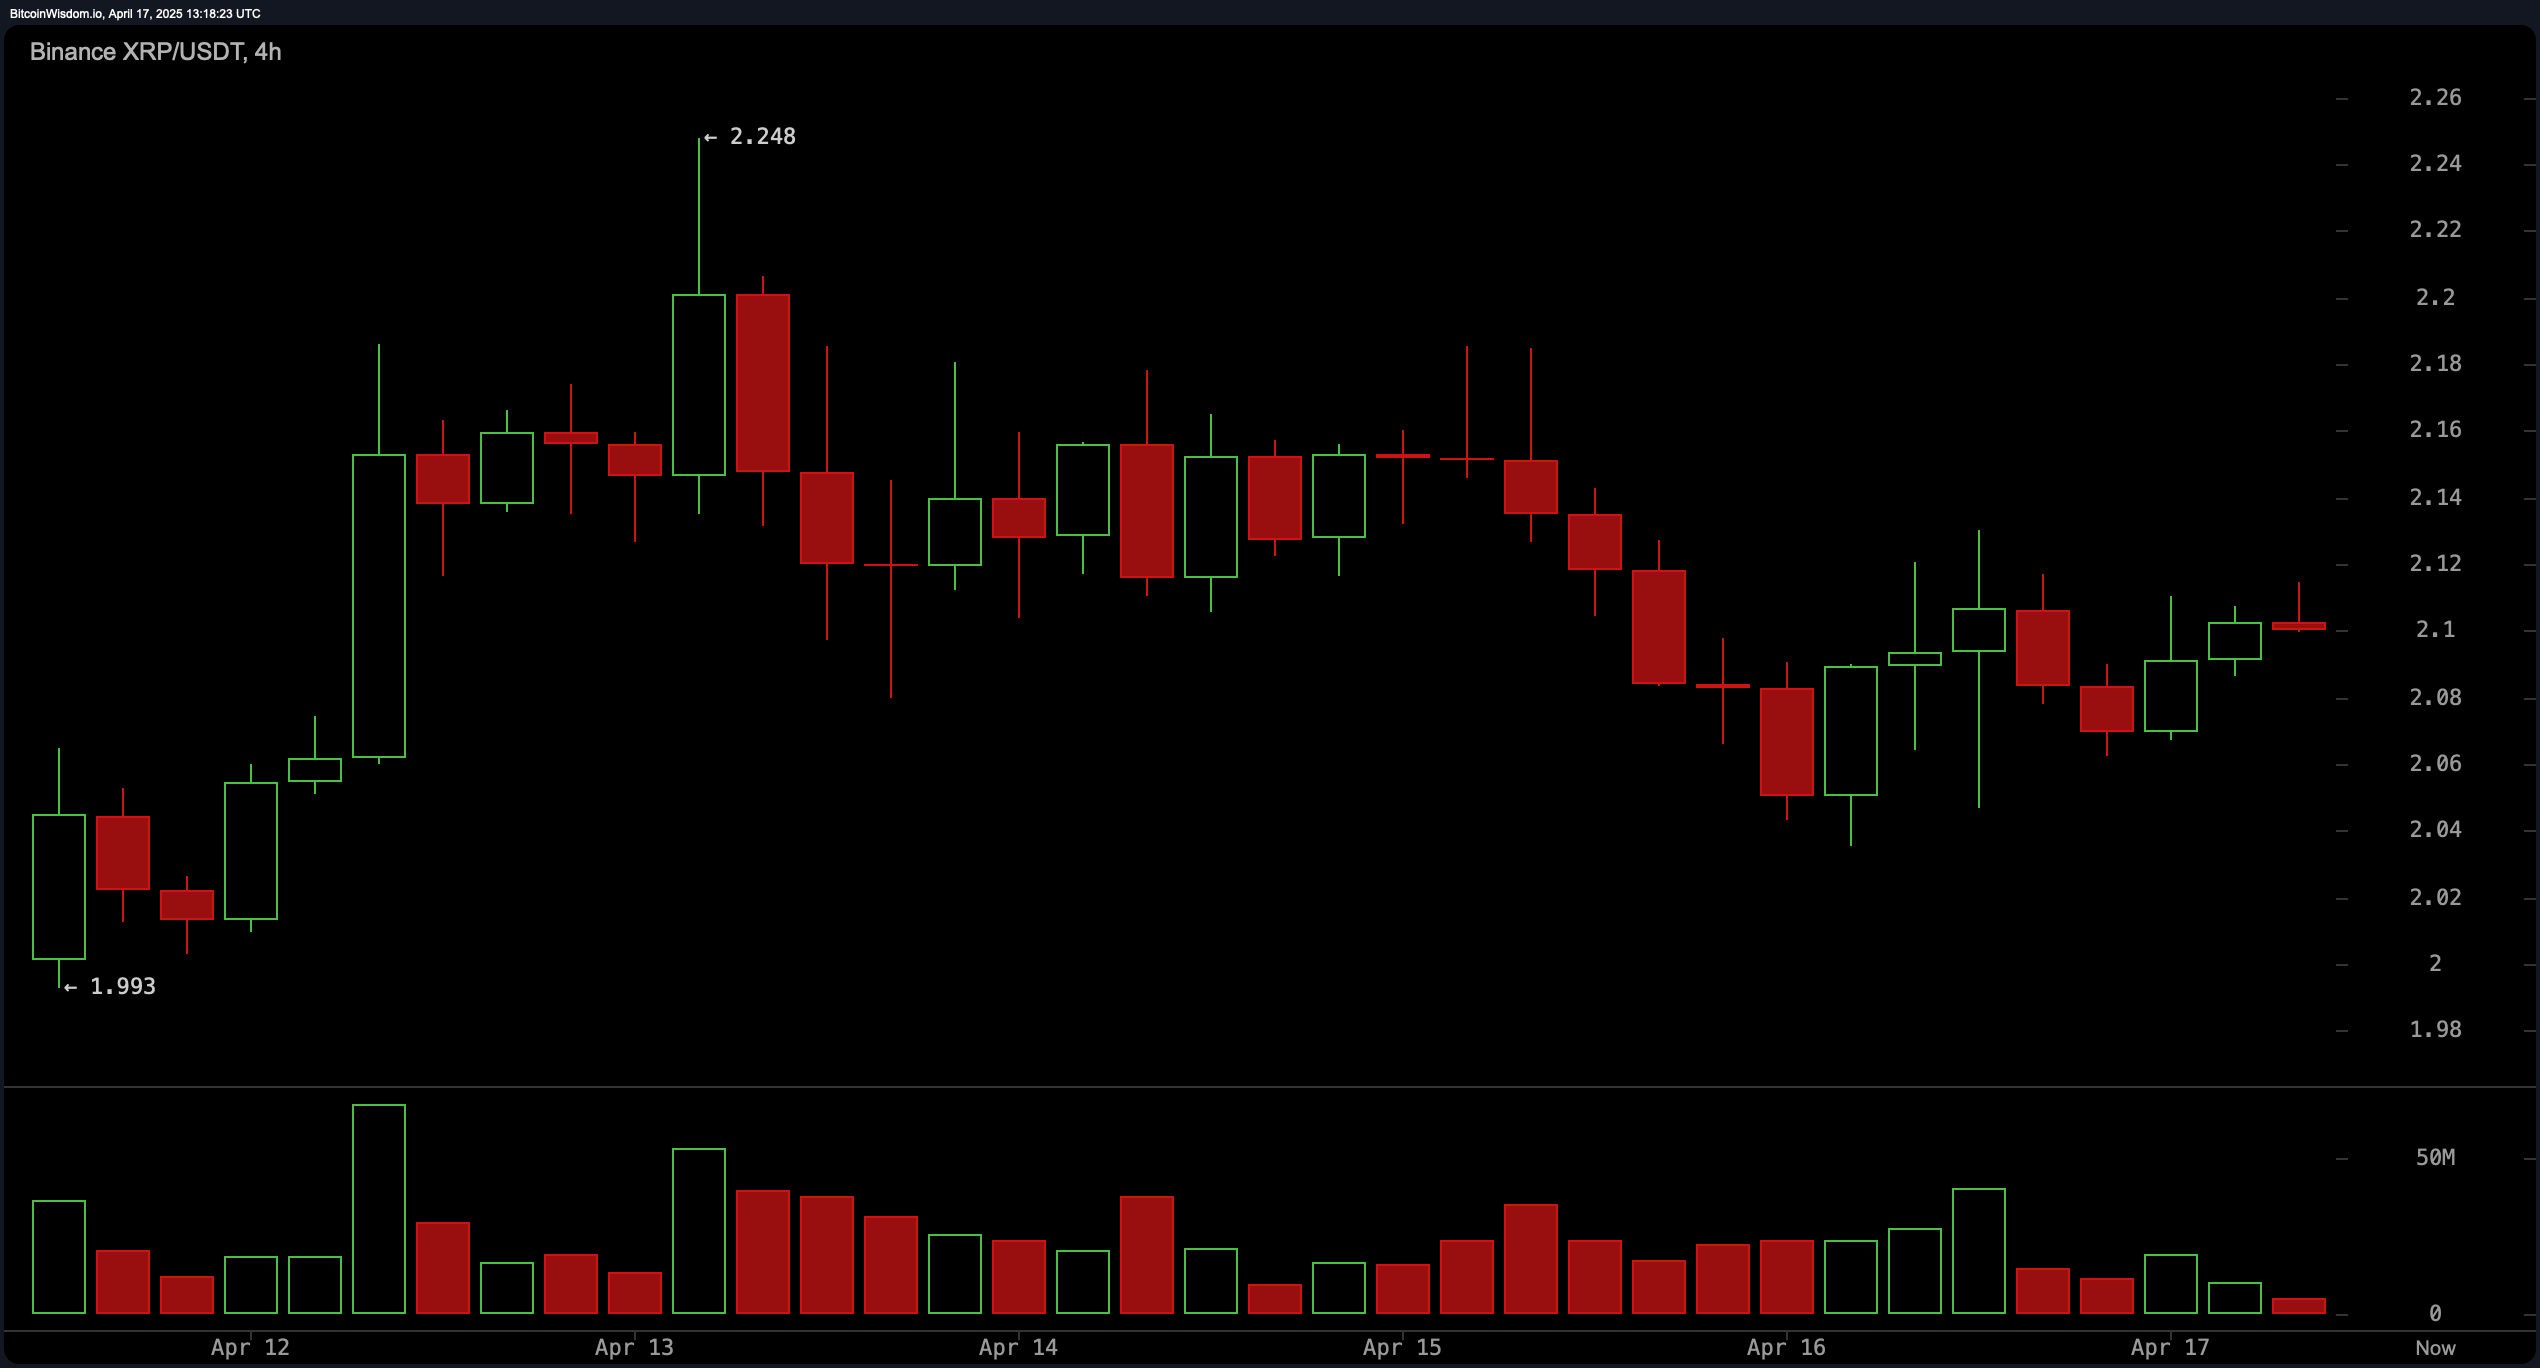
The four‑hour chart shows a gentle descending channel stretching from the April 14 swing high at $2.24 to current levels. Price continues to recycle between $2 and $2.10 as falling top‑side trend‑line pressure tempers each rally. Notably, successive pullbacks into the $1.99–$2.00 zone attract steady bid flow, hinting at accumulation by patient participants positioning for an upside break. Should XRP pierce $2.15 on convincing volume, the next confluence resistance emerges near $2.20–$2.22; failure to hold $1.98 would invalidate the constructive channel bias.

XRP/ USDT via Binance on April 17, 2025. 4 hour chart.
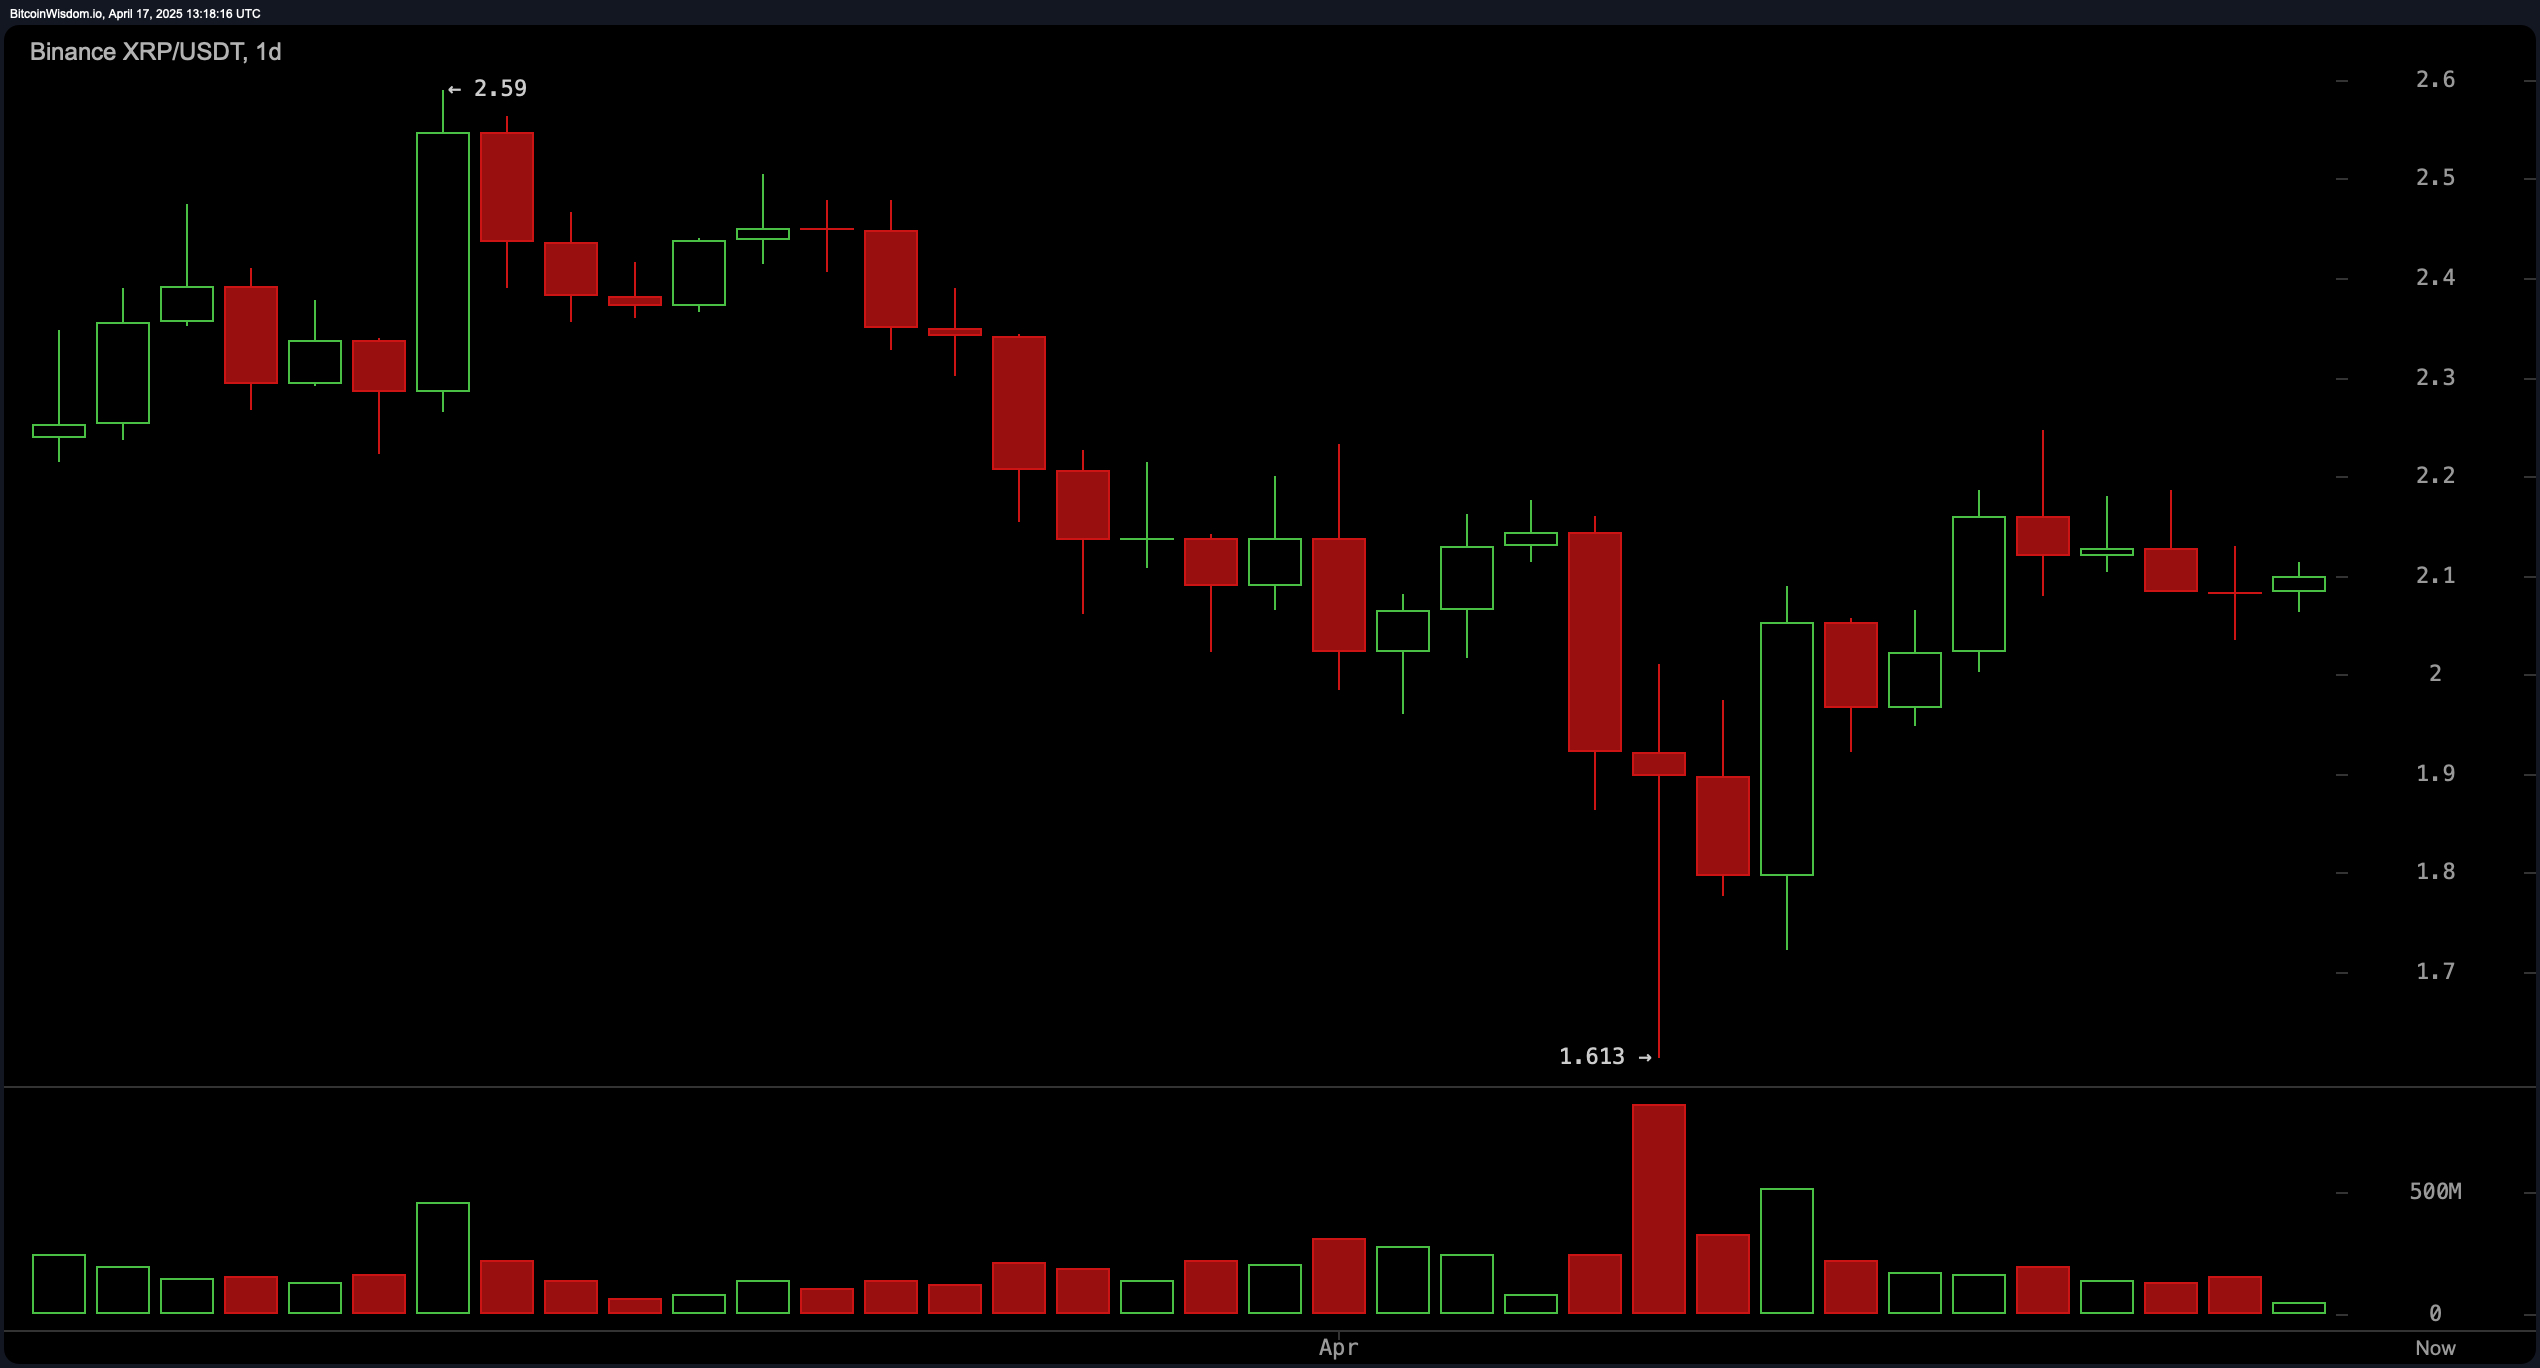
On the daily timeframe, April’s earlier washout to $1.61 looks increasingly like capitulation, with higher lows now marching price toward the pivotal $2.20–$2.25 supply shelf. Volume on advances exceeds that of declines, and the candle structure suggests bulls are testing the resilience of trend‑line sellers from the late‑March peak of $2.59. A daily close north of $2.25 would confirm a mild trend change and point to the untouched $2.40–$2.45 cluster, while a rejection would keep the broader range‑bound profile intact.

XRP/ USDT via Binance on April 17, 2025. Daily chart.
Oscillator readings support the wait‑and‑see stance. The relative strength index (RSI) hovers at 48.3, reflecting neither exhaustion nor deep discount. The Stochastic oscillator holds near 75, signaling fading short‑term overbuying without yet tipping bearish. Meanwhile, the commodity channel index (CCI) at 29 and the average directional index (ADX) at 21 indicate modest momentum and a maturing trend. The awesome oscillator’s marginal negative histogram, coupled with a positive momentum print, paints a mixed picture, while the moving average convergence divergence (MACD) logs a slight bullish crossover at ‑0.048. Overall, the indicator composite leans neutral‑to‑cautiously optimistic, awaiting a definitive price catalyst.
Moving‑average (MA) signals highlight the market’s short‑term tilt toward buyers but emphasize stiff overhead friction. The 10‑period exponential moving average (EMA) at $2.079 and the 10‑period simple moving average (SMA) at $2.051 flash bullish cues, yet the 20‑period EMA at $2.104 already flips to bearish, highlighting nearby resistance. Longer baselines reinforce that narrative: the 30‑, 50‑ and 100‑period EMAs and SMAs all sit above spot and flash sell, while the 200‑period EMA at $1.959 and 200‑period SMA at $1.919 remain supportive. Taken together, XRP’s compressed range atop rising long‑term floors favors a breakout scenario, but traders require a decisive settlement beyond short‑term averages to unlock momentum.
Bull Verdict:
A decisive hourly break above $2.13 paired with a daily settlement beyond $2.25 would likely trigger follow‑through buying toward $2.40, confirming short‑term bullish control and extending the climb built on April’s capitulation low.
Bear Verdict:
A drop below $2.06 that closes the day under $2.00 would tip momentum to sellers, exposing the $1.95 safety net and reopening the path toward the spring trough near $1.61.
免责声明:本文章仅代表作者个人观点,不代表本平台的立场和观点。本文章仅供信息分享,不构成对任何人的任何投资建议。用户与作者之间的任何争议,与本平台无关。如网页中刊载的文章或图片涉及侵权,请提供相关的权利证明和身份证明发送邮件到support@aicoin.com,本平台相关工作人员将会进行核查。


