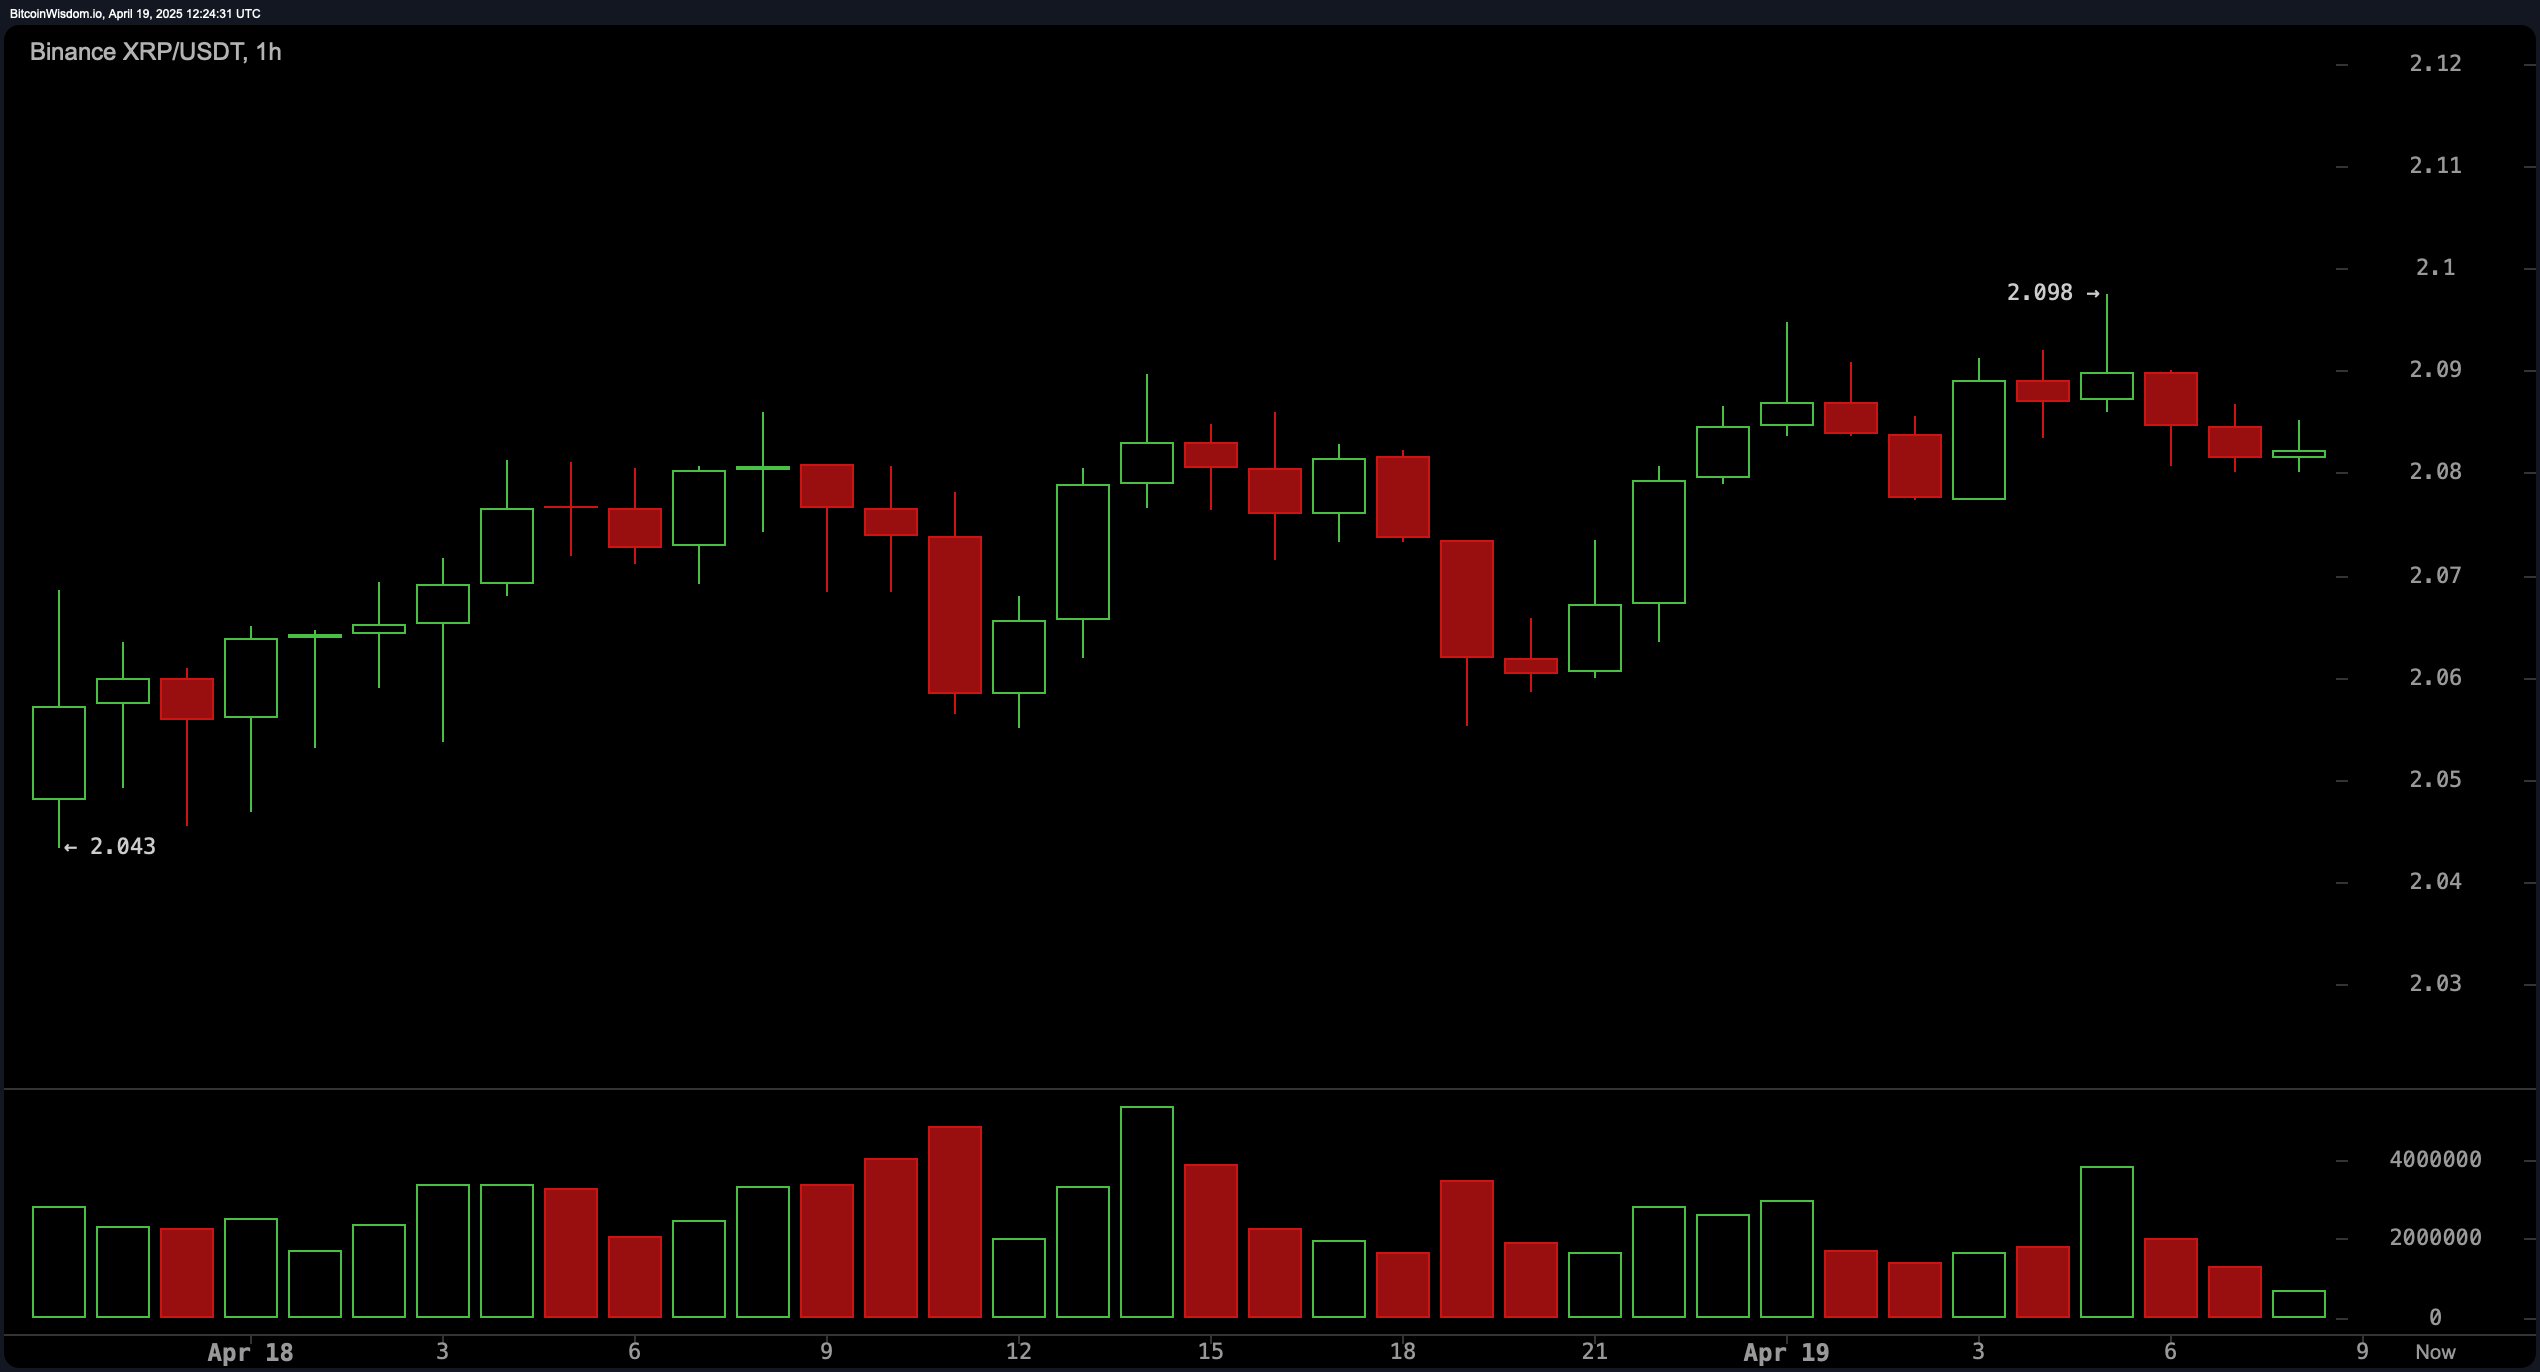
On the 1-hour chart, XRP opened the session near $2.043 and moved steadily higher, peaking at $2.098 before pulling back slightly toward $2.08 by the end of the observed period. The price action formed a gentle arc upward, suggesting mild bullish pressure. However, the overall pattern reveals a sequence of lower highs post-peak, and red candles dominated the latter part of the timeframe. Volume peaked mid-session and then sharply declined, showing weakening buyer interest. With this setup, the market appears indecisive in the short term, and further bullish confirmation is needed before new entries are justified.

Binance XRP/ USDT 1H chart on Saturday, April 19, 2025, at 8:30 a.m. Eastern time.
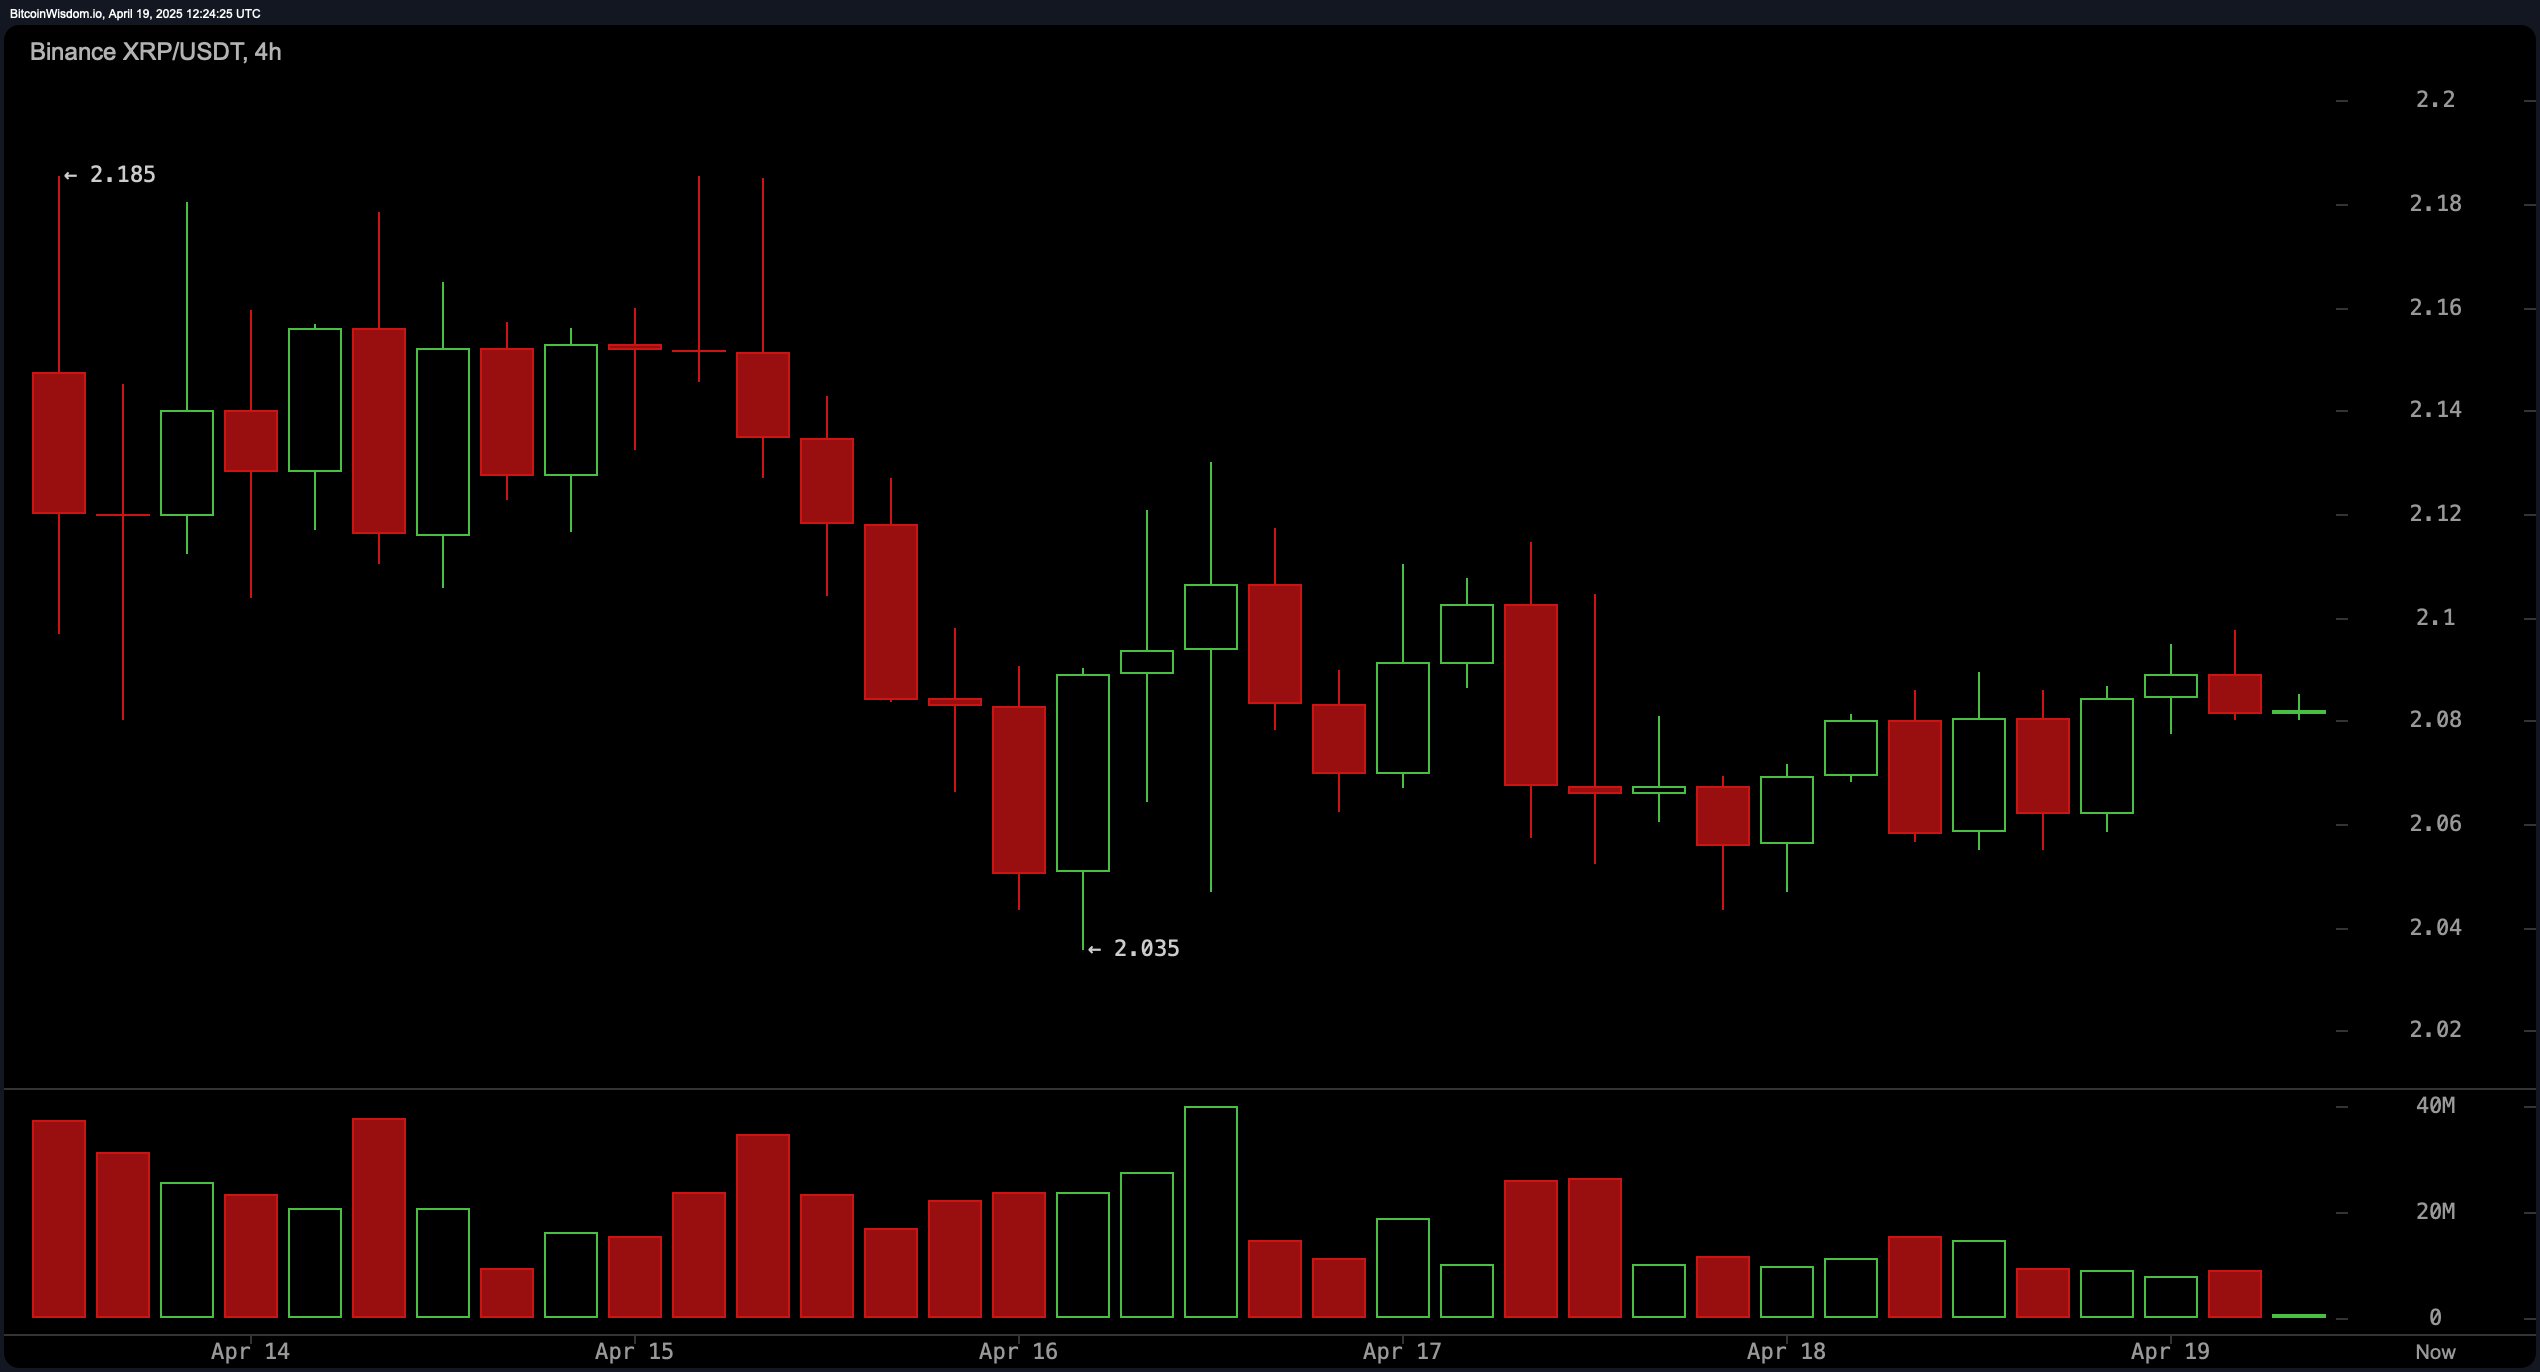
The 4-hour chart shows XRP facing repeated rejections near $2.10, with a prominent local high marked at $2.185 and support near $2.035. The asset has been oscillating in a broadening formation, indicating elevated volatility and a lack of clear directional bias. Candle wicks above and below the real bodies show indecision, and the frequency of alternating red and green candles suggests a battle between bulls and bears. Although XRP is holding above its recent low, volume has tapered off considerably, which could limit any near-term upside unless renewed momentum returns. The technical picture here leans neutral with a slightly bearish undertone unless price breaks decisively above $2.10.

Binance XRP/ USDT 4H chart on Saturday, April 19, 2025, at 8:30 a.m. Eastern time.
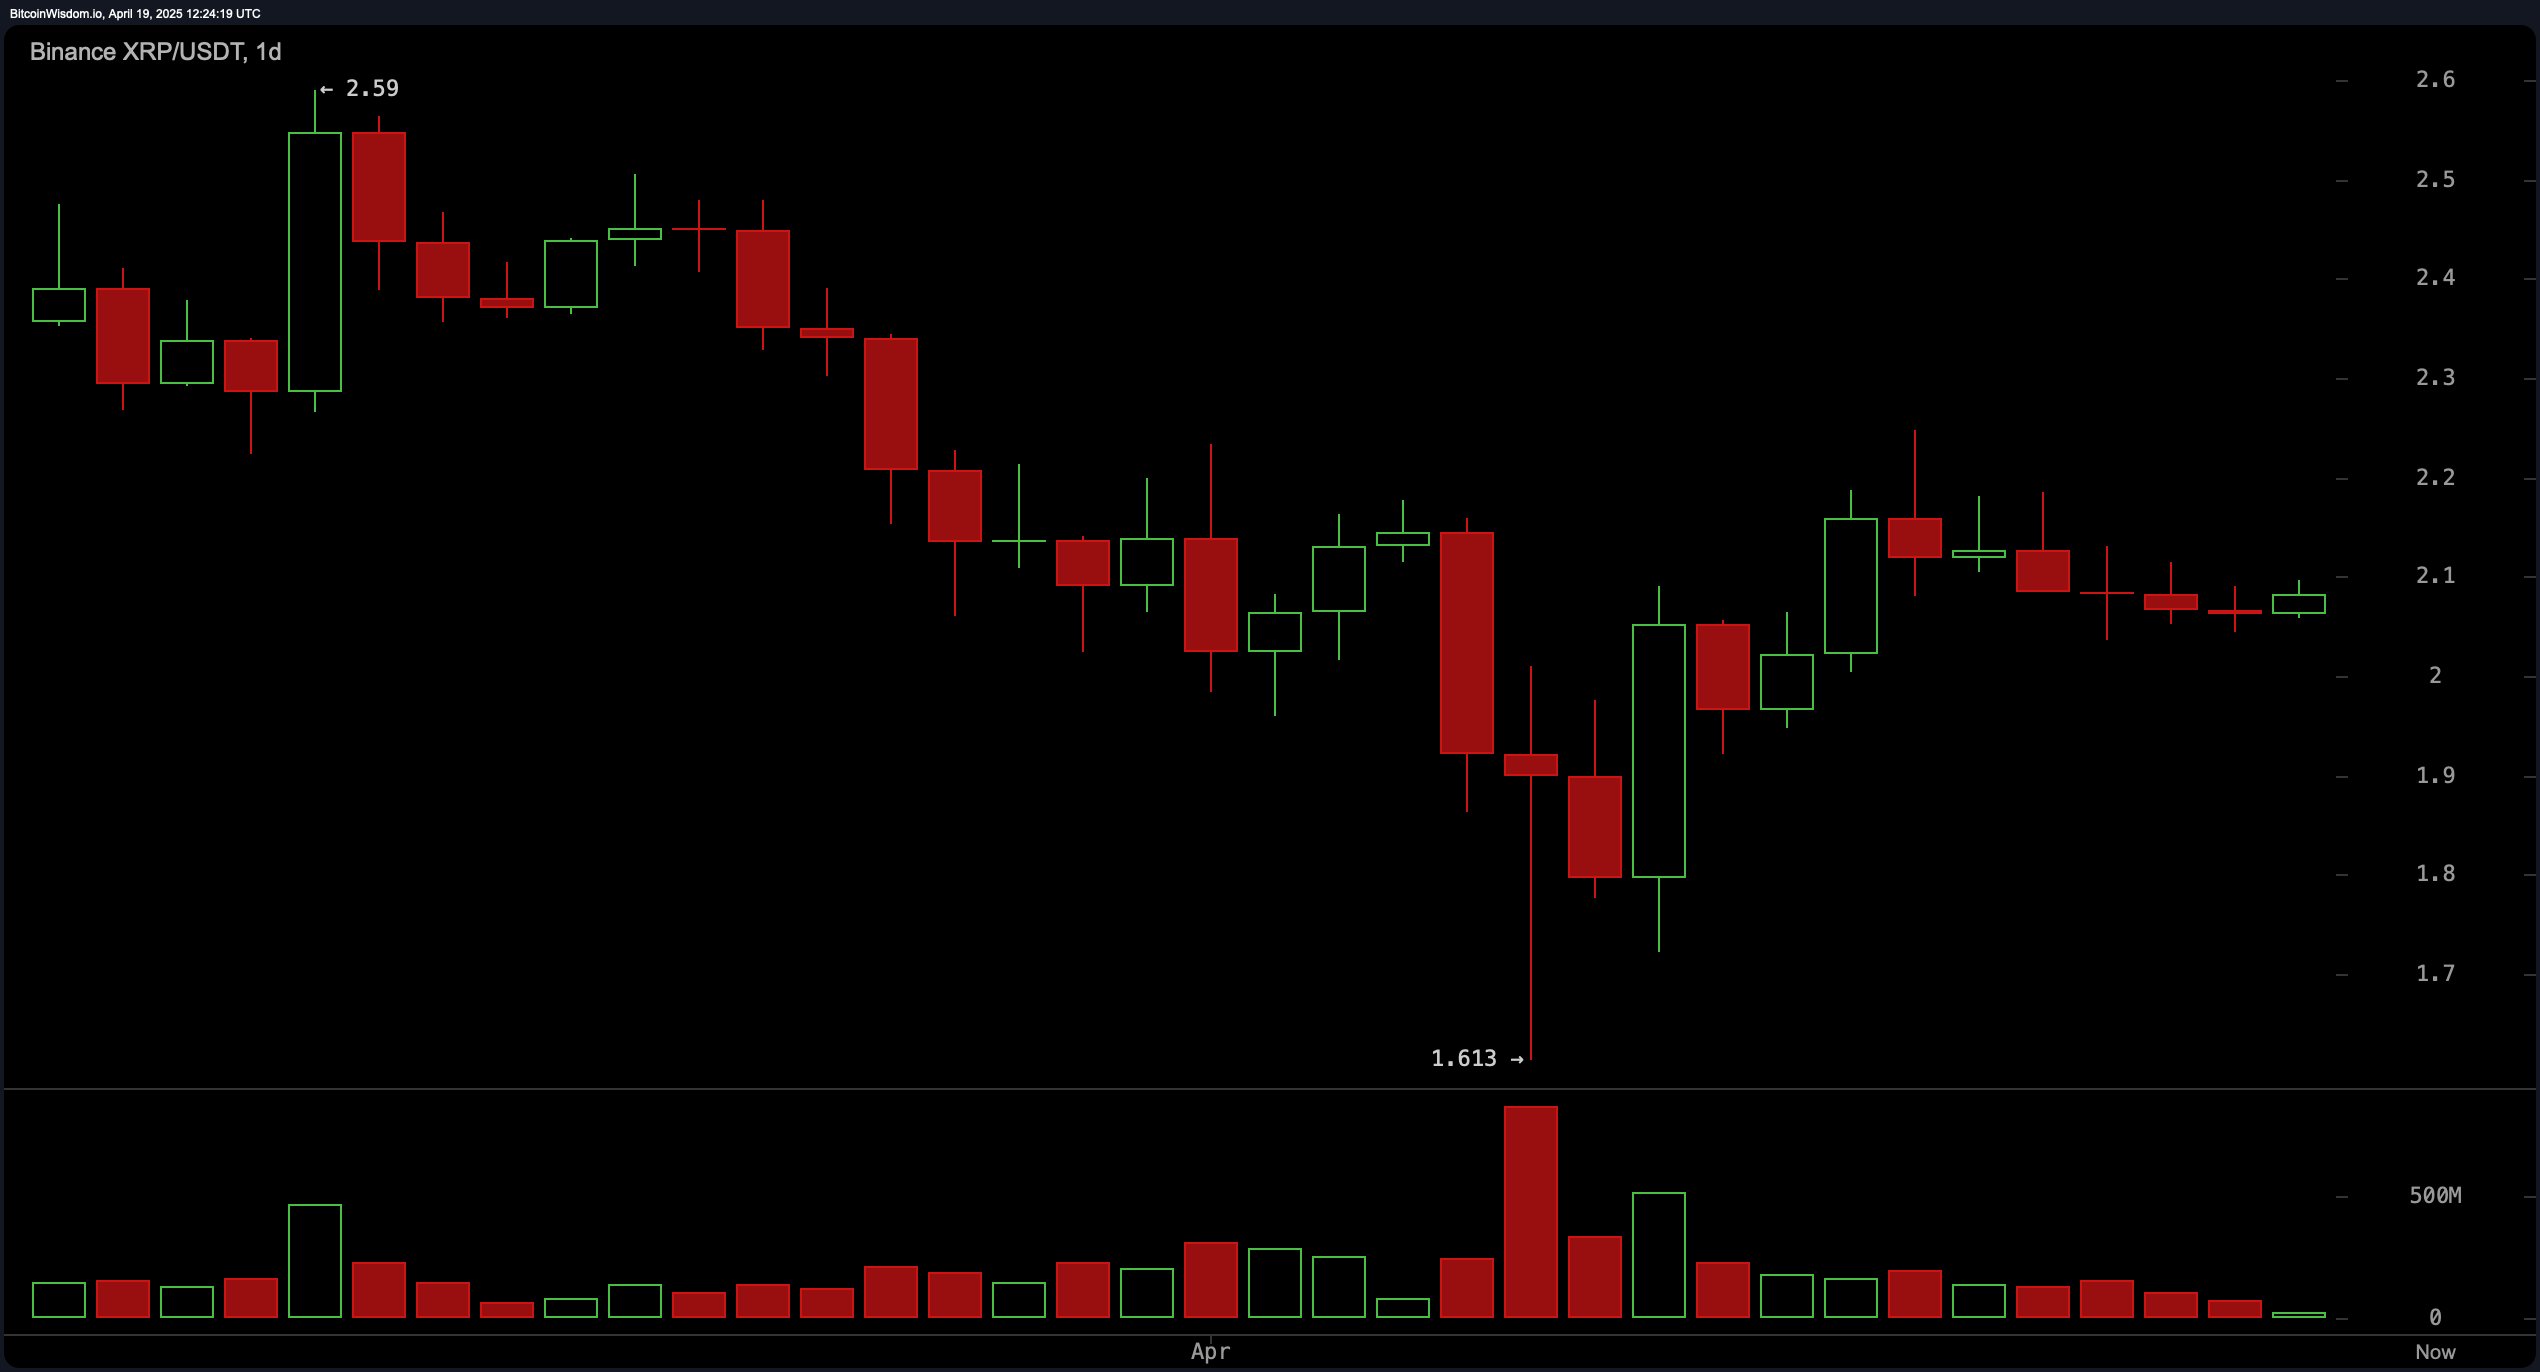
On the daily chart, XRP is still emerging from a sharp V-shaped recovery, bouncing strongly from a low of $1.613 after an aggressive sell-off. The highest candle of the observed period reached $2.59 before retreating, and recent sessions have shown the asset stabilizing near the $2.08 level. Volume during the drop and subsequent rebound was significantly elevated, signaling strong participation, but the last several candles have relatively small bodies and lower volumes. This consolidation pattern suggests the market is catching its breath after the recovery and may be coiling for its next move. Traders should monitor for a breakout above $2.10 or a breakdown below $2.00 for directional cues.

Binance XRP/ USDT 1D chart on Saturday, April 19, 2025, at 8:30 a.m. Eastern time.
Momentum gauges currently hover in neutral territory. The relative strength index (RSI) registers 47.53, the Stochastic oscillator 72.30, and the commodity channel index 26.84—each midrange. An average directional index reading of 21.08 signals a weak trend, while the Awesome oscillator sits at −0.08575, reinforcing the lack of decisive direction. Meanwhile, the momentum oscillator flashes sell at 0.03029 even as the moving average convergence divergence (MACD) prints a buy cue at −0.04377.
Moving averages tell a tale of indecision across time horizons. Ten‑period exponential and simple moving averages flash optimism at $2.07310 and $2.07709, respectively. Yet the EMA (20) at $2.09532 and EMA (30) at $2.13449 lean bearish, reflecting midrange hesitation. Notably, the 200‑period EMA and SMA—often viewed as arbiters of long‑term sentiment—remain supportive of upward continuation, resting at $1.96045 and $1.93327 and both issuing bullish signals. This split verdict highlights the ongoing technical ambiguity in XRP’s trajectory.
Bull Verdict:
XRP’s consolidation above key support levels, combined with a resilient V-shaped recovery on the daily chart and buy signals from the long-term 200-period exponential and simple moving averages, supports a cautiously optimistic outlook. If the price breaks above $2.09 with conviction and volume confirms the move, bullish traders could see a continuation toward the next resistance levels near $2.15 and beyond.
Bear Verdict:
Despite short-term buy signals, weakening momentum indicators and mid-range moving average sell signals hint at possible exhaustion. With oscillators largely neutral and the hourly chart revealing bearish divergence potential, failure to maintain support at $2.06 may trigger a retest of lower levels around $2.00 or below, favoring bearish momentum in the near term.
免责声明:本文章仅代表作者个人观点,不代表本平台的立场和观点。本文章仅供信息分享,不构成对任何人的任何投资建议。用户与作者之间的任何争议,与本平台无关。如网页中刊载的文章或图片涉及侵权,请提供相关的权利证明和身份证明发送邮件到support@aicoin.com,本平台相关工作人员将会进行核查。


