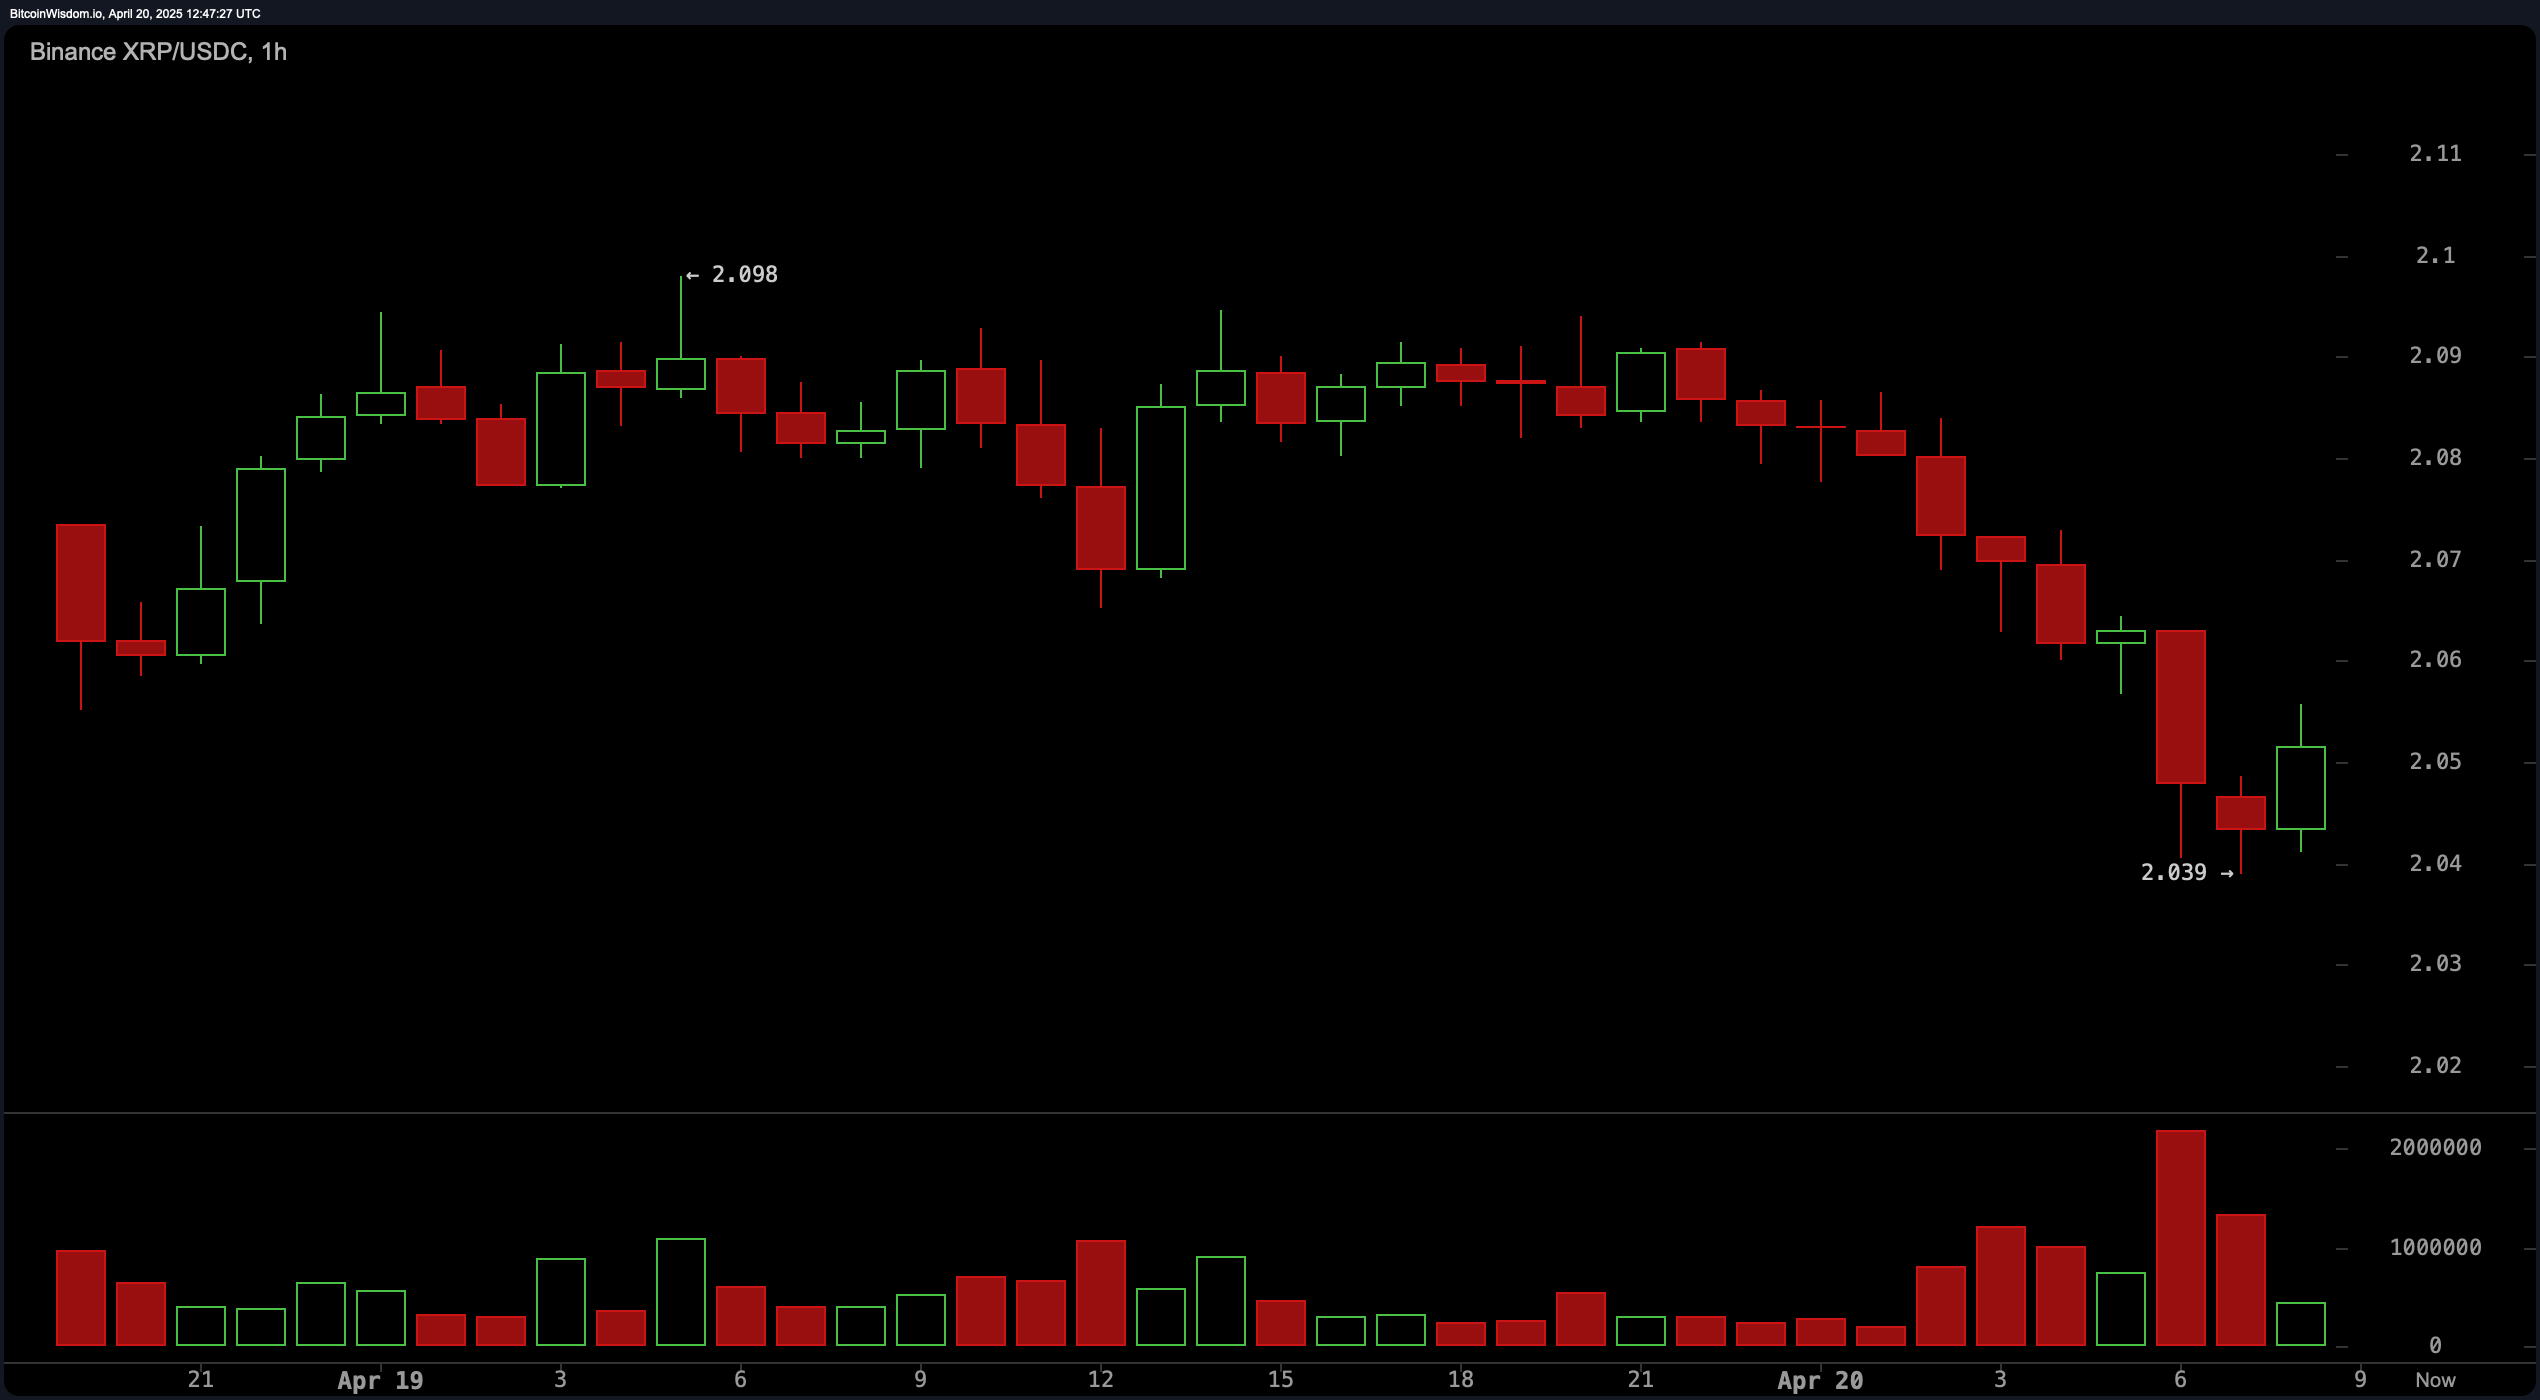
On the 1-hour chart, XRP exhibits an intraday downtrend, with the formation of lower highs and lower lows indicating persistent bearish momentum. A recent touch of the $2.039 level was followed by a slight bounce, suggesting the potential for a short-term reversal or the development of a double bottom pattern. Volume surged notably during the last few red candles, hinting at either panic selling or a short-term shakeout. If XRP confirms a higher low above $2.039, a breakout above the $2.06 level could present a viable scalping opportunity, targeting the resistance zone at $2.08–$2.09 with a tight stop loss positioned below the recent swing low.

XRP/USDC 1H chart via Binance on April 20, 2025.
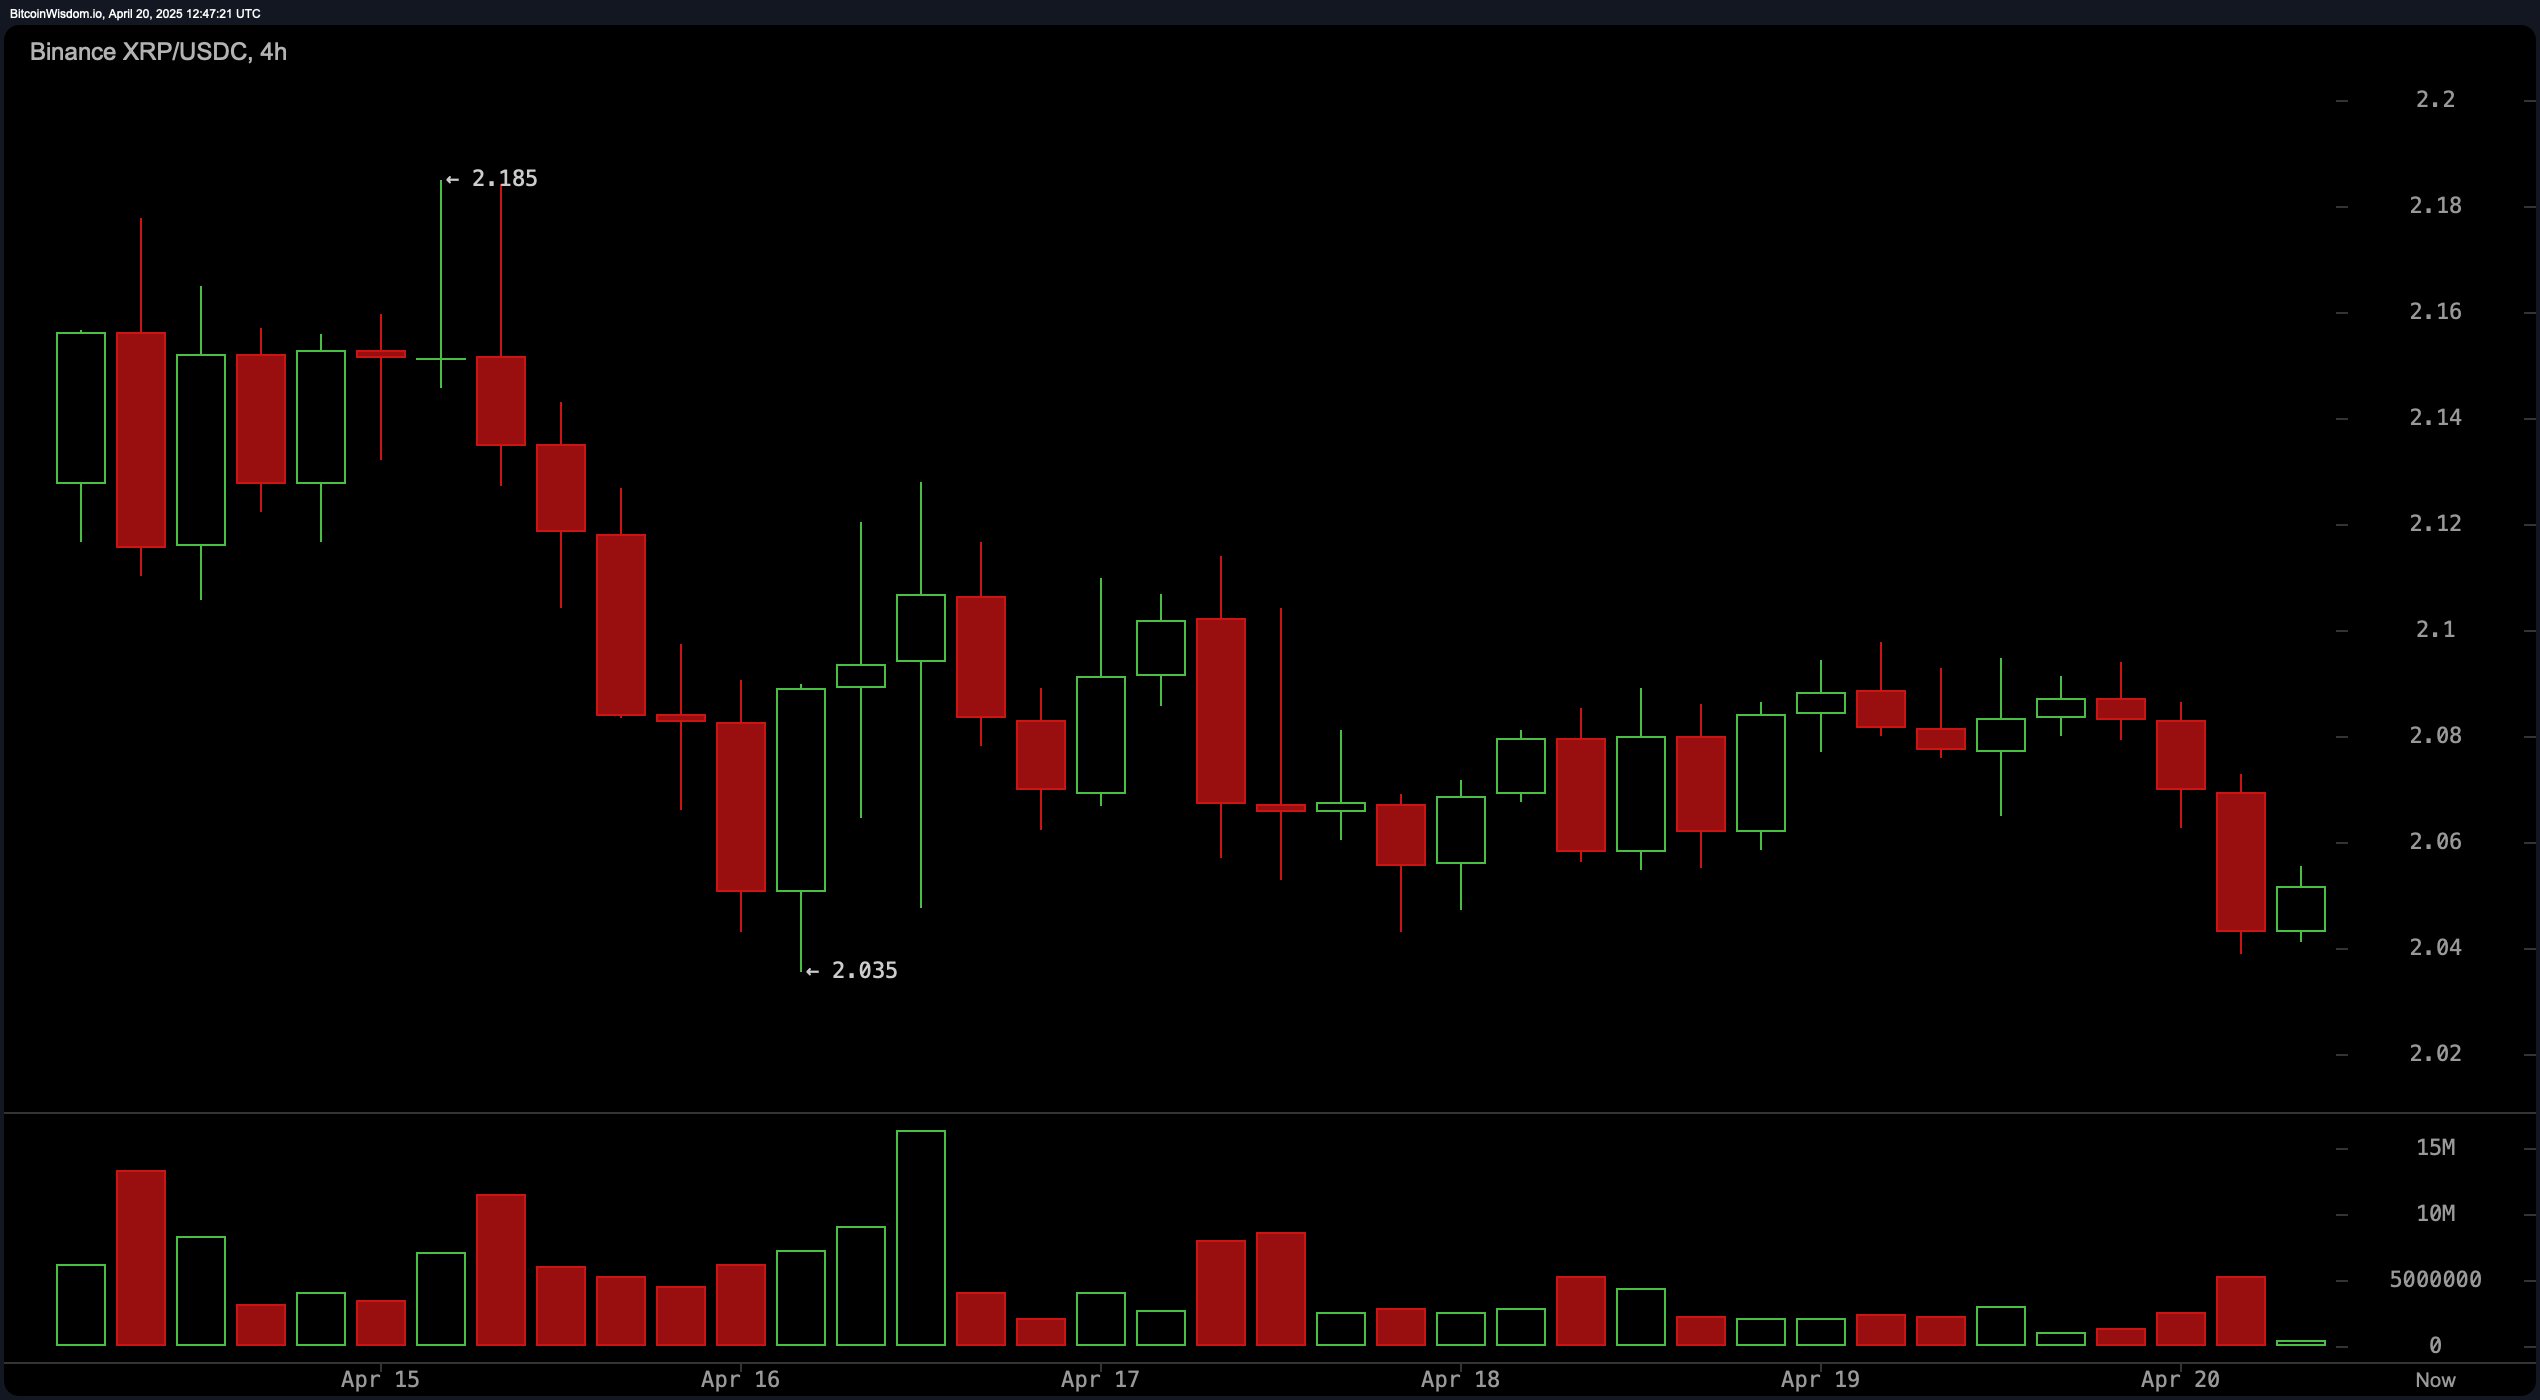
In the 4-hour timeframe, XRP continues to undergo a short-term bearish correction after failing to maintain momentum above the $2.18 mark. Price action reveals a consolidation phase between $2.03 and $2.10, with decreasing volume levels that signal a lack of significant selling pressure. This muted volume profile may indicate accumulation by market participants awaiting directional clarity. If the $2.03–$2.04 support zone holds, traders could anticipate a swing entry, particularly if supported by bullish reversal candlestick formations. Resistance near $2.10–$2.12 remains a logical level for partial profit-taking or reevaluation of trade exposure.

XRP/USDC 4H chart via Binance on April 20, 2025.
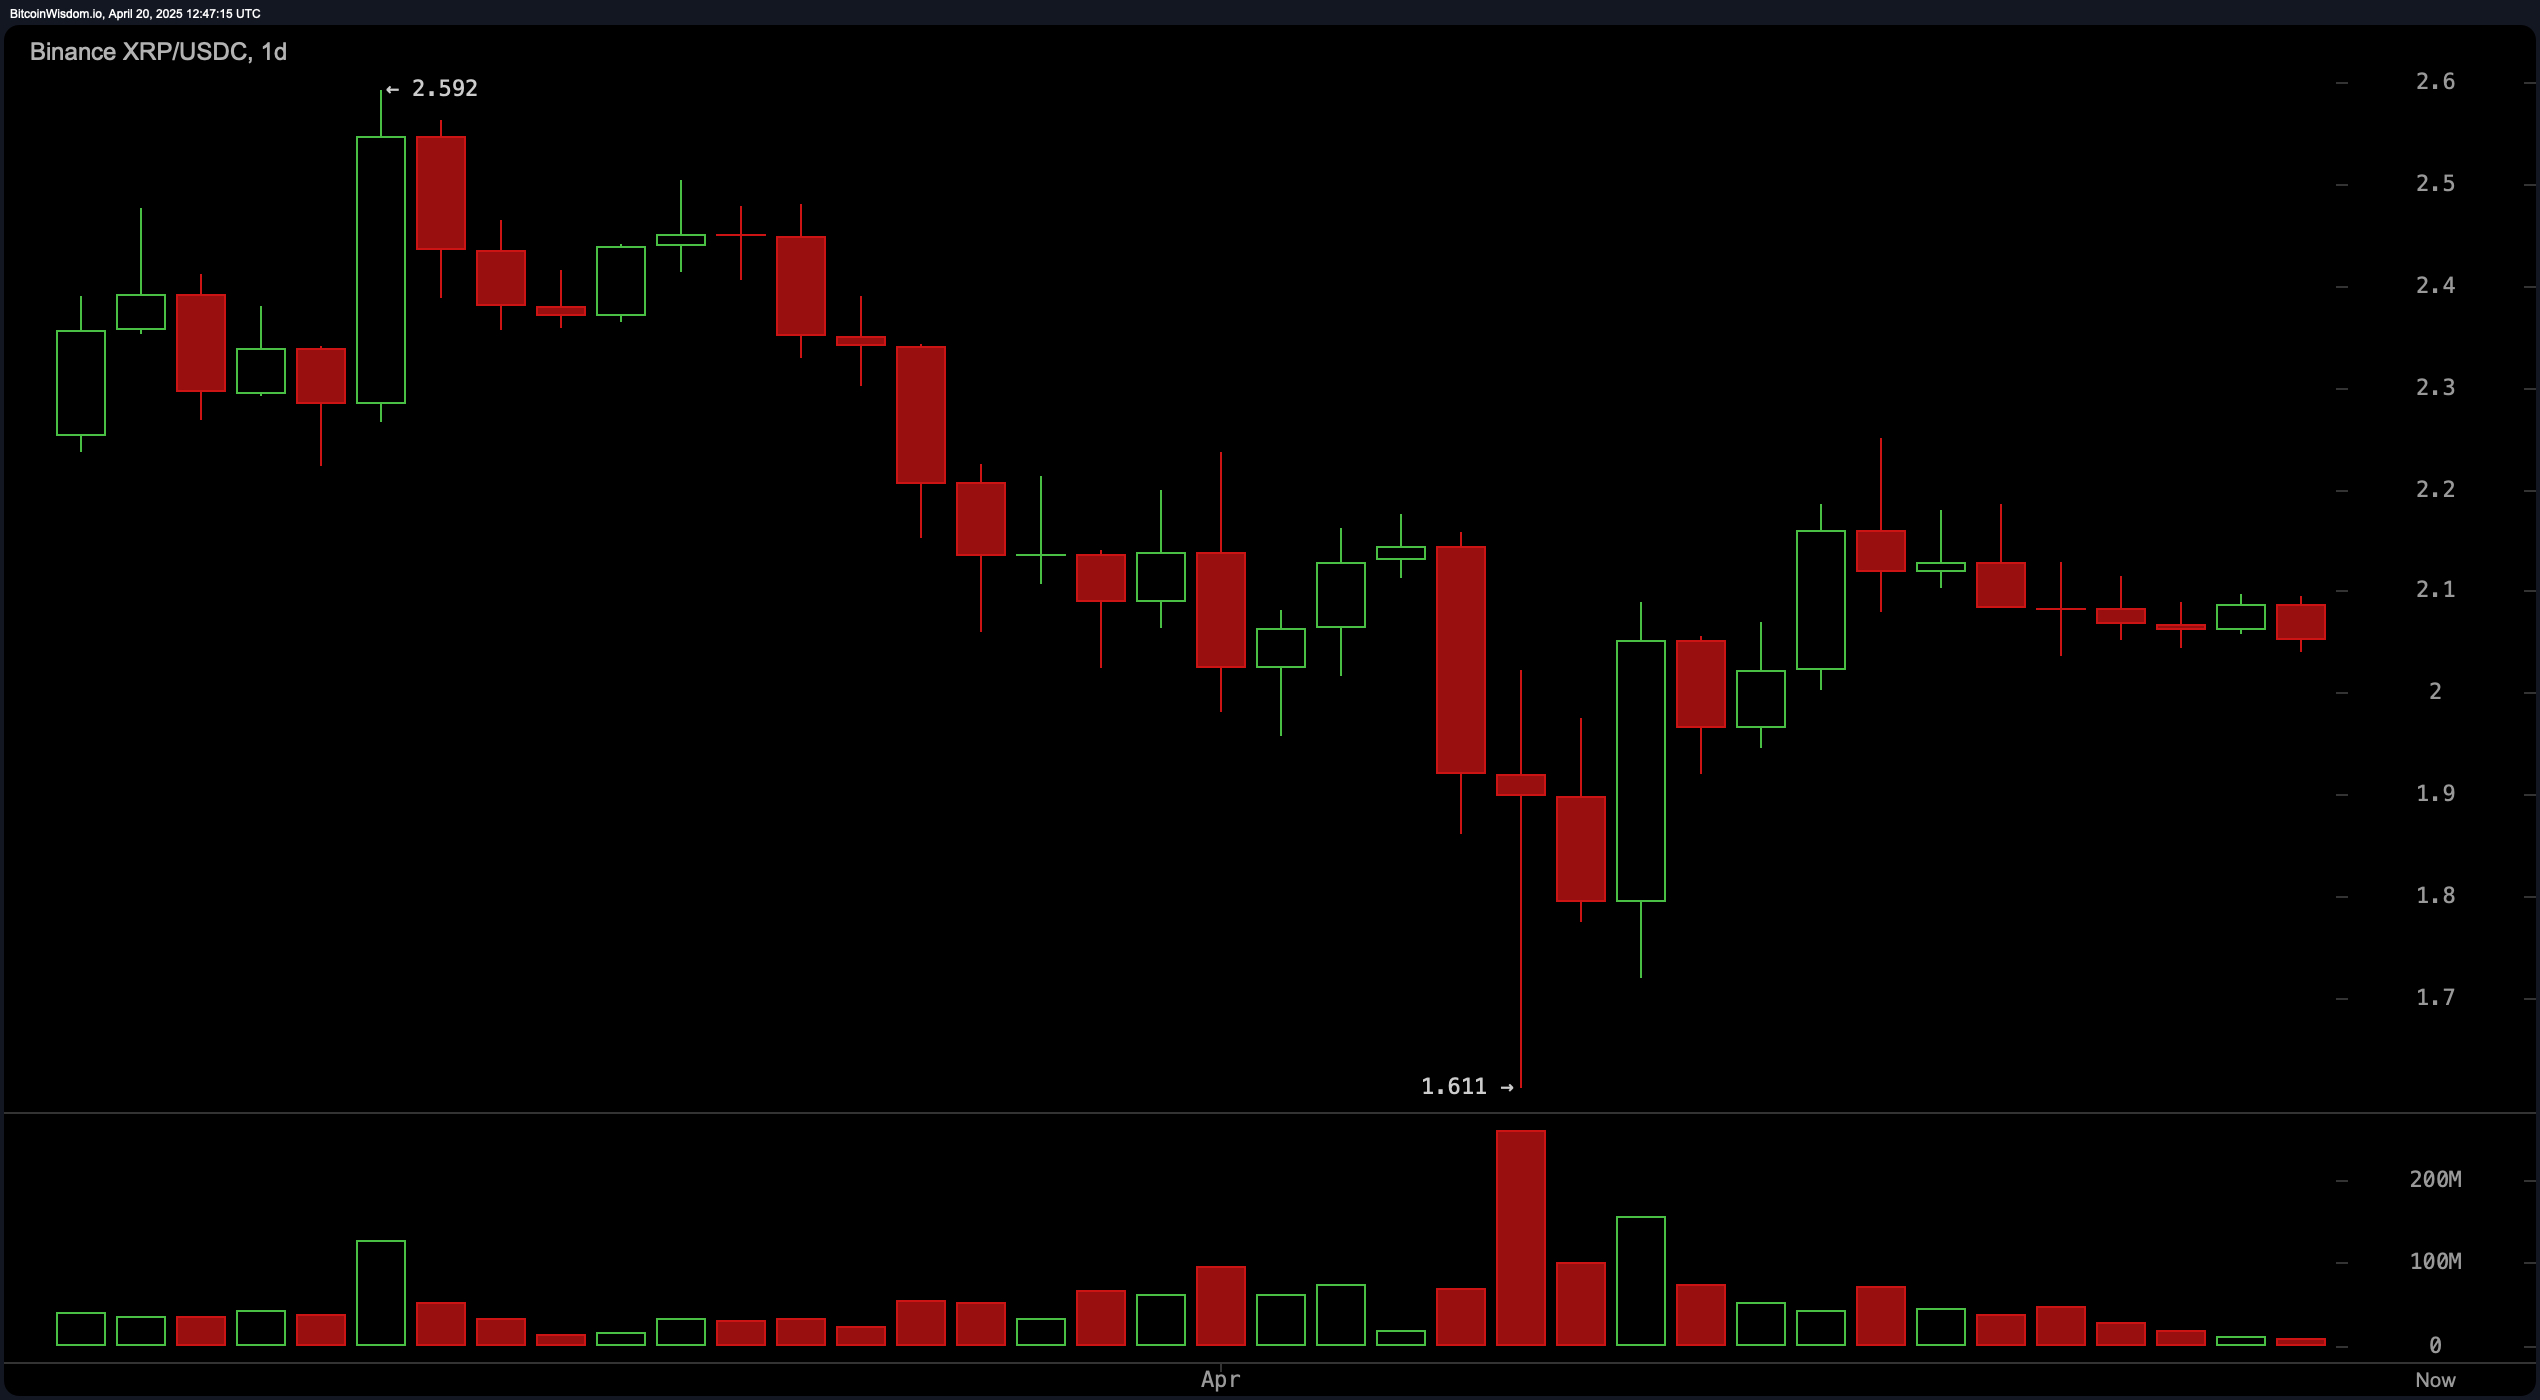
On the daily chart, XRP is experiencing a mid-term downtrend, having recently rebounded from a key support level at $1.611. The asset is now consolidating within a resistance zone ranging from $2.10 to $2.20, following a significant bounce that was accompanied by a spike in trading volume—a classic sign of capitulation or a possible reversal setup. This increased activity at lower levels could attract long-side traders if the price revisits the $1.80–$1.90 range and confirms bullish formations such as a hammer or a bullish engulfing pattern. Targets near $2.20–$2.25 are considered prudent, particularly with trailing stops to safeguard against volatility.

XRP/USDC 1D chart via Binance on April 20, 2025.
XRP’s oscillators paint a largely neutral picture with some signs of latent bullish bias. The relative strength index (RSI) sits at 45.84, suggesting neither overbought nor oversold conditions. The Stochastic at 71.71 also supports a neutral stance, while the commodity channel index (CCI) and average directional index (ADX) are aligned similarly at 11.45 and 21.02, respectively. The Awesome oscillator is slightly negative at -0.09133, further reflecting indecision. However, the momentum indicator at 0.08577 and the moving average convergence divergence (MACD) level at -0.04208 both indicate a positive signal, implying the potential for upward movement should broader conditions align.
The moving averages (MAs) are mixed, highlighting short-term bearish pressure with long-term bullish undercurrents. The exponential moving averages (EMAs) and simple moving averages (SMAs) for 10, 20, 30, 50, and 100 periods are all in bearish territory, with values ranging from $2.06984 to $2.47084—each above the current spot price of $2.05. Notably, the 200-period EMA at $1.96140 and SMA at $1.94085 are signaling bullish sentiment, indicating that while XRP faces near-term resistance, its broader trajectory remains supported by longer-term averages. This dichotomy underscores the importance of timeframe alignment in trading strategy execution.
Bull Verdict:
If XRP successfully holds support above $2.03 and confirms a higher low on the intraday charts, reinforced by bullish momentum signals from the momentum (10) and moving average convergence divergence (MACD) indicators, a push toward $2.10–$2.25 remains plausible. The long-term buy signals from the 200-period moving averages further support a continuation of the broader uptrend, making XRP a candidate for accumulation during pullbacks.
Bear Verdict:
XRP’s failure to break above key resistance zones, coupled with persistent selling signals across the 10–100 period moving averages, suggests that the asset remains vulnerable to further downside. If support near $2.03 fails to hold, a retest of lower levels closer to $1.90 or even the $1.80–$1.611 range could materialize, particularly in the absence of strong buying volume or bullish confirmation on higher timeframes.
免责声明:本文章仅代表作者个人观点,不代表本平台的立场和观点。本文章仅供信息分享,不构成对任何人的任何投资建议。用户与作者之间的任何争议,与本平台无关。如网页中刊载的文章或图片涉及侵权,请提供相关的权利证明和身份证明发送邮件到support@aicoin.com,本平台相关工作人员将会进行核查。


