Original Title: "On-Chain Data Academy (VIII): A Brand New, #Ark Participated Research on the $BTC Magical Pricing Methodology (III)"
Original Author: Mr. Beggar, On-Chain Data Analyst
TLDR
- The Cointime Price series consists of three articles, this is the third one.
- It is recommended to read at least the first article first.
- This article will introduce another way to observe the Cointime Price at its peak.
- This article will also introduce the distribution rate observation indicator designed by the author.
I. Brief Review of the First Two Articles
In the Cointime Price series, the first article introduced the basic principles of Cointime Price and provided an application for bottom fishing; "On-Chain Data Academy (VI): A Brand New, Ark Participated Research on the BTC Magical Pricing Methodology (I)"
The second article analyzed from the perspective of "the degree of price deviation from Cointime Price," sharing the Cointime Price Deviation model designed by the author, and used this model as a signal filter for peak observation. "On-Chain Data Academy (VII): A Brand New, Ark Participated Research on the $BTC Magical Pricing Methodology (II)"
For readers who are reading this series for the first time, it is recommended to at least finish the first article; otherwise, understanding the subsequent content may be a bit challenging.
II. Peak Escape Application Methodology: Cointime Price Daily Distribution Rate
1. The Patterns of Cointime Price
Before continuing, let’s take a look at the Cointime Price chart:
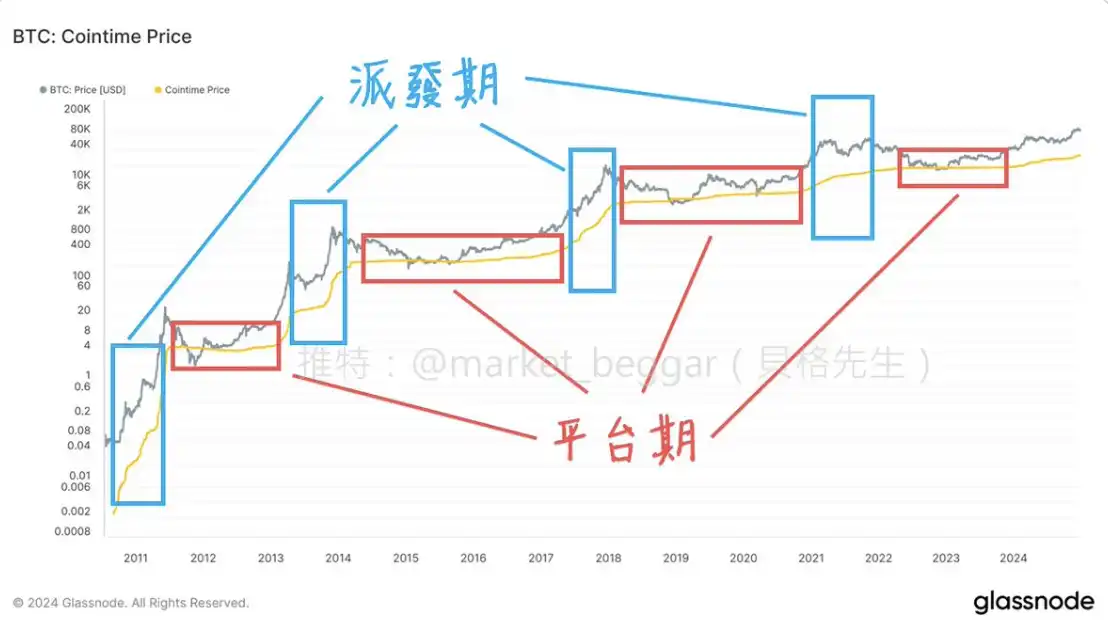
Observant readers should have noticed that the trend of Cointime Price has a very obvious characteristic: "sharp rise - plateau period - sharp rise - plateau period…"
From the content of the first article in the series, we know that:
Cointime Price only rises rapidly when long-term holders distribute in large quantities, and Cointime Price essentially represents the "market's time-weighted average cost of chips." During the distribution phase, the remaining holders in the market accept the distribution, leading to an increase in holding costs, which is reflected in the chart as a rapid rise in Cointime Price.
Utilizing this characteristic, the author designed an indicator to observe the distribution rate, temporarily named "Cointime Price Daily Distribution Rate."
2. Cointime Price Daily Distribution Rate Indicator
To measure the rate of change, the author used a very simple formula: (Today's CP - Yesterday's CP) / Today's CP, and then smoothed the result with a moving average (*Note: CP is the abbreviation for Cointime Price).
By inputting this formula into glassnode, the following chart can be obtained:
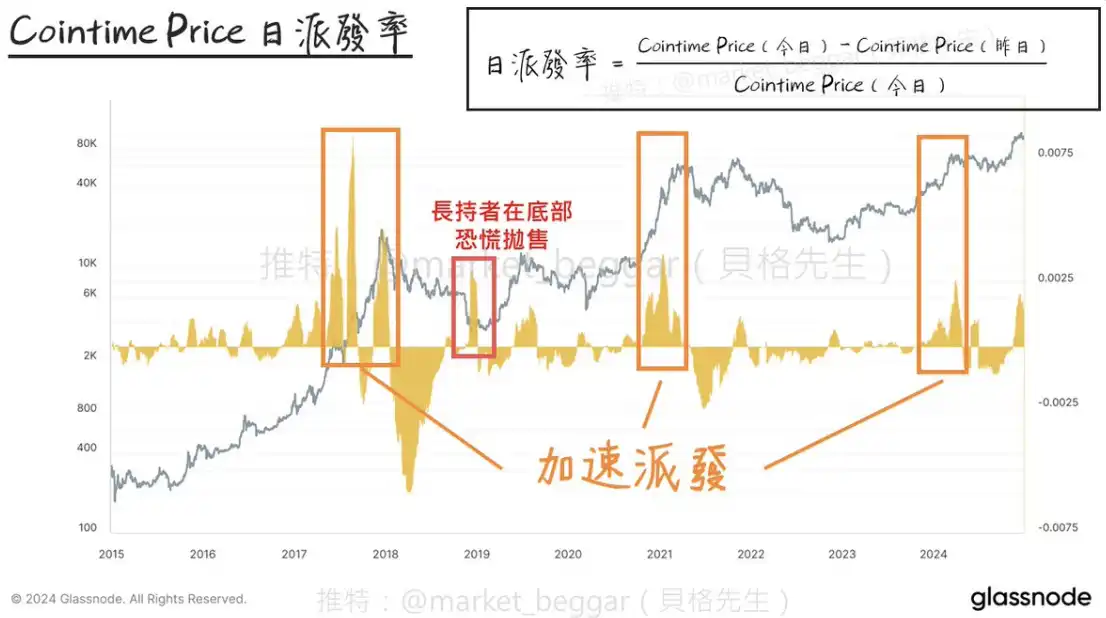
We can see that each time a major bull market wave appears, it is accompanied by a high distribution rate of Cointime Price. Except for a high distribution rate that occurred near the bottom in 2019, any other time a high distribution rate appears usually signals accelerated distribution by long-term holders. As for that instance in 2019, it would not lead to misjudgment in actual operations because just looking at the price trend at that time would indicate that it could not possibly be a peak.
3. Historical Daily Distribution Rate Conditions at Peaks & Current Market Stage
Logically, every time #BTC reaches a cyclical peak, there usually isn't just one "distribution." This can be seen from indicators like UPDR, Realized Profit, etc., and it logically makes sense because distribution is a process, not an event that happens all at once.
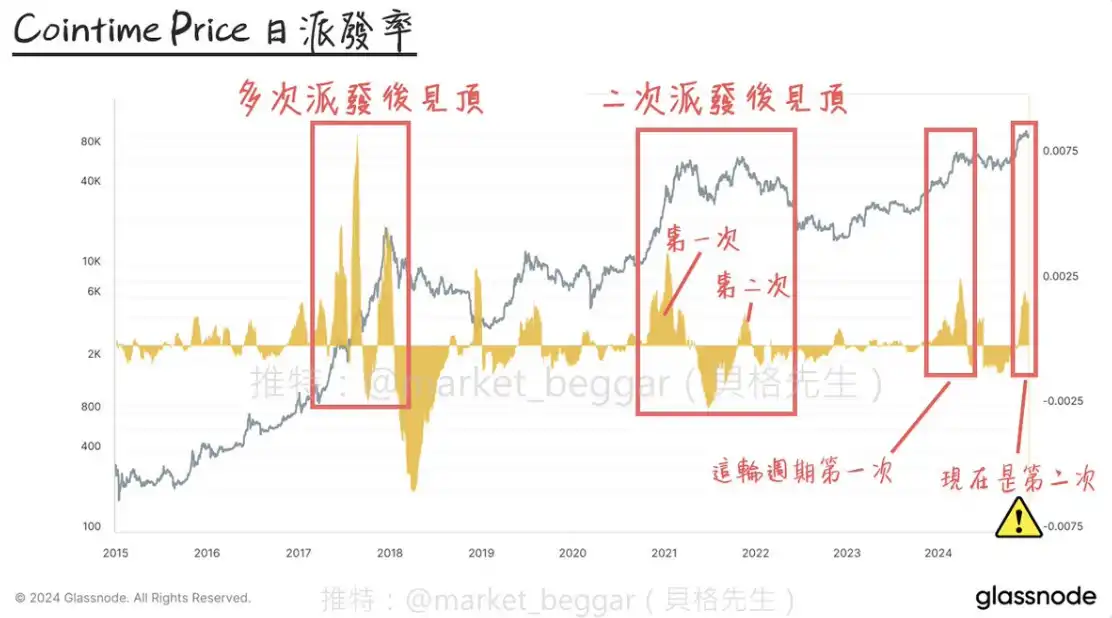
Readers can click on the above image (Figure 3); during the formation of the peak, the daily distribution rate often shows a significant increase more than once. In this bull market cycle, the daily distribution rate accelerated once in March this year, which can also be corroborated by the data from Realized Profit, indicating that some long-term holders indeed chose to take profits at that time.
If you are not familiar with what Realized Profit is, you can refer to this post: "On-Chain Data Academy (III): Have the Bottom Accumulating Players Taken Profits?"
March of this year was the first time the distribution rate significantly increased in this cycle, and during the rapid price surge following Trump's election in November, the distribution rate saw a second increase.
This also echoes the Realized Profit data cited in the second peak escape weekly report: "On-Chain Data Academy (II): The Hodlers Who Keep Making Money, What Is Their Cost of Buying BTC?"
From the perspective of on-chain data, this is a warning signal worth continuous attention.
III. Conclusion
This article is the third in the Cointime Price series, and this series will come to a temporary conclusion. I hope it can be helpful to everyone, and I encourage readers to provide feedback and comments; if you have any thoughts, feel free to leave a message below to communicate with me! If you are not a glassnode user, you can also track market trends in real-time by reading the weekly reports I publish.
免责声明:本文章仅代表作者个人观点,不代表本平台的立场和观点。本文章仅供信息分享,不构成对任何人的任何投资建议。用户与作者之间的任何争议,与本平台无关。如网页中刊载的文章或图片涉及侵权,请提供相关的权利证明和身份证明发送邮件到support@aicoin.com,本平台相关工作人员将会进行核查。


