Original Title: "On-Chain Data Academy (9): Market Barometer RUPL (I) - Data Introduction & Bottom Fishing Application"
Original Author: Mr. Beggar, On-Chain Data Analyst
TLDR
- The RUPL series will be divided into 2 articles, this is the first one.
- RUPL can present the current unrealized profit status of the market.
- By observing RUPL, one can discover the operational patterns at market tops and bottoms.
- This article will share a bottom fishing model based on RUPL.
1. What is RUPL?
RUPL, short for Relative Unrealized Profit & Loss, refers to "relative unrealized profit and loss." This indicator can be broken down into two parts: RUP and RUL.
Taking the calculation method of RUP as an example:
Compare the current price with the price at which each $BTC was last transferred, categorizing chips as profitable if "current price > last transfer price."
Multiply the profit amount of each profitable chip by the corresponding quantity to obtain Unrealized Profit.
Finally, standardize this data based on the market capitalization at that time.
In other words, Unrealized Profit is the total unrealized profit currently in the market; RUP standardizes it based on market capitalization for horizontal comparison of market profitability across different periods. The algorithm for RUL is the same as RUP and will not be elaborated on further in this article.
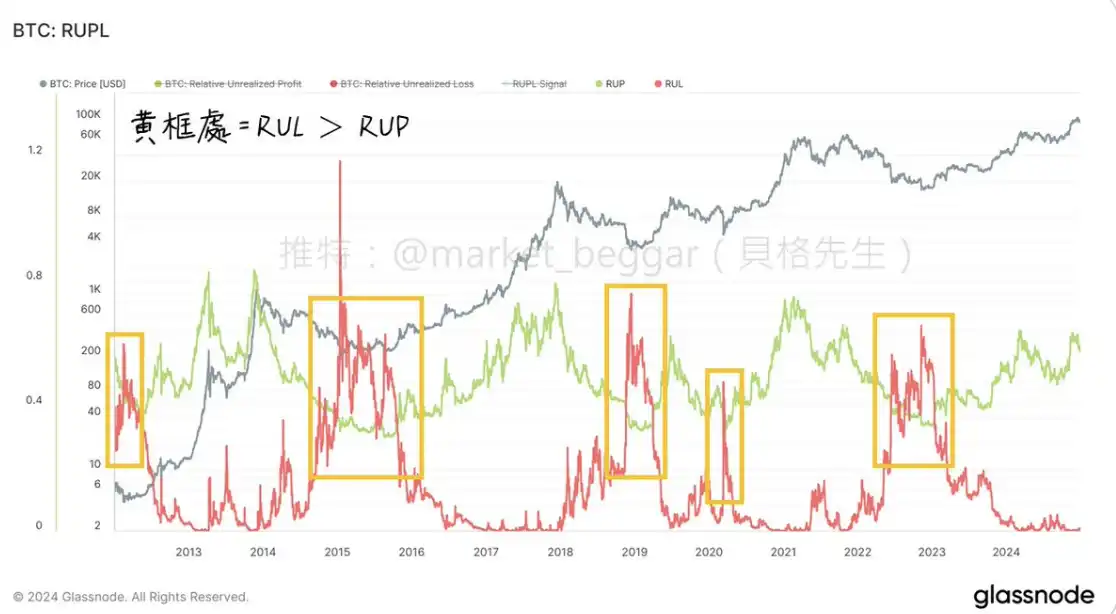
As shown in the above figure, the green line represents RUP, and the red line represents RUL. It can be seen that the price is highly positively correlated with RUP and highly negatively correlated with RUL. This is intuitive because as the price of the coin rises, profitable chips and unrealized profits naturally increase.
However, if we further observe the above figure, we will find that RUL is higher than RUP during certain time periods (i.e., the red line is above the green line, as indicated in the yellow box in the figure). This indicates that the market is generally in a state of unrealized losses. Do these time periods have special significance? Please continue reading.
2. Bottom Fishing Application of RUPL
As mentioned, there is a saying: "Be greedy when others are fearful." When the majority of chips in the market are in a state of loss, it may be a good time for us to enter and collect chips.
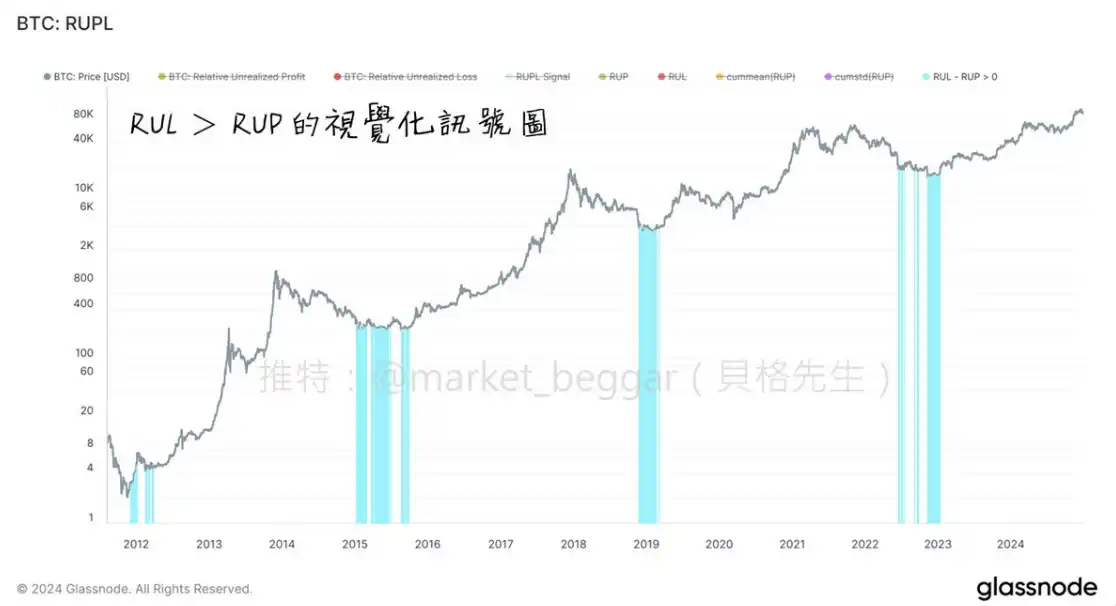
In the above figure, I marked the time periods where RUL > RUP from Figure 1 and plotted this chart. It can be clearly seen that when RUL > RUP, it is almost always at historical cyclical bottoms.
This is not a case of "carving a boat to seek a sword"; the logic is as follows:
"When the market is generally in a state of loss, it means that investors holding a large number of low-priced chips have basically completed their distribution; while trapped investors are often unwilling to cut losses due to the price being too low. These two emotions intertwine, leading to a significant decrease in selling pressure. Therefore, as long as there is a slight buying interest, it may push the trend to reverse and start rising."
This logic is very similar to the LTH-RP bottom fishing strategy shared earlier. Interested readers can refer to this post: "On-Chain Data Academy (2): The Hodlers Who Always Make Money, What Is Their Cost of Buying BTC?"
3. Sharing the Logic of Bottom Fishing Model Design
Next, we will temporarily not look at RUL and observe the RUP chart alone. We can find that RUP has a relatively close value range at historical bottoms:
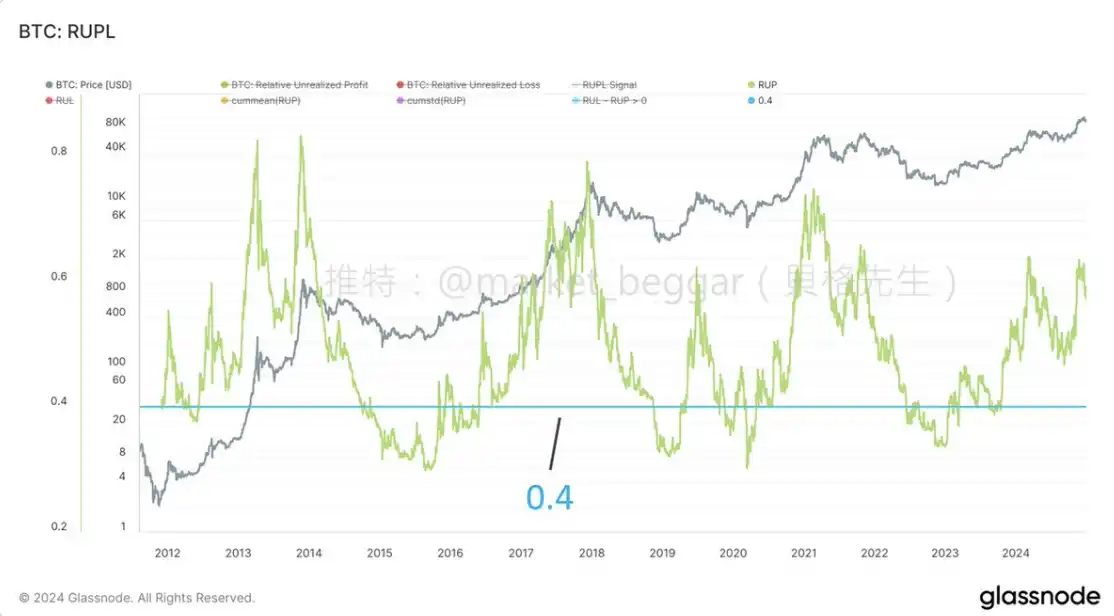
For example, I added a horizontal line at 0.4 in the chart, and it can be clearly seen that the area of RUP 0.4 is marked. (The 0.4 here is a model parameter and can be adjusted, which will be mentioned later.)
Since we have found that RUP has a significant bottom range, we can overlay the condition of RUP 0.4 onto the previous RUP RUL conditions for secondary signal filtering, resulting in the following:
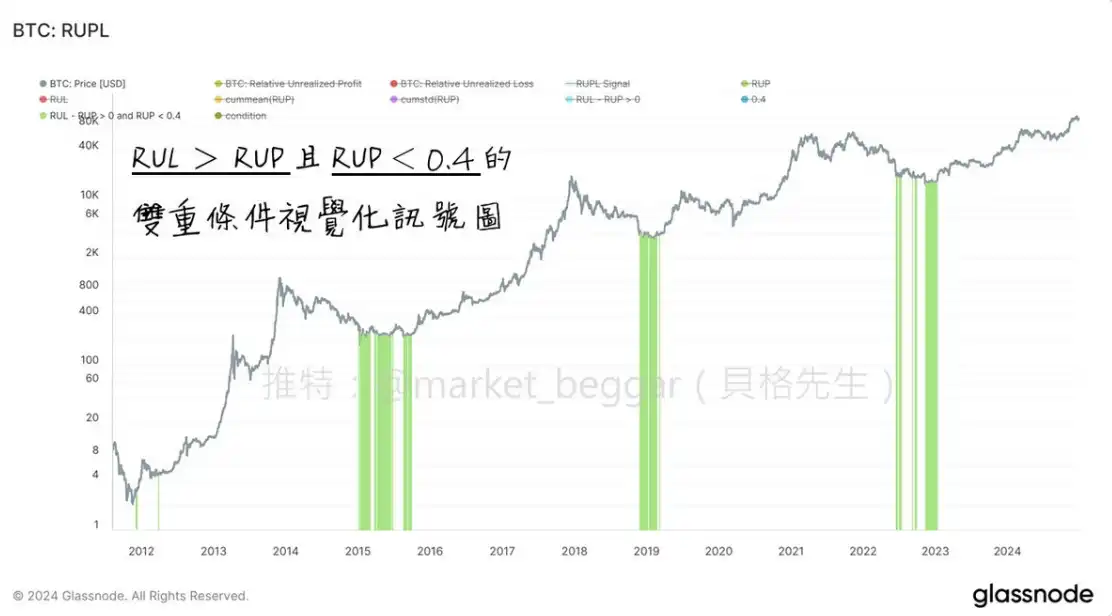
This is a commonly used method in model design, aimed at achieving more precise results through signal screening, making the signals output by the model more valuable for reference.
The above figure shows the combination of (RUP 0.4) + (RUP RUL) conditions. Although the filtering effect is not very significant, it can still be seen that it is more rigorous than using RUP RUL alone. If the 0.4 is adjusted down (for example, set to 0.38), the model will be stricter, but during the parameter tuning process, care must be taken to avoid overfitting, as blindly fine-tuning the model based on historical data may lead to the model becoming ineffective in the future.
Supplement: Overfitting refers to "overfitting," similar to what we often call "carving a boat to seek a sword."
4. Conclusion
This article is the first in the RUPL series, mainly introducing the definition and calculation method of the RUPL indicator and sharing the logic of the bottom fishing model designed based on this indicator.
In the next article, I will introduce a practical application of escaping the top based on RUPL and conduct a retrospective analysis of historical cyclical tops, ensuring it is packed with valuable content. Stay tuned.
免责声明:本文章仅代表作者个人观点,不代表本平台的立场和观点。本文章仅供信息分享,不构成对任何人的任何投资建议。用户与作者之间的任何争议,与本平台无关。如网页中刊载的文章或图片涉及侵权,请提供相关的权利证明和身份证明发送邮件到support@aicoin.com,本平台相关工作人员将会进行核查。


