The one-hour chart presents a micro-bearish structure in bitcoin, initiated by a rejection at the $94,700 level. This high marked a pivot point, triggering a decline that retested support at approximately $91,700. Following this, a modest rebound occurred, hinting at transient accumulation. However, the pattern of lower highs and lower lows, coupled with increasing red volume, suggests prevailing sell-side momentum. This bearish inclination calls for careful monitoring, especially for intraday traders eyeing quick reversals. A potential scalp setup may emerge if bitcoin retests $91,700 and forms a higher low with diminished selling pressure, aiming for an upside to the $93,000 mark.
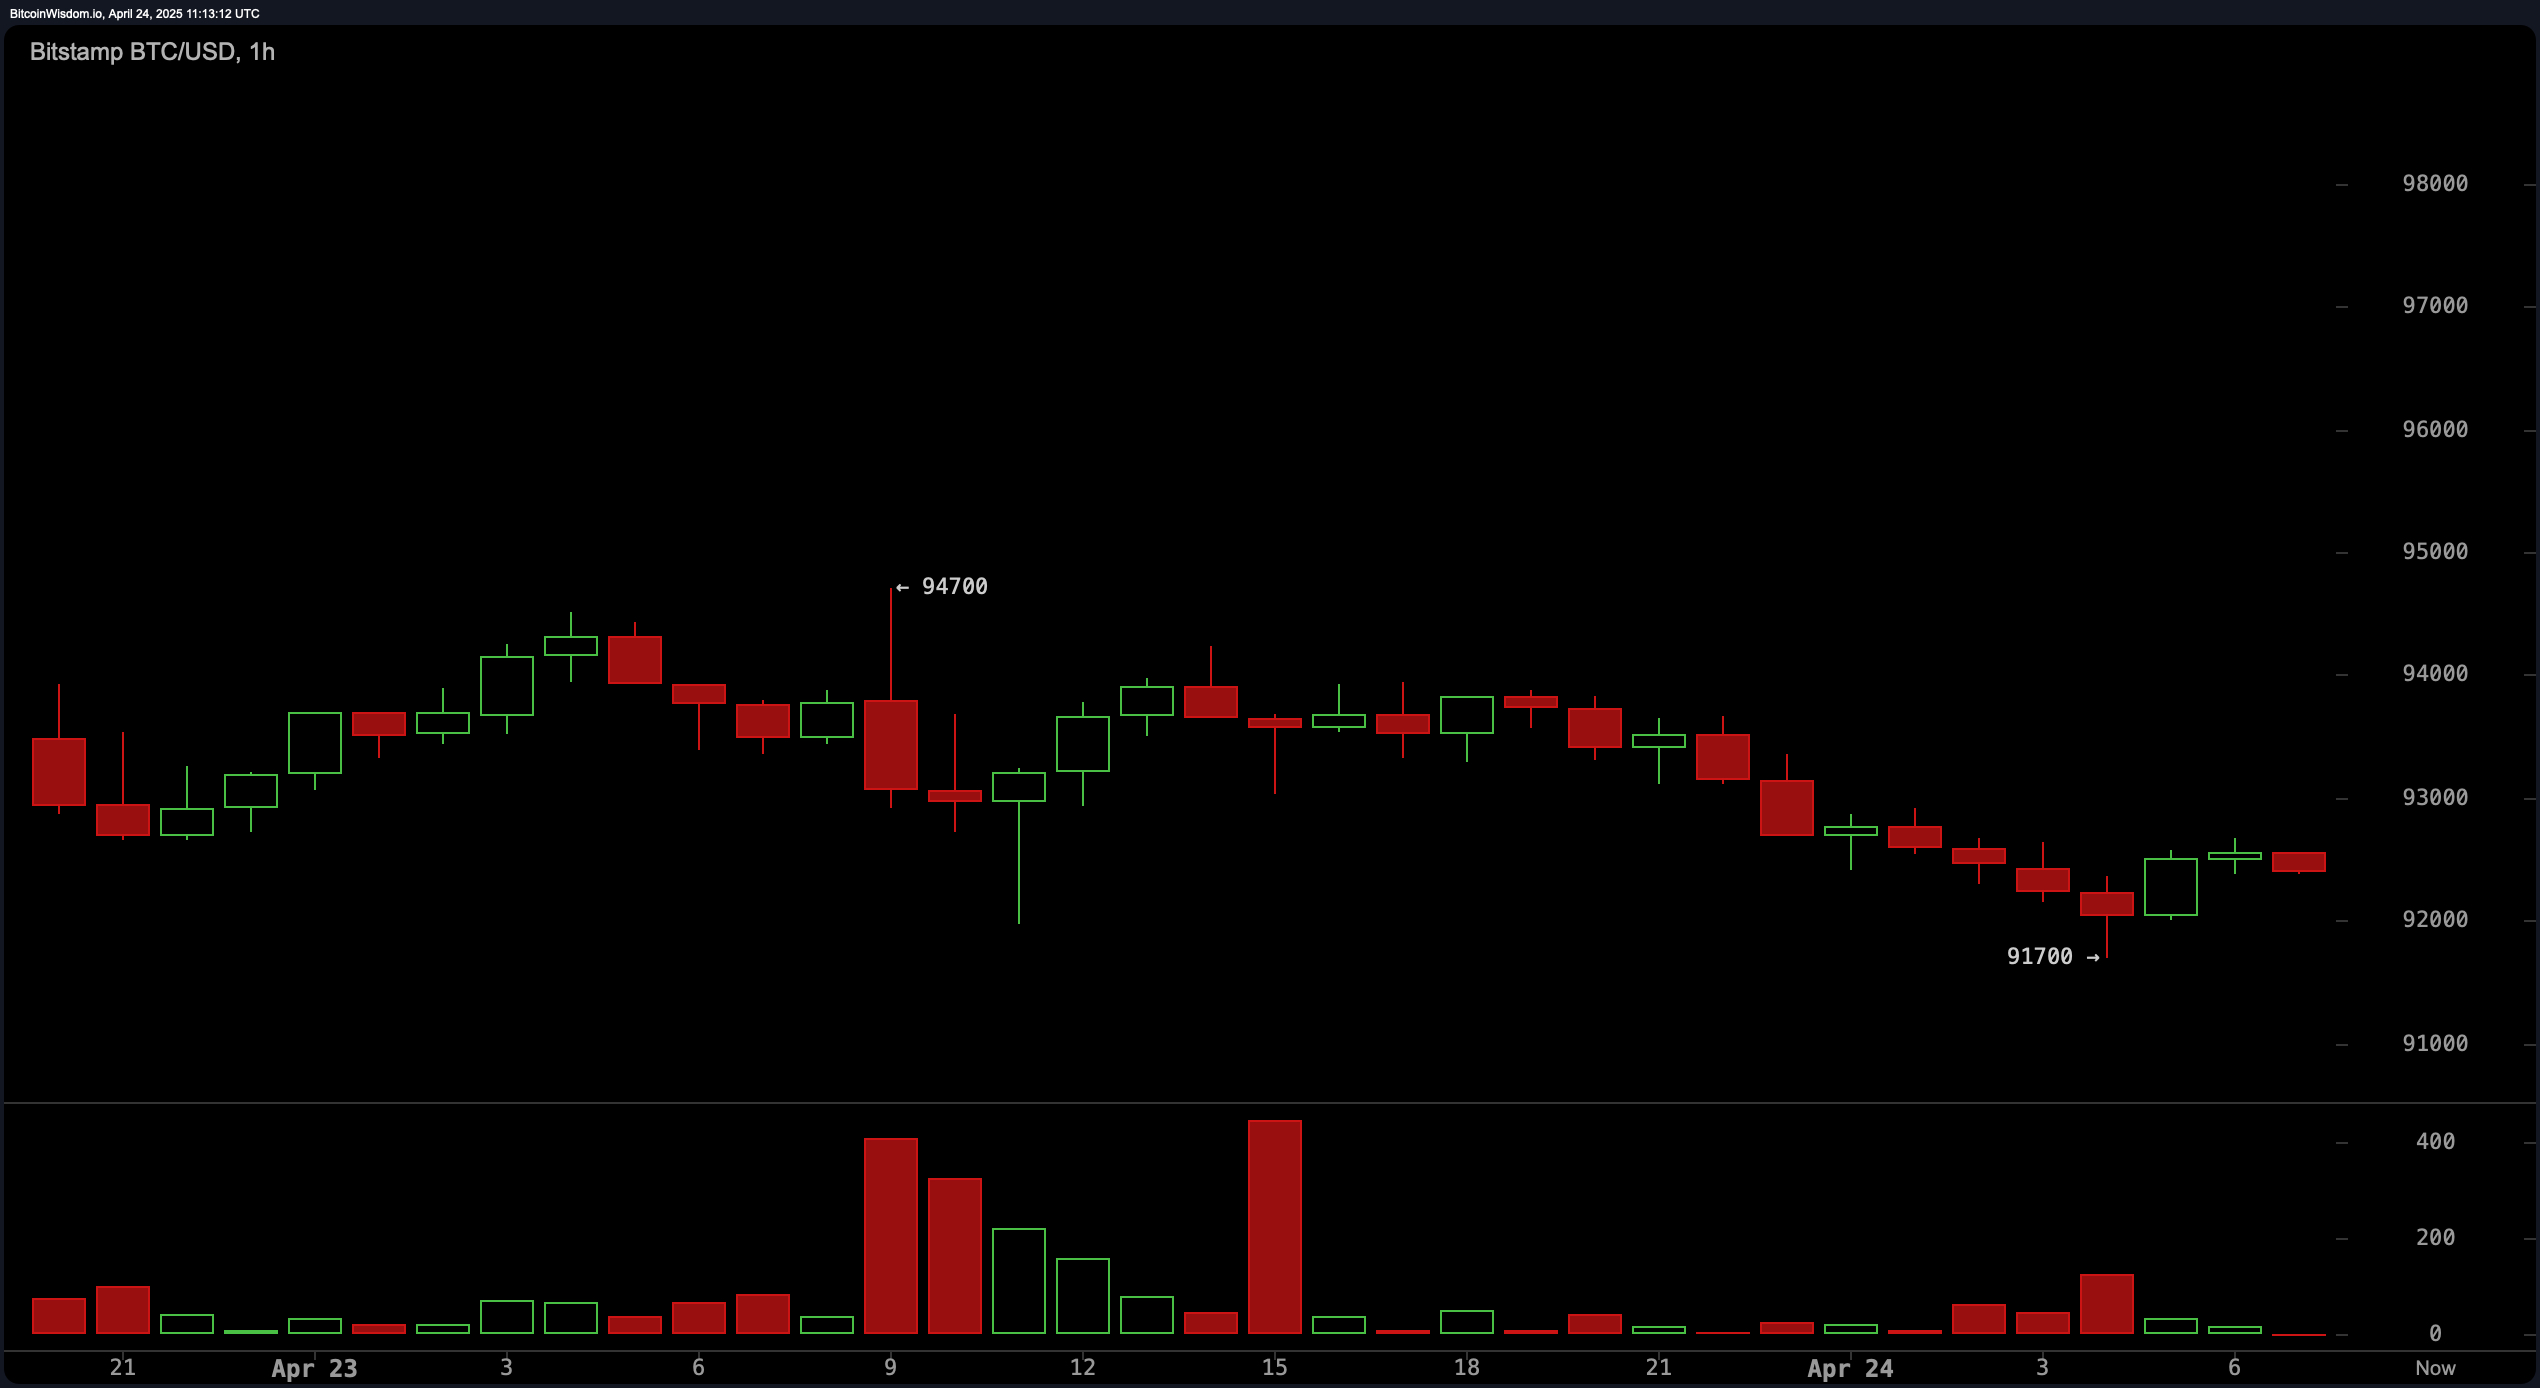
BTC/USD 1 hour chart via Bitstamp on April 24, 2025.
Analyzing the four-hour chart, bitcoin shows signs of cooling momentum post its recent peak. The formation of a rounded top, characterized by descending highs and a minor price retreat, implies short-term distribution. Selling volume around the highs substantiates this outlook, casting a cautious shadow over bullish setups. Yet, a re-consolidation around the $92,000 to $92,500 area, especially if accompanied by reduced volatility and rising support, could ignite a rebound. This scenario would favor a tactical entry with a protective stop, targeting a renewed challenge of the $94,000 resistance contingent on returning buyer strength.
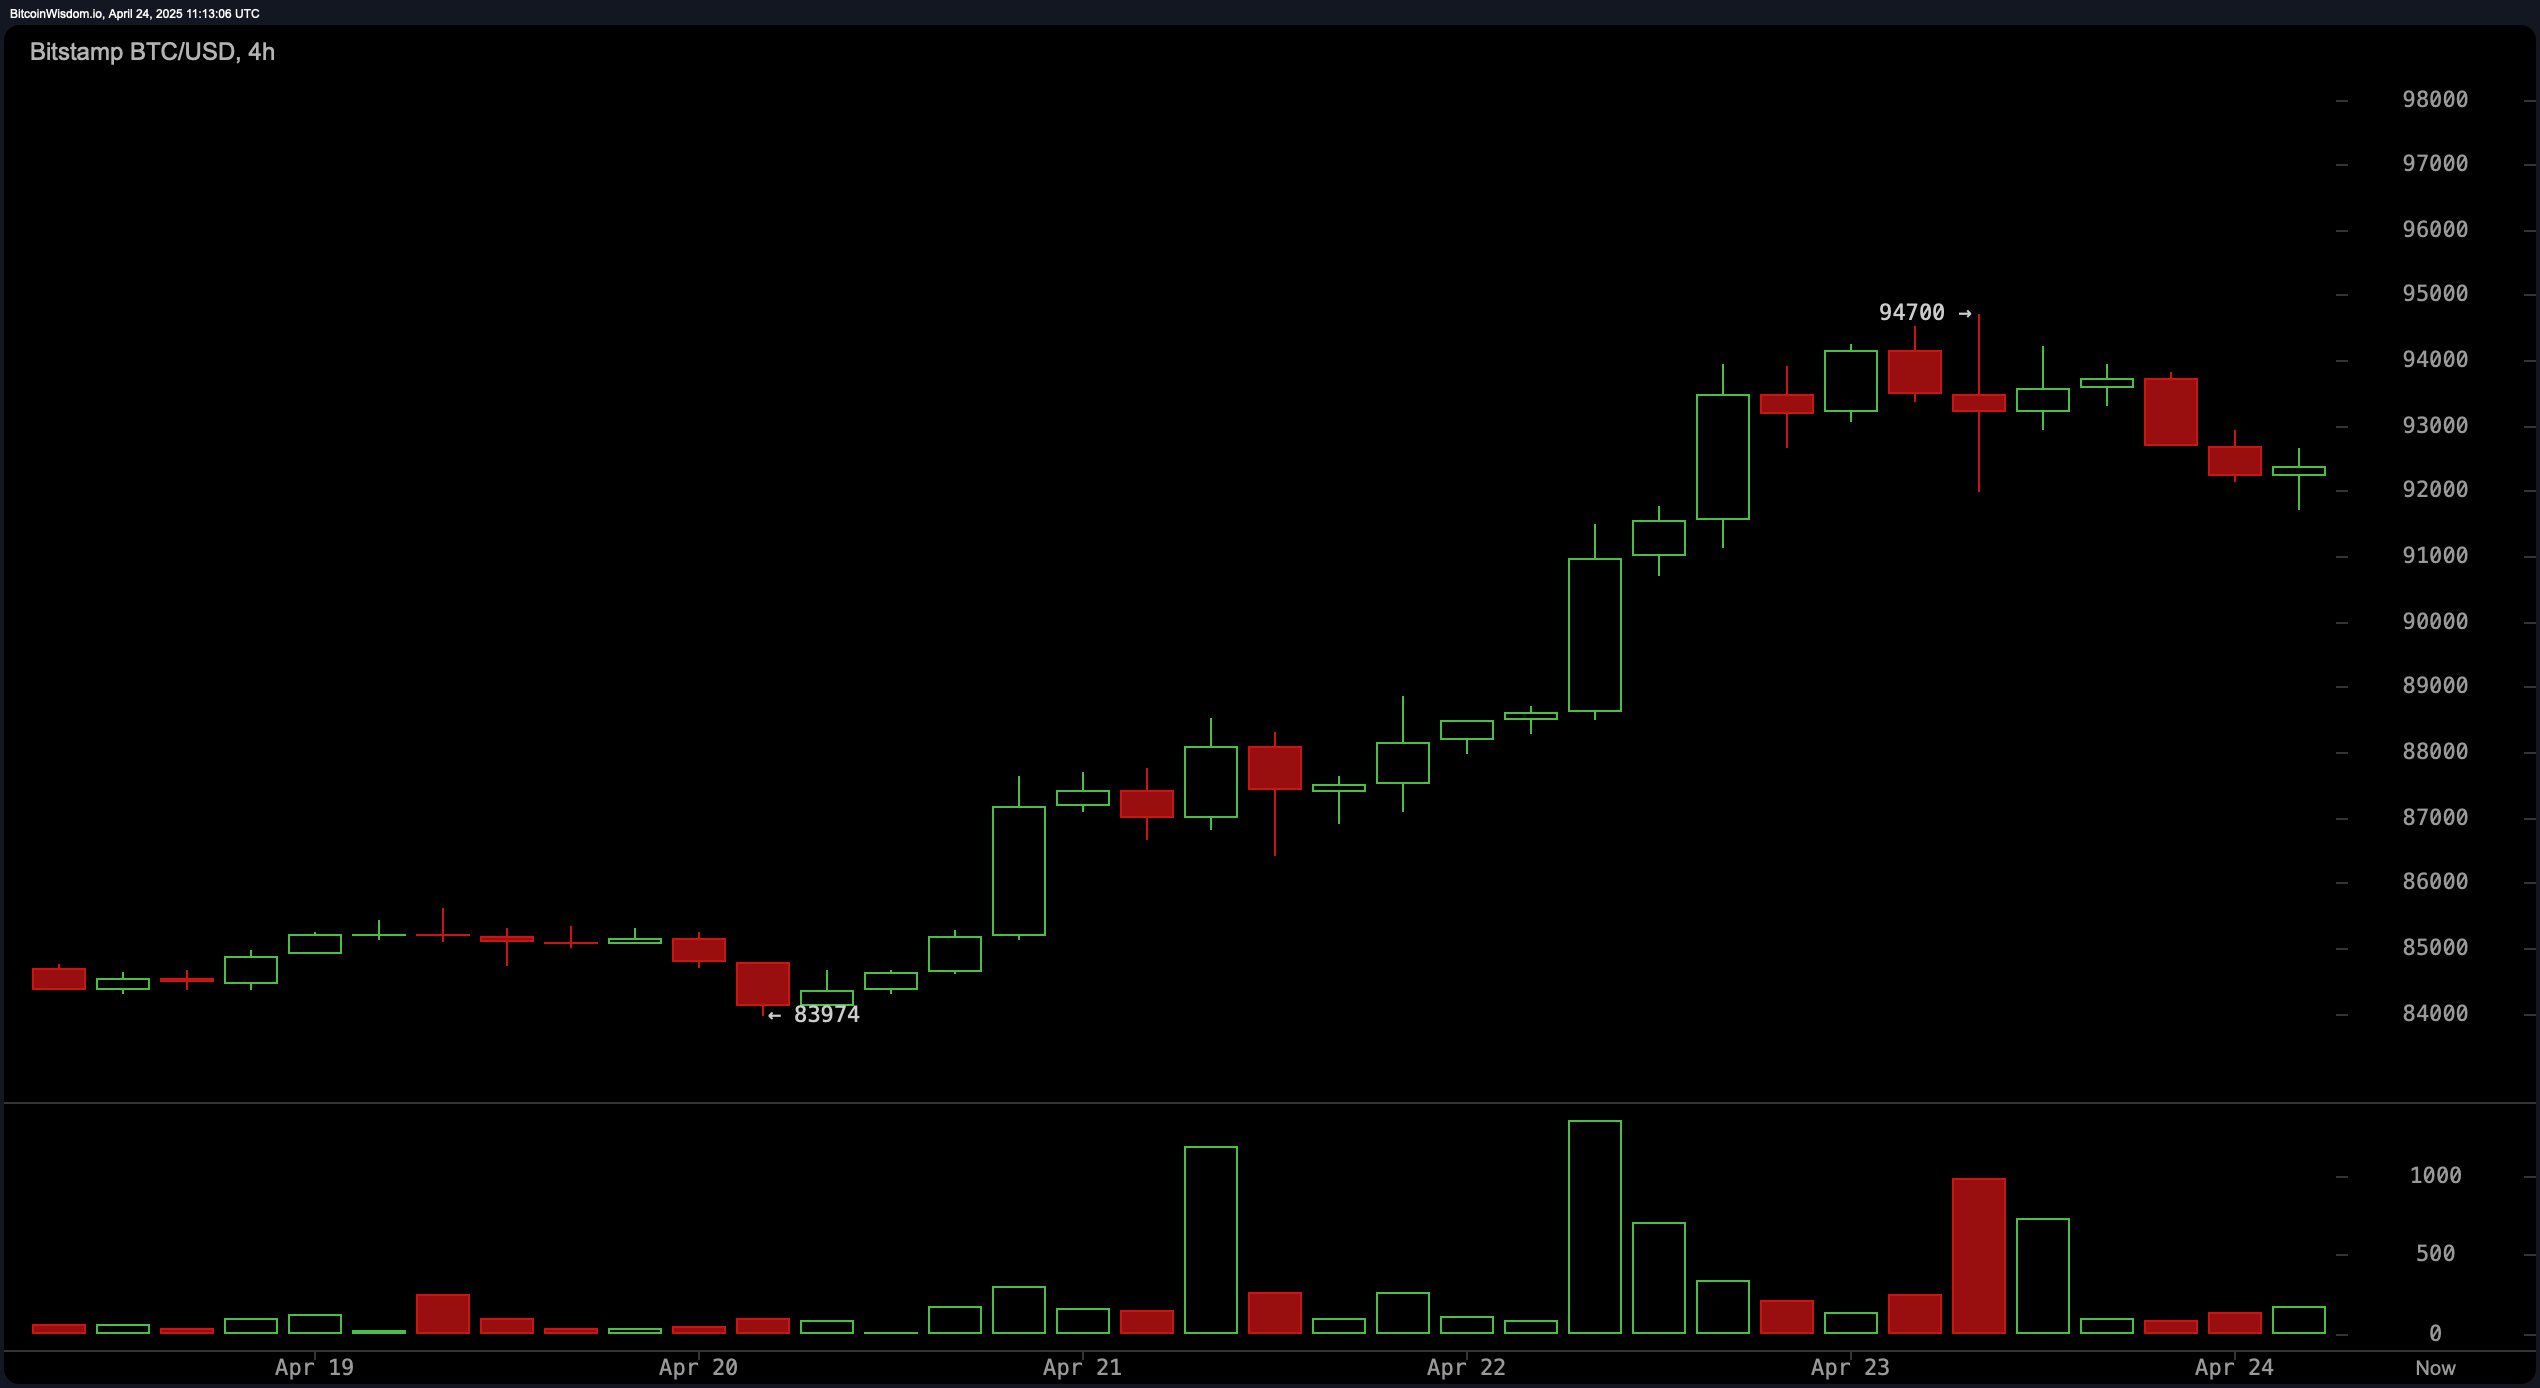
BTC/USD 4 hour chart via Bitstamp on April 24, 2025.
On the daily chart, bitcoin has demonstrated a strong bullish recovery, climbing from a trough of $74,434 to a recent high of $94,700. This upward trajectory was underpinned by increased trading volumes and green candle formations, confirming a strong bullish phase. Resistance has been encountered near the $94,700 level, prompting a mild pullback. Current support is identified within the $83,000 to $85,000 band, with a potential re-entry point between $88,000 and $90,000, assuming a retracement is marked by diminishing red volume. For position traders, profit-taking is advisable in the $94,000 to $96,000 range, barring a volume-backed breakout.
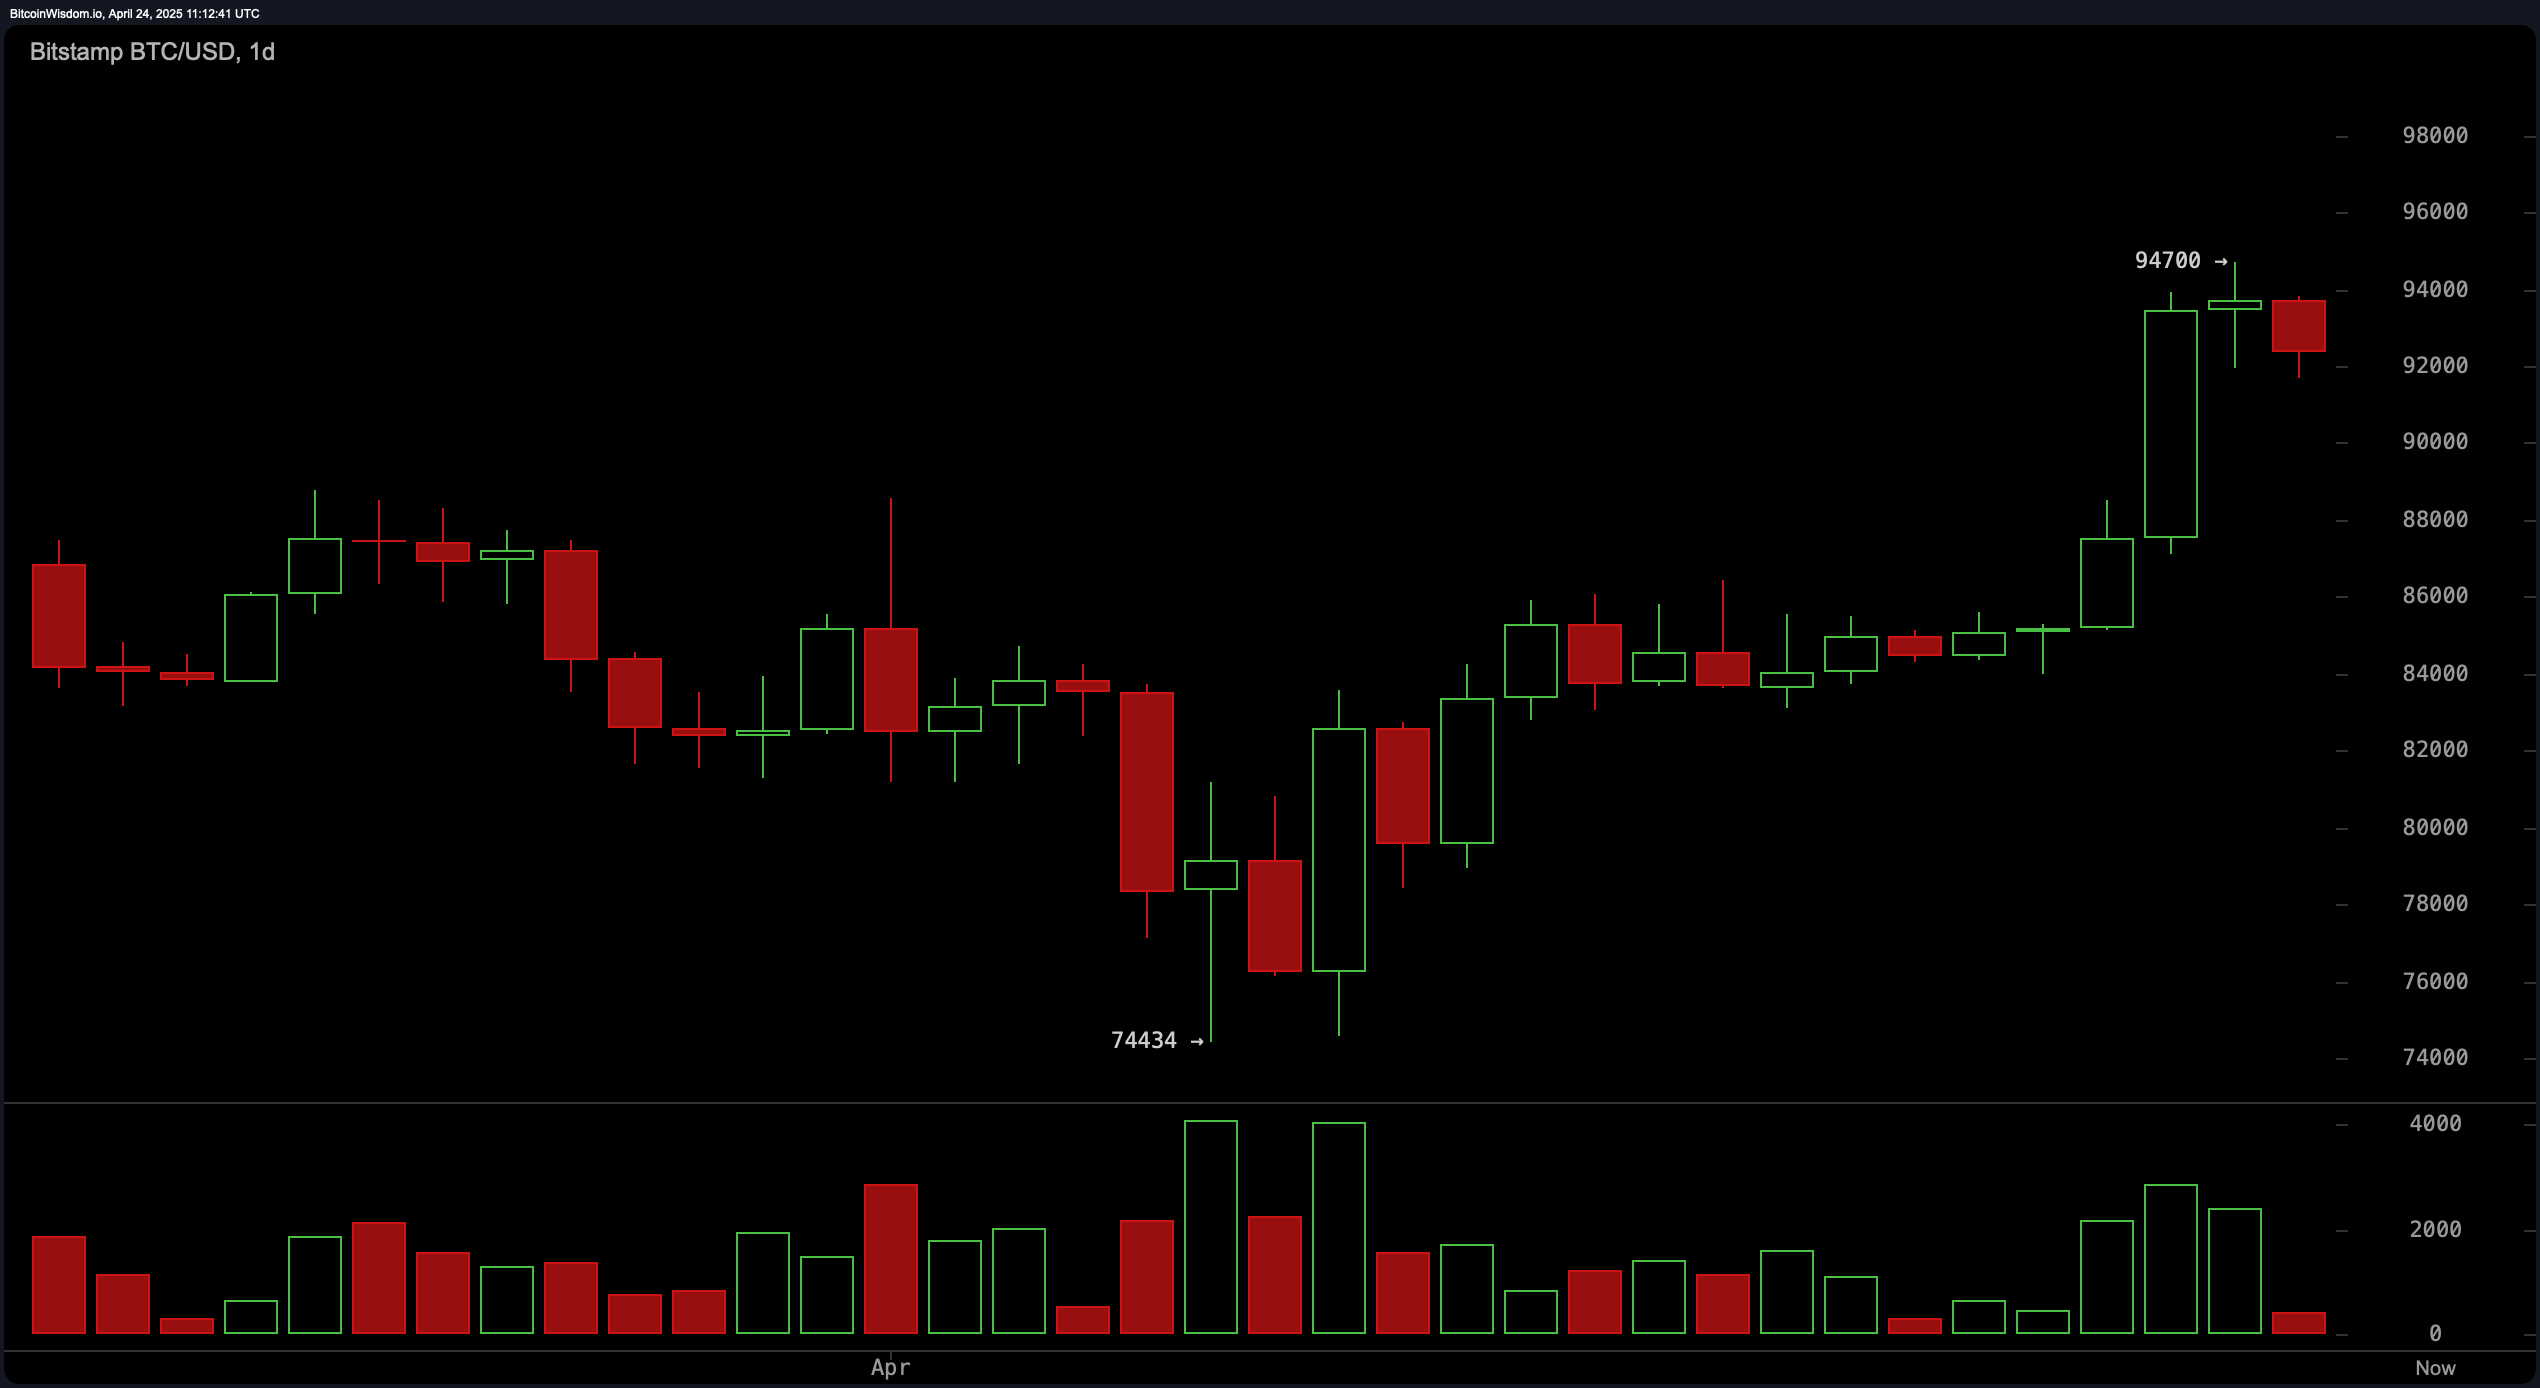
BTC/USD daily chart via Bitstamp on April 24, 2025.
Turning to oscillators, the indicators present a mixed narrative. The relative strength index (RSI) at 64 reflects a neutral stance, neither overbought nor oversold. The Stochastic oscillator at 92 and the commodity channel index (CCI) at 187 both signal bearish conditions, suggesting an overheated market. Conversely, the momentum oscillator at 7,842 corroborates this bearish divergence. Yet, the moving average convergence divergence (MACD) at 1,935 contradicts this outlook with a positive signal, reflecting underlying bullish momentum. The Awesome oscillator and the average directional index (ADX), both holding neutral positions, further depict a market in decision.
Moving averages collectively affirm a strong bullish undertone. Every tracked exponential moving average (EMA) and simple moving average (SMA) from 10 to 200 periods displays bullish signals. This widespread alignment underscores a dominant uptrend across all temporal scopes. The short-term averages, such as the 10-period EMA at $88,552 and the 10-period SMA at $87,455, bolster immediate support levels. Meanwhile, the 200-period EMA at $85,274 and the 200-period SMA at $88,689 solidify the longer-term bullish foundation, serving as critical psychological and technical benchmarks for market participants.
The Fibonacci retracement levels enhance our understanding of potential support zones during pullbacks. On the daily timeframe, levels such as 0.500 at $84,567 and 0.618 at $82,176 are crucial for gauging correction depth. These align with structural supports, offering viable rebound points. The four-hour chart highlights a key cluster between $89,000 and $90,500, aligning with the 0.382 and 0.500 levels. For the one-hour chart, the 0.618 level at $92,846 is pivotal; sustaining above this could prompt short-term upward moves, especially if the market stabilizes above $92,800. These levels are instrumental for setting entry and exit points with precision, aiding in risk-managed trading strategies.
Bull Verdict:
Bitcoin remains structurally strong with widespread confirmation from moving averages across all periods and a resilient price action that has successfully rebounded from lower supports. The sustained bullish alignment of the exponential moving average (EMA) and simple moving average (SMA) metrics, coupled with positive confirmation from the moving average convergence divergence (MACD), suggests the uptrend remains intact. If price stabilizes above key Fibonacci levels, particularly around $92,800, and buying volume returns, a renewed push toward $96,000 is highly plausible.
Bear Verdict:
Despite the broader bullish structure, short-term indicators and oscillators reflect signs of overextension. High stochastic oscillator and commodity channel index readings, alongside evident distribution patterns on lower timeframes, signal the risk of a deeper retracement. Should bitcoin fail to maintain support above $91,700 and selling pressure intensifies, the price could revisit the $88,000 zone or lower, testing the integrity of the current bullish trend.
Final Take Verdict:
Bitcoin’s current setup presents a compelling blend of strength and caution. While moving averages and key support levels reinforce a bullish backdrop, conflicting oscillator signals and short-term chart patterns suggest the potential for volatility ahead. Traders should remain agile—leaning bullish but prepared for rapid shifts—as bitcoin navigates the critical $92,800 pivot.
免责声明:本文章仅代表作者个人观点,不代表本平台的立场和观点。本文章仅供信息分享,不构成对任何人的任何投资建议。用户与作者之间的任何争议,与本平台无关。如网页中刊载的文章或图片涉及侵权,请提供相关的权利证明和身份证明发送邮件到support@aicoin.com,本平台相关工作人员将会进行核查。


