The weekly level of Bitcoin has formed an upward wick, which is a vertical line of a bullish candle on the weekly chart.
Currently, from the perspective of the weekly level, there is a corresponding resistance above the weekly chart, which is not difficult to see.
As we discussed earlier, this area is a point where there was a buildup after a previous surge, leading to a breakout. Therefore, the price has now reached this position.
It is expected that there will be resistance at this position, and in the coming week, it is likely that further consolidation will occur in this area, from the perspective of the weekly level.
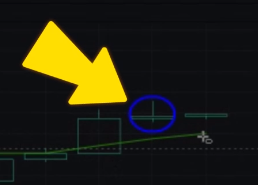
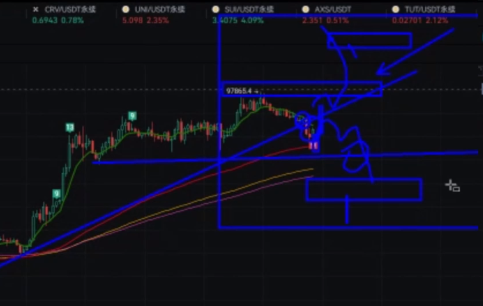
Switching to the 4-hour trend line perspective, Bitcoin has broken this trend on the 4-hour chart. We can clearly see that this morning's dip has essentially broken below this trend line.
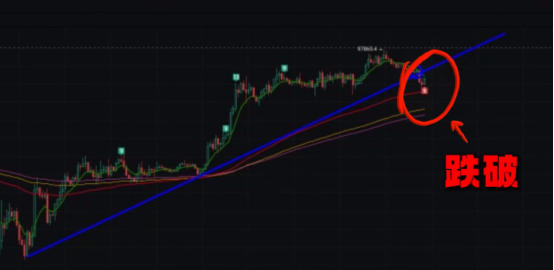
Breaking below does not mean that this trend has been completely invalidated. Currently, to break this trend, it must fall below the 91,500 range; ideally, it should break below the 91,500 range. Therefore, we need to focus on two key points: the first point is the support situation near 91,500, and the second point is whether it can regain the trend line after a sharp rebound. If it can stand above the trend line, we will continue to look for long positions. If it cannot regain the trend line, we have reason to short on rallies.
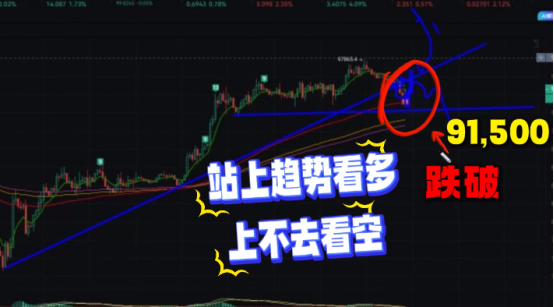
Below, we need to watch the 91,500 range. If it falls below this range, we previously mentioned that the 80,000-90,000 range is a significant area, as there has been a futures gap that has not been filled. This point is a good support level to consider for entering long positions. Above, we first need to focus on the breakout situation at 98,000, and then we need to pay attention to the 98,000-100,000 round number, where the 100,000 round number is a relatively strong resistance. In the short term, Bitcoin is likely to consolidate and fluctuate within this range.
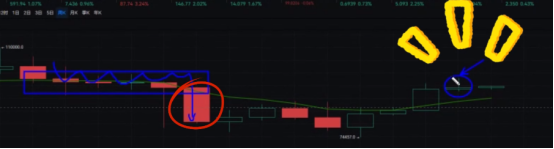
Compared to Bitcoin, Ethereum is relatively straightforward. From this 4-hour chart, it has been oscillating within this range.
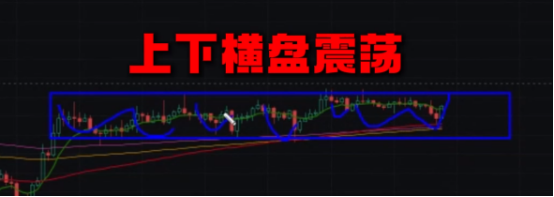
How should we trade within this oscillation range? First, we only need to short at high points and long at low points. In other words, we should buy low and sell high. The position for shorting above remains at the previously mentioned points, in the range of 1850 to 1870, where we will short on rallies.
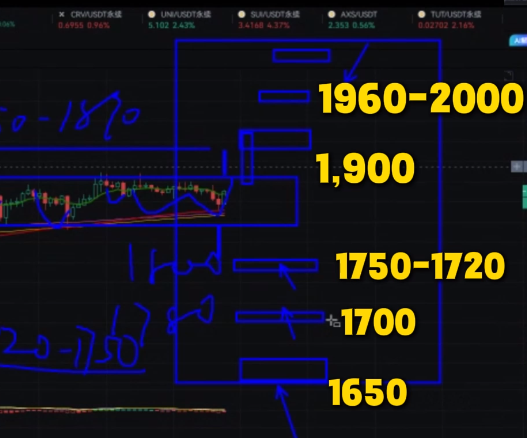
For the lower side, we can consider 1780, and further down, we focus on the range of 1720-1750 for long positions.
Once it breaks out of this range, for example, if it breaks above, we need to consider the 1,900 round number, and then the key resistance levels of 1960-2,000. In the short term, we need to consider these points for Ethereum. On the lower side, the primary focus should be on the 1750 and 1720 range, followed by 1,700, and further down, we need to consider the 1650 range.
Next, it is likely that Ethereum will consolidate and oscillate within this range. We only need to position our long or short trades around these points.
For more strategies, follow our official account: KK Strategy

免责声明:本文章仅代表作者个人观点,不代表本平台的立场和观点。本文章仅供信息分享,不构成对任何人的任何投资建议。用户与作者之间的任何争议,与本平台无关。如网页中刊载的文章或图片涉及侵权,请提供相关的权利证明和身份证明发送邮件到support@aicoin.com,本平台相关工作人员将会进行核查。


