In trading, short-term trading and long-term trading are two distinctly different strategies, with significant differences in time cycles, risk-return characteristics, and operational methods. Below is a comparison of the advantages and disadvantages of both, along with an analysis of their core differences:
1. Short-term Trading (short-term holding, usually from minutes to days)
Advantages:
Quick Profits:
By capturing short-term price fluctuations, it is possible to accumulate profits in a short time (such as day trading or swing trading).Avoid Systematic Risks:
The short holding period can reduce the impact of sudden events (such as policy changes or black swan events) on positions.High Capital Flexibility:
Quick capital turnover allows for rapid switching of targets or adjustment of strategies.Many Opportunities:
The market experiences frequent short-term fluctuations, theoretically providing trading opportunities every day.
Disadvantages:
High Transaction Costs:
Frequent trading leads to significant increases in fees and slippage costs, eroding profits.High Psychological Pressure:
Requires real-time monitoring, with a high demand for emotional control, making it easy to make wrong decisions due to short-term fluctuations.High Technical Requirements:
Relies on technical analysis, market feel, and quick reaction ability, which is not friendly to beginners.Unstable Returns:
Short-term fluctuations are highly random, making it difficult to guarantee long-term win rates, and there may be consecutive losses.
2. Long-term Trading (long-term holding, usually from months to years)
Advantages:
Reduced Trading Frequency:
Fewer operations save on fees and energy, suitable for non-professional investors.Compound Interest Effect:
Long-term holding of quality assets (such as stocks, cryptocurrencies, etc.) allows for enjoying compound growth and trend dividends.High Tolerance for Errors:
Does not require precise judgment of short-term fluctuations, focusing more on fundamentals or long-term trends, allowing for mid-course adjustments.Low Psychological Pressure:
No need for frequent monitoring, suitable for patient investors who can withstand fluctuations.
Disadvantages:
High Opportunity Cost:
Long-term capital occupation may lead to missing other short-term opportunities.High Drawdown Risk:
Long-term holdings must endure periodic market fluctuations, which may result in significant unrealized losses.Dependence on Fundamental Analysis:
Requires in-depth research into industries, macroeconomics, or project value, demanding high information acquisition capabilities.High Time Threshold:
Requires waiting for trends to form, which may take months or even years to realize profits.
3. Core Differences
Dimension
Short-term Trading
Long-term Trading
Time Cycle
Minutes to days
Months to years
Analysis Method
Primarily technical analysis (candlesticks, indicators, volume-price)
Primarily fundamental analysis (valuation, industry trends)
Risk Characteristics
High-frequency low-amplitude fluctuation risk
Low-frequency high-amplitude systematic risk
Source of Returns
Short-term supply-demand imbalance in the market
Long-term value growth of assets
Suitable Audience
Professional traders with ample time and quick reactions
Investors with patience and research capabilities
4. Strategy Selection Recommendations
Combine Personal Resources:
If time is limited and stability is sought, long-term trading is more suitable; if skilled in technical analysis and able to withstand pressure, short-term trading can be attempted.Market Environment Adaptation:
A volatile market is suitable for short-term high buy-low sell strategies, while a trending market is suitable for long-term holdings.Mixed Strategy:
Allocate part of the capital for long-term investments (such as value investing) and part for short-term arbitrage to diversify risks.
Key Reminder: Regardless of the chosen strategy, it is essential to strictly formulate a trading plan, set stop-losses, and avoid being driven by emotions. Short-term trading requires caution against overtrading, while long-term trading must be wary of "value traps" (assets that appear undervalued but have deteriorating fundamentals).
5.6 Night Market Analysis and Strategy Recommendations
【Bitcoin Price Trend Analysis】
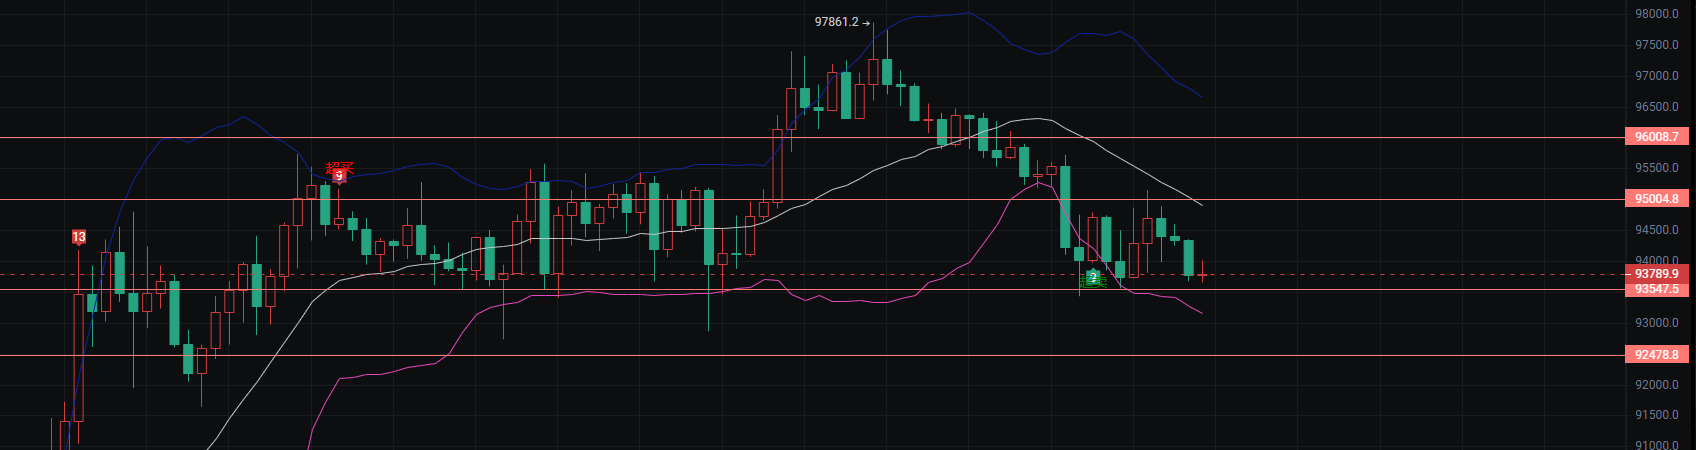
- Candlestick Patterns:
Recent candlesticks show a high-level consolidation pattern, with prices fluctuating between 94,000 and 95,000.
The daily chart shows consecutive bearish candles, indicating heavy selling pressure in the market.
Technical Indicators:
MACD: The 4-hour MACD is in the negative zone, with the fast and slow lines continuing to diverge downwards, indicating that bearish forces dominate in the short term.
RSI: The RSI hovers around 39, not entering the oversold zone but below the neutral level of 50, indicating a weak market.
EMA: The current price is close to the EMA7 moving average; if it breaks below, it may further test the EMA30 support. The EMA120 is far from the current price, maintaining an upward long-term trend.
【Buy and Sell Points】
Buy Point One: 93,500 (near the previous swing low, likely to generate buying support)
Buy Point Two: 92,500 (near an integer level, also close to the EMA120 support)
Long Position Stop-Loss: 92,000 (to guard against breaking below key support)
Sell Point One: 95,000 (integer level resistance, upper boundary of recent high-level consolidation)
Sell Point Two: 96,000 (previous high selling pressure position, market may experience a pullback)
Short Position Stop-Loss: 96,500 (slightly above Sell Point Two, to guard against further rises after a breakout)
【Ethereum Price Trend Analysis】
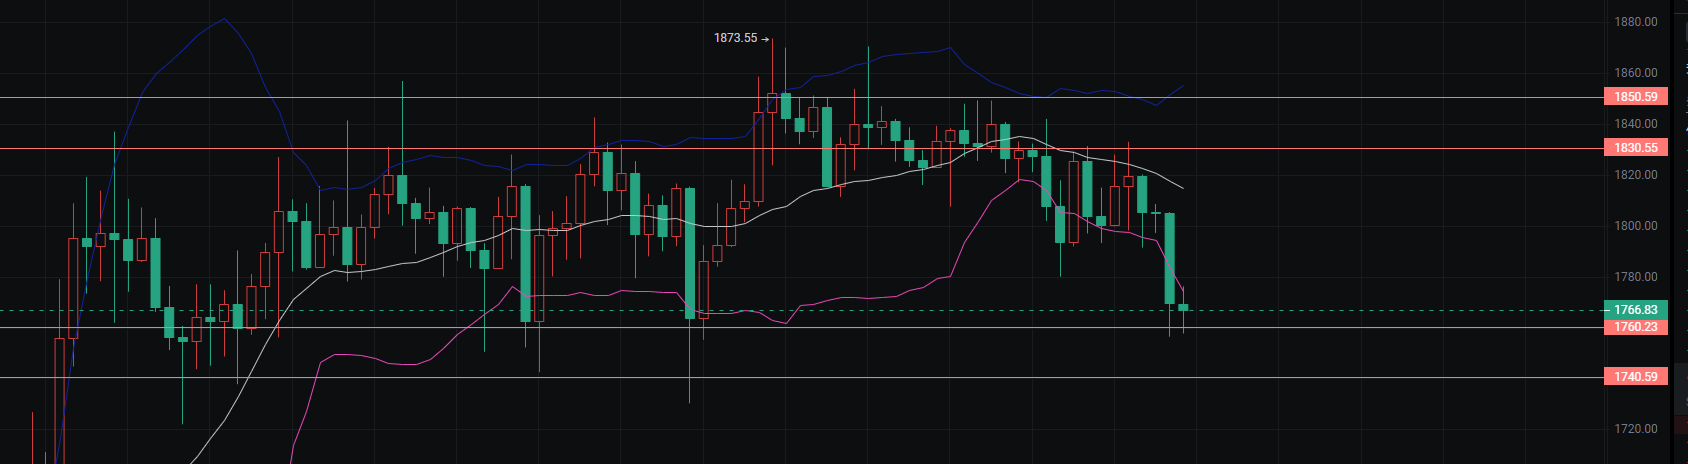
- Candlestick Patterns:
Recent prices fluctuate between 1,800 and 1,850, forming a consolidation pattern.
In the 4-hour cycle, multiple long upper and lower shadows appear, indicating strong selling pressure and buying interest in the market.
Technical Indicators:
MACD: The current MACD is in the negative zone, with both DIF and DEA trending downwards, indicating some short-term bearish pressure.
RSI: The RSI value hovers around 45, not entering the overbought or oversold zones, indicating that the market currently lacks a clear trend direction.
EMA: The EMA7 has fallen below the EMA30 but remains above the EMA120, indicating short-term weakness but maintaining an upward long-term trend.
The trading volume in the 4-hour cycle has not changed significantly, indicating strong market wait-and-see sentiment.
【Buy and Sell Points】
Buy Point One: 1,760 (near the previous swing low, integer support level)
Buy Point Two: 1,740 (close to the EMA120 support, further probing towards integer support)
Long Position Stop-Loss: 1,720 (to guard against breaking below key support)
Sell Point One: 1,830 (near the previous swing high, integer resistance level)
Sell Point Two: 1,850 (upper boundary of recent consolidation, further testing resistance)
Short Position Stop-Loss: 1,870 (to guard against breaking through key resistance)
【The above analysis and strategies are for reference only. Risks are to be borne by the reader. The article's review and publication may have delays, and the strategies may lack timeliness. Specific operations should follow the real-time strategies of Bitcoin Bear.】

(Note: 📣 Due to the limited timeliness and depth of information on public platforms, the market changes rapidly. Key turning points, precise operational strategies, and sudden risk alerts need to be synchronized in real-time on (public account - Bitcoin Bear). Here, you can obtain: real-time strategy push, in-depth analysis support, interactive Q&A, risk warnings, and optimization suggestions for personal holdings. 🚨 Remember: The market always rewards those who act faster and have more accurate information! Be a winner among the minority.)
免责声明:本文章仅代表作者个人观点,不代表本平台的立场和观点。本文章仅供信息分享,不构成对任何人的任何投资建议。用户与作者之间的任何争议,与本平台无关。如网页中刊载的文章或图片涉及侵权,请提供相关的权利证明和身份证明发送邮件到support@aicoin.com,本平台相关工作人员将会进行核查。


