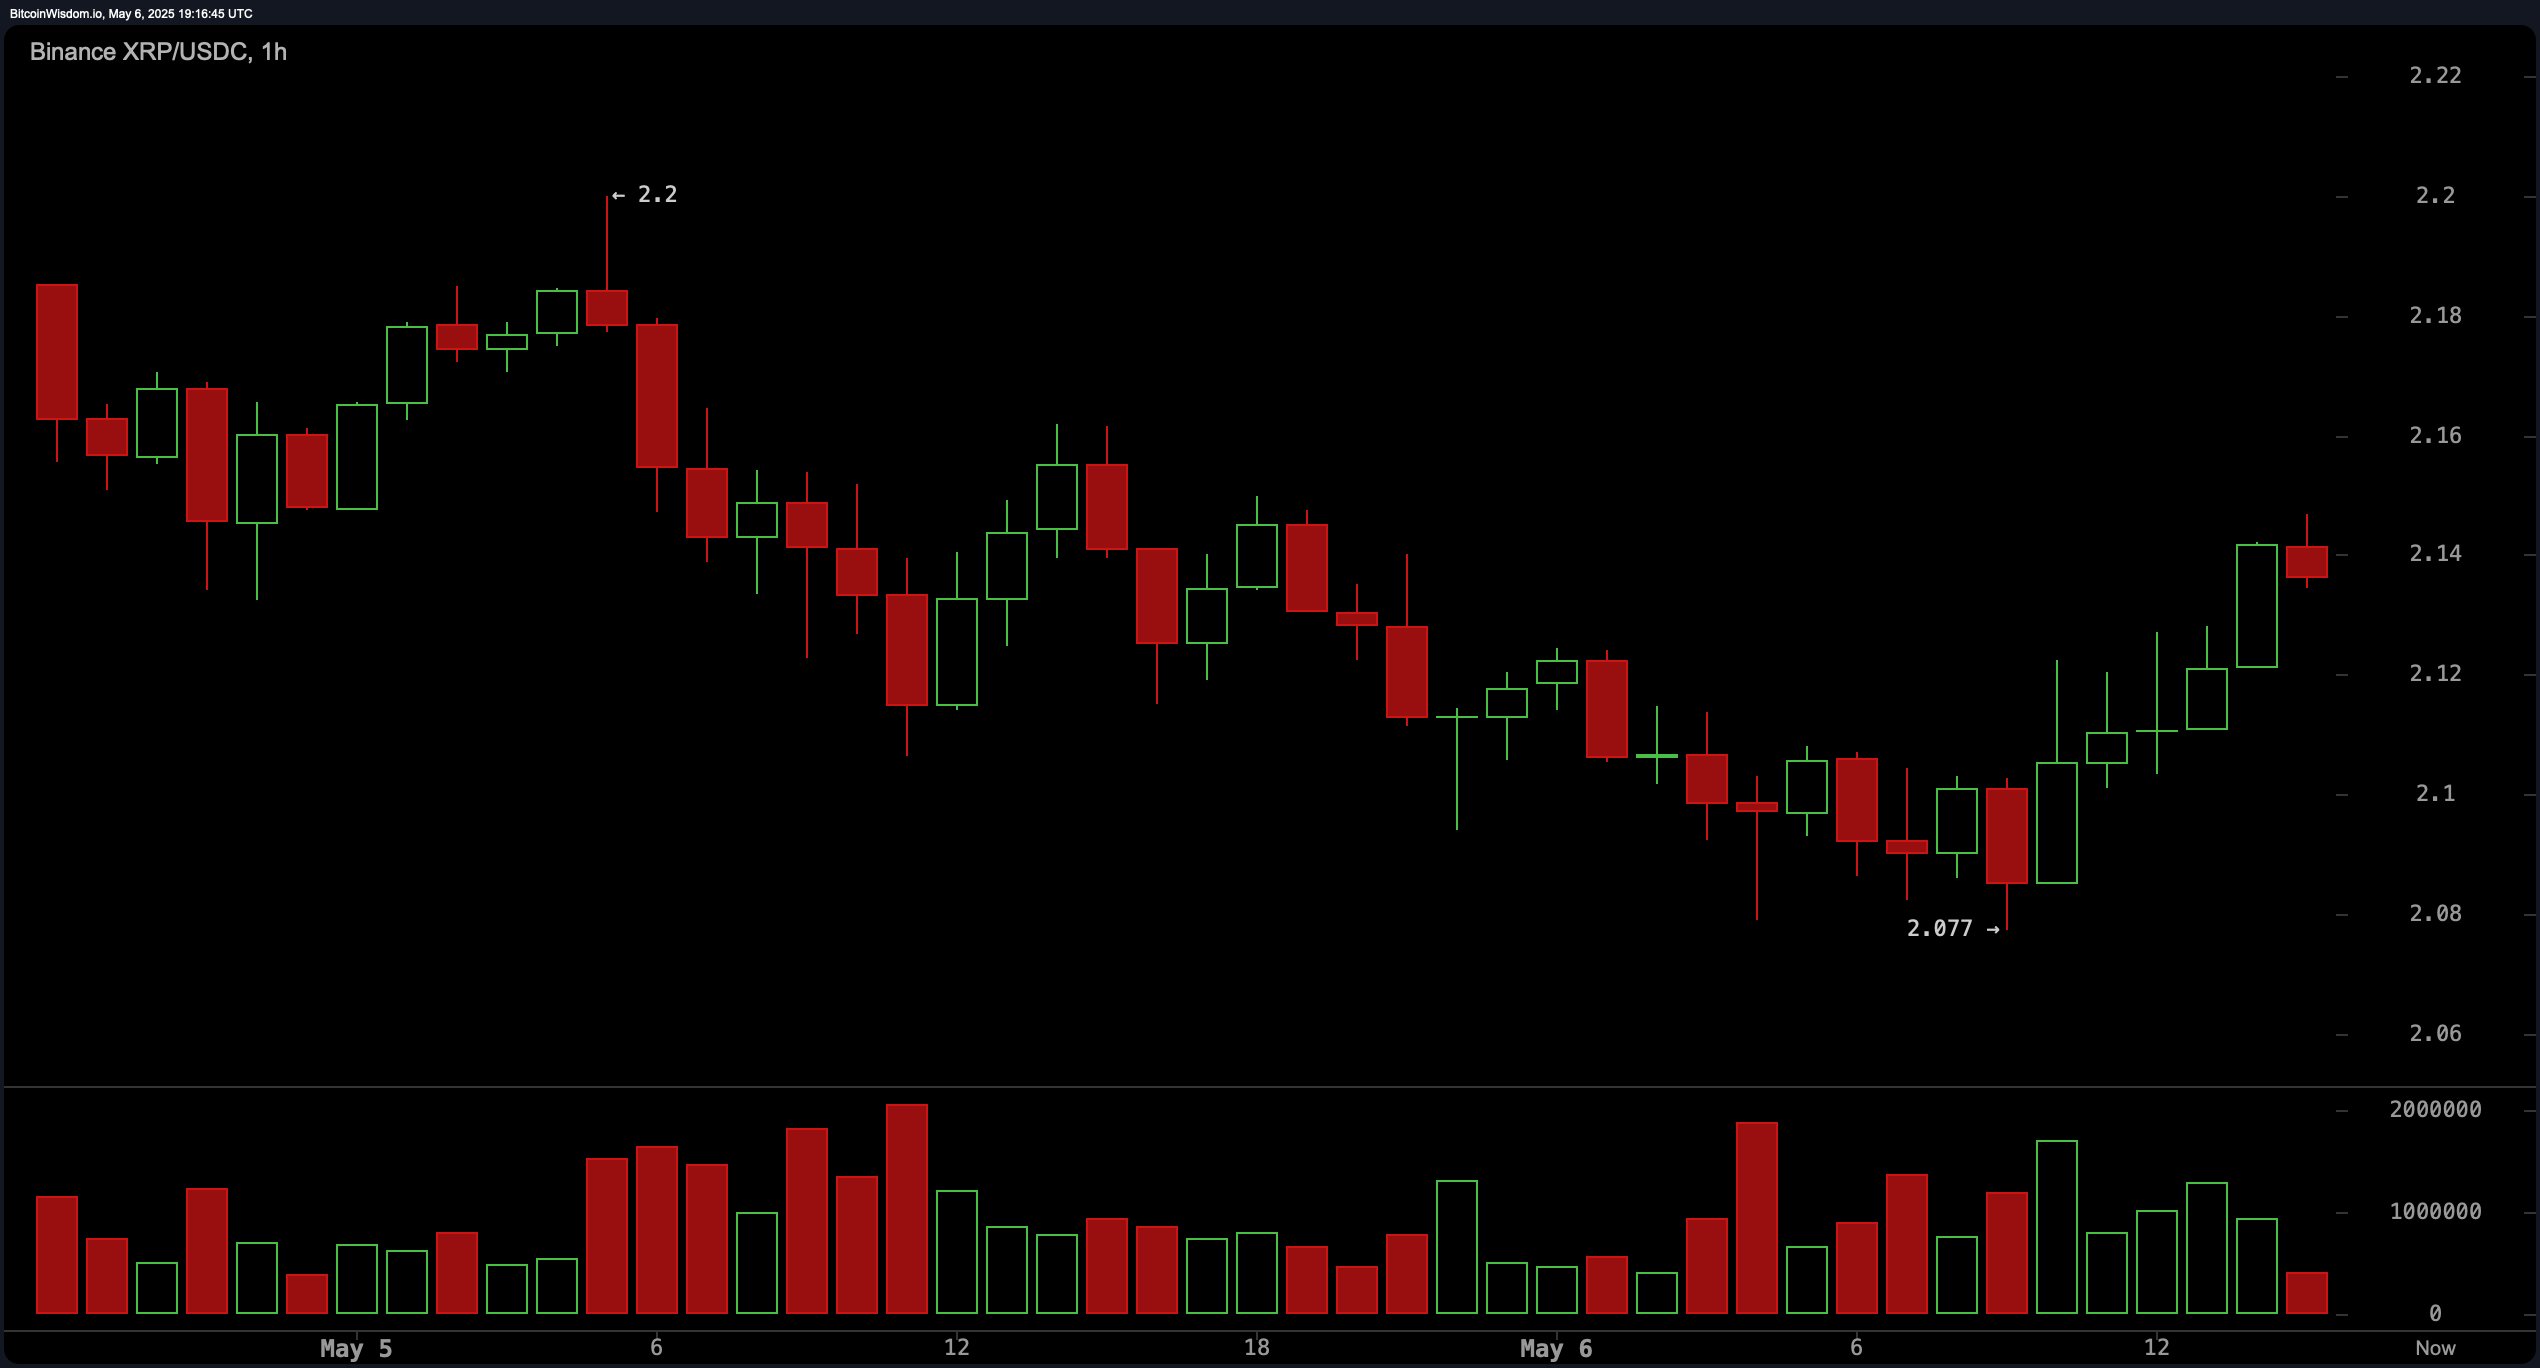
On the 1-hour chart, XRP has shown a modest recovery from a recent low of $2.077, moving up toward $2.14. This short-term rally is supported by a noticeable increase in buying pressure, especially visible in green candle volumes. The formation of a potential rounded bottom pattern suggests that bullish sentiment may be gathering traction. Entry signals were identified in the $2.09–$2.10 range, with traders now watching for minor pullbacks to reinforce support. Upside exits are targeted near $2.15 to $2.17, with trailing stops advised once the price exceeds $2.16.

XRP/USDC via Binance on May 6, 2025. 1-hour chart.
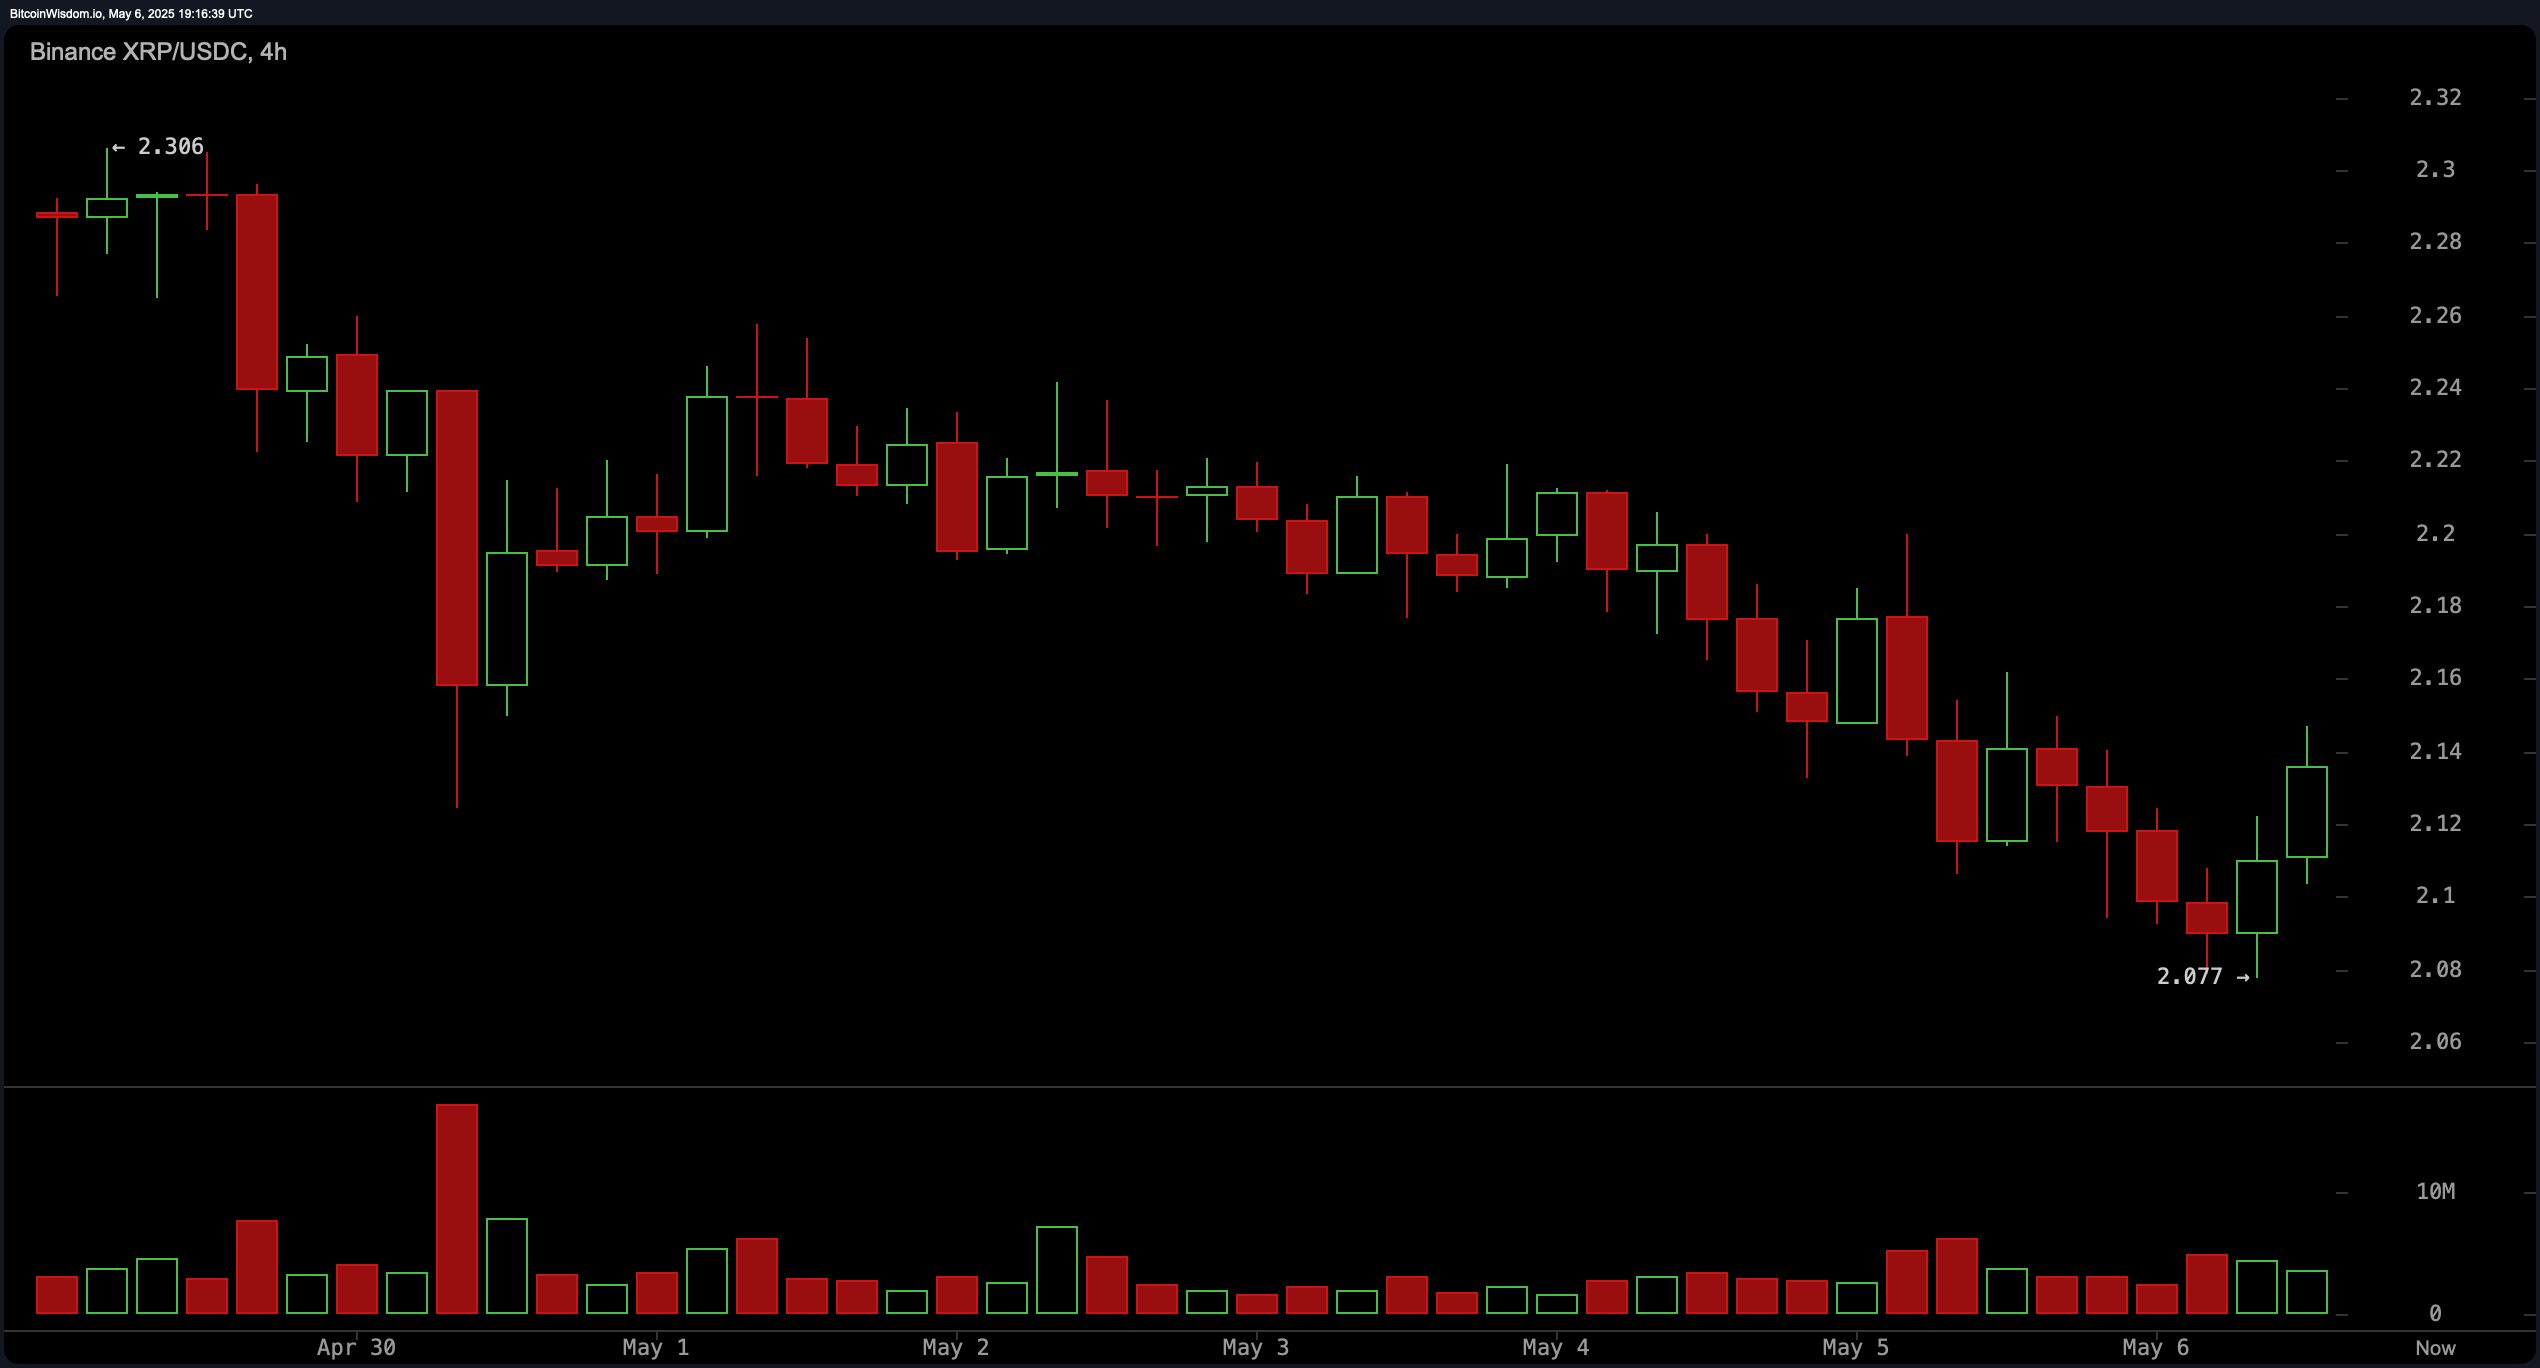
Shifting to the 4-hour chart, the price action reveals a descending channel structure, characterized by lower highs and lower lows. XRP found crucial support near $2.077 and is currently testing the upper resistance boundary of the channel. Volume has slightly increased in tandem with the bounce attempt, indicating some buyer re-engagement. A sustained breakout above the $2.15–$2.16 resistance band, coupled with rising volume, would provide a more robust bullish confirmation. Conversely, failure to clear this level and the formation of another lower high would likely renew downward pressure.

XRP/USDC via Binance on May 6, 2025. 4-hour chart.
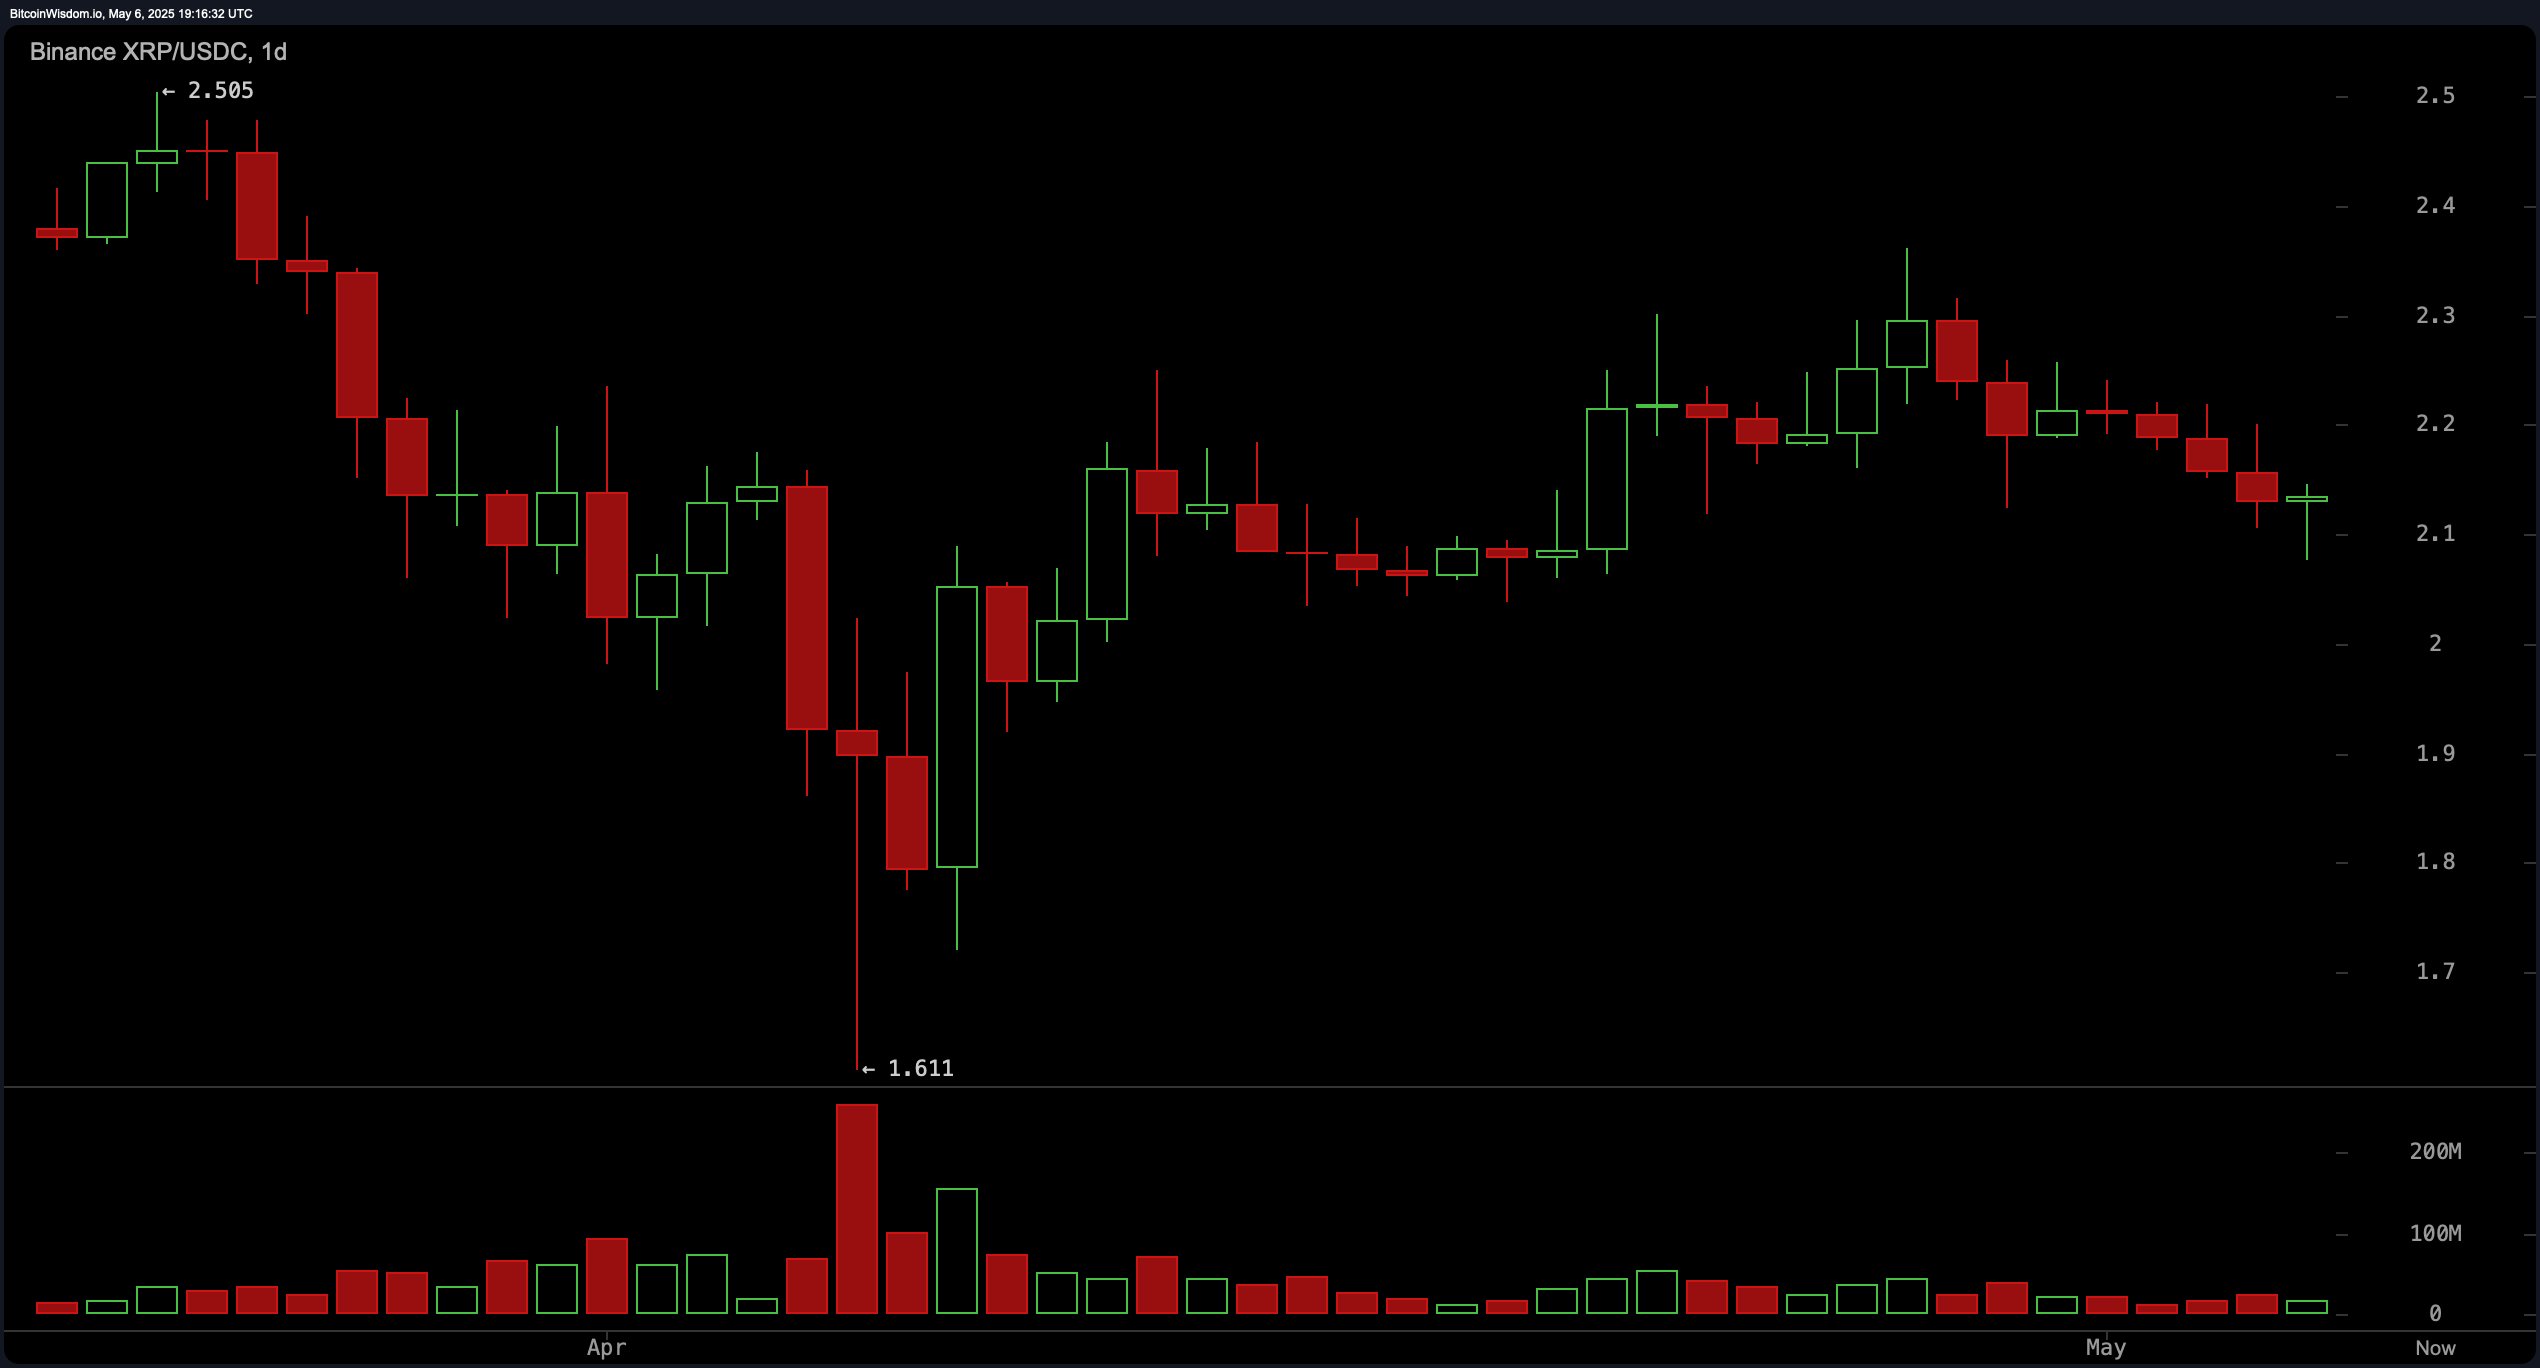
The daily chart analysis points to a longer-term bearish trend, following a steep decline from approximately $2.50 to a bottom of $1.611 in April. The market subsequently entered a gradual recovery phase, peaking near $2.30 in late April before softening again. Support remains firm in the $2.05–$2.10 zone, while resistance lies between $2.30 and $2.35. Despite recent rebounds, XRP’s failure to decisively surpass the $2.16–$2.17 resistance area could undermine bullish momentum. Traders are advised to watch for a volume-backed move above $2.10 as a signal for potential entries, with exit targets set around $2.30 if bullish strength persists.

XRP/USDC via Binance on May 6, 2025. Daily chart.
Oscillator data presents a broadly neutral sentiment. The relative strength index (RSI) stands at 46.69, indicating neither overbought nor oversold conditions. The Stochastic oscillator is at 24.82, and the commodity channel index (CCI) at -63.40, both supporting the neutral stance. The average directional index (ADX) at 11.69 signals weak trend strength, while the Awesome oscillator remains flat at 0.05813. However, two indicators deviate: the momentum indicator at -0.05607 suggests mild bearishness, and the moving average convergence divergence (MACD) level of 0.00578 also issues a bearish signal, underscoring caution despite short-term rebounds.
A review of moving averages highlights a broadly bearish bias across shorter time frames. The exponential moving averages (EMA) for 10, 20, and 30 periods — at $2.17372, $2.16915, and $2.17034, respectively — all reflect ugly signals, as do the corresponding simple moving averages (SMA) at $2.20151, $2.17045, and $2.12368, although the 30-period SMA signals bullishness. Longer-term averages such as the 200-period EMA ($1.99606) and SMA ($2.07370) flash prettier signals too, implying that the current price is still holding above major support zones. Mid-range averages from the 50- and 100-period metrics remain bearish, suggesting prevailing downward pressure unless a breakout occurs. These mixed signals emphasize a technical landscape in flux, with short-term rallies facing medium-term resistance.
Bull Verdict:
XRP is showing early signs of recovery from its recent bottom at $2.077, supported by short-term bullish formations and buy signals on longer-term moving averages like the 200-period exponential and simple moving averages. If XRP maintains support above $2.10 and breaks through the $2.16 resistance with volume, a move toward $2.30 is plausible in the short to mid-term.
Bear Verdict:
Despite a brief rebound, the overall trend remains pressured by a descending channel on the 4-hour chart and a broadly bearish configuration of short- to mid-term moving averages. Oscillators such as momentum and the moving average convergence divergence (MACD) issue sell signals, indicating that a failure to surpass $2.16 could renew the downtrend toward prior support levels.
Final Verdict:
XRP currently sits at a technical crossroads. While short-term indicators offer glimpses of recovery, the prevailing sentiment across oscillators and moving averages favors caution. Until a definitive breakout above $2.16 is confirmed with strong volume, the outlook remains neutral with a bearish lean. Traders should prepare for a binary outcome hinged on near-term price action at resistance.
免责声明:本文章仅代表作者个人观点,不代表本平台的立场和观点。本文章仅供信息分享,不构成对任何人的任何投资建议。用户与作者之间的任何争议,与本平台无关。如网页中刊载的文章或图片涉及侵权,请提供相关的权利证明和身份证明发送邮件到support@aicoin.com,本平台相关工作人员将会进行核查。


