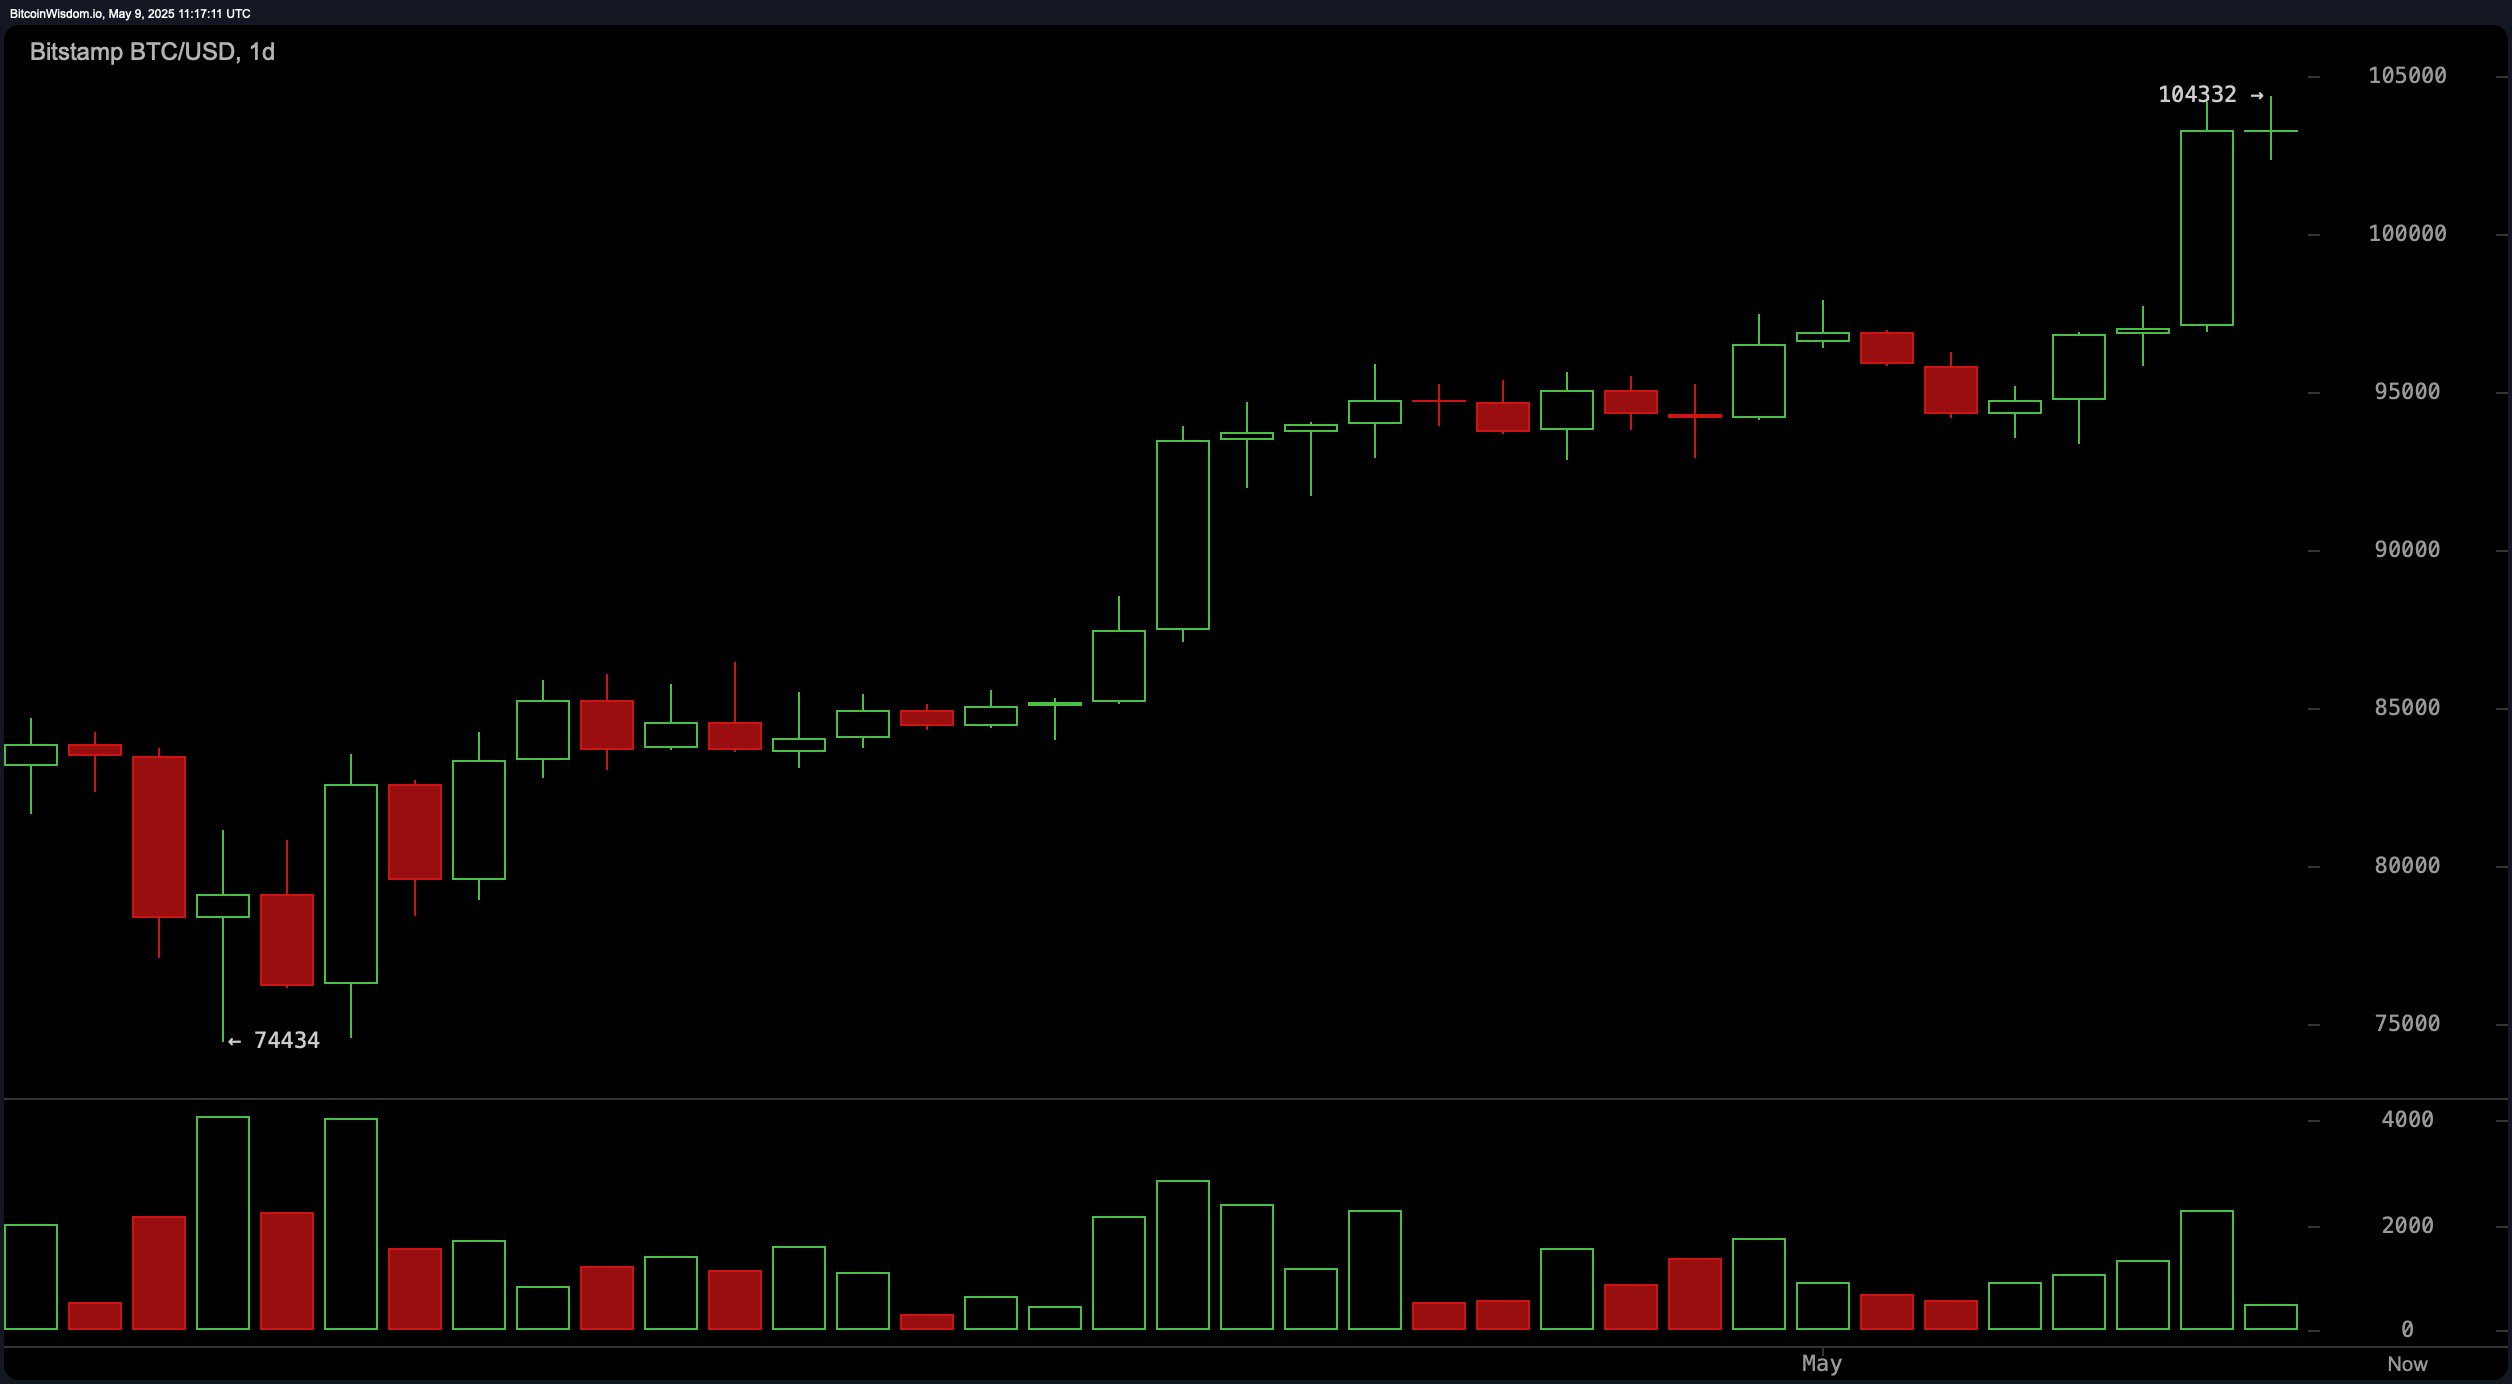
The daily chart indicates a clear bullish breakout, with bitcoin (BTC) rising from approximately $95,000 to its current high. The volume spike during this movement confirms strong upward momentum. Resistance is established at $104,332, while support is observed around the prior consolidation zone of $95,000. Analysts suggest that a favorable entry might present itself on a retest near $97,000 to $98,500, especially if accompanied by bullish candlestick formations such as a hammer or doji with significant volume.

BTC/USD 1D chart via Bitstamp on May 9, 2025.
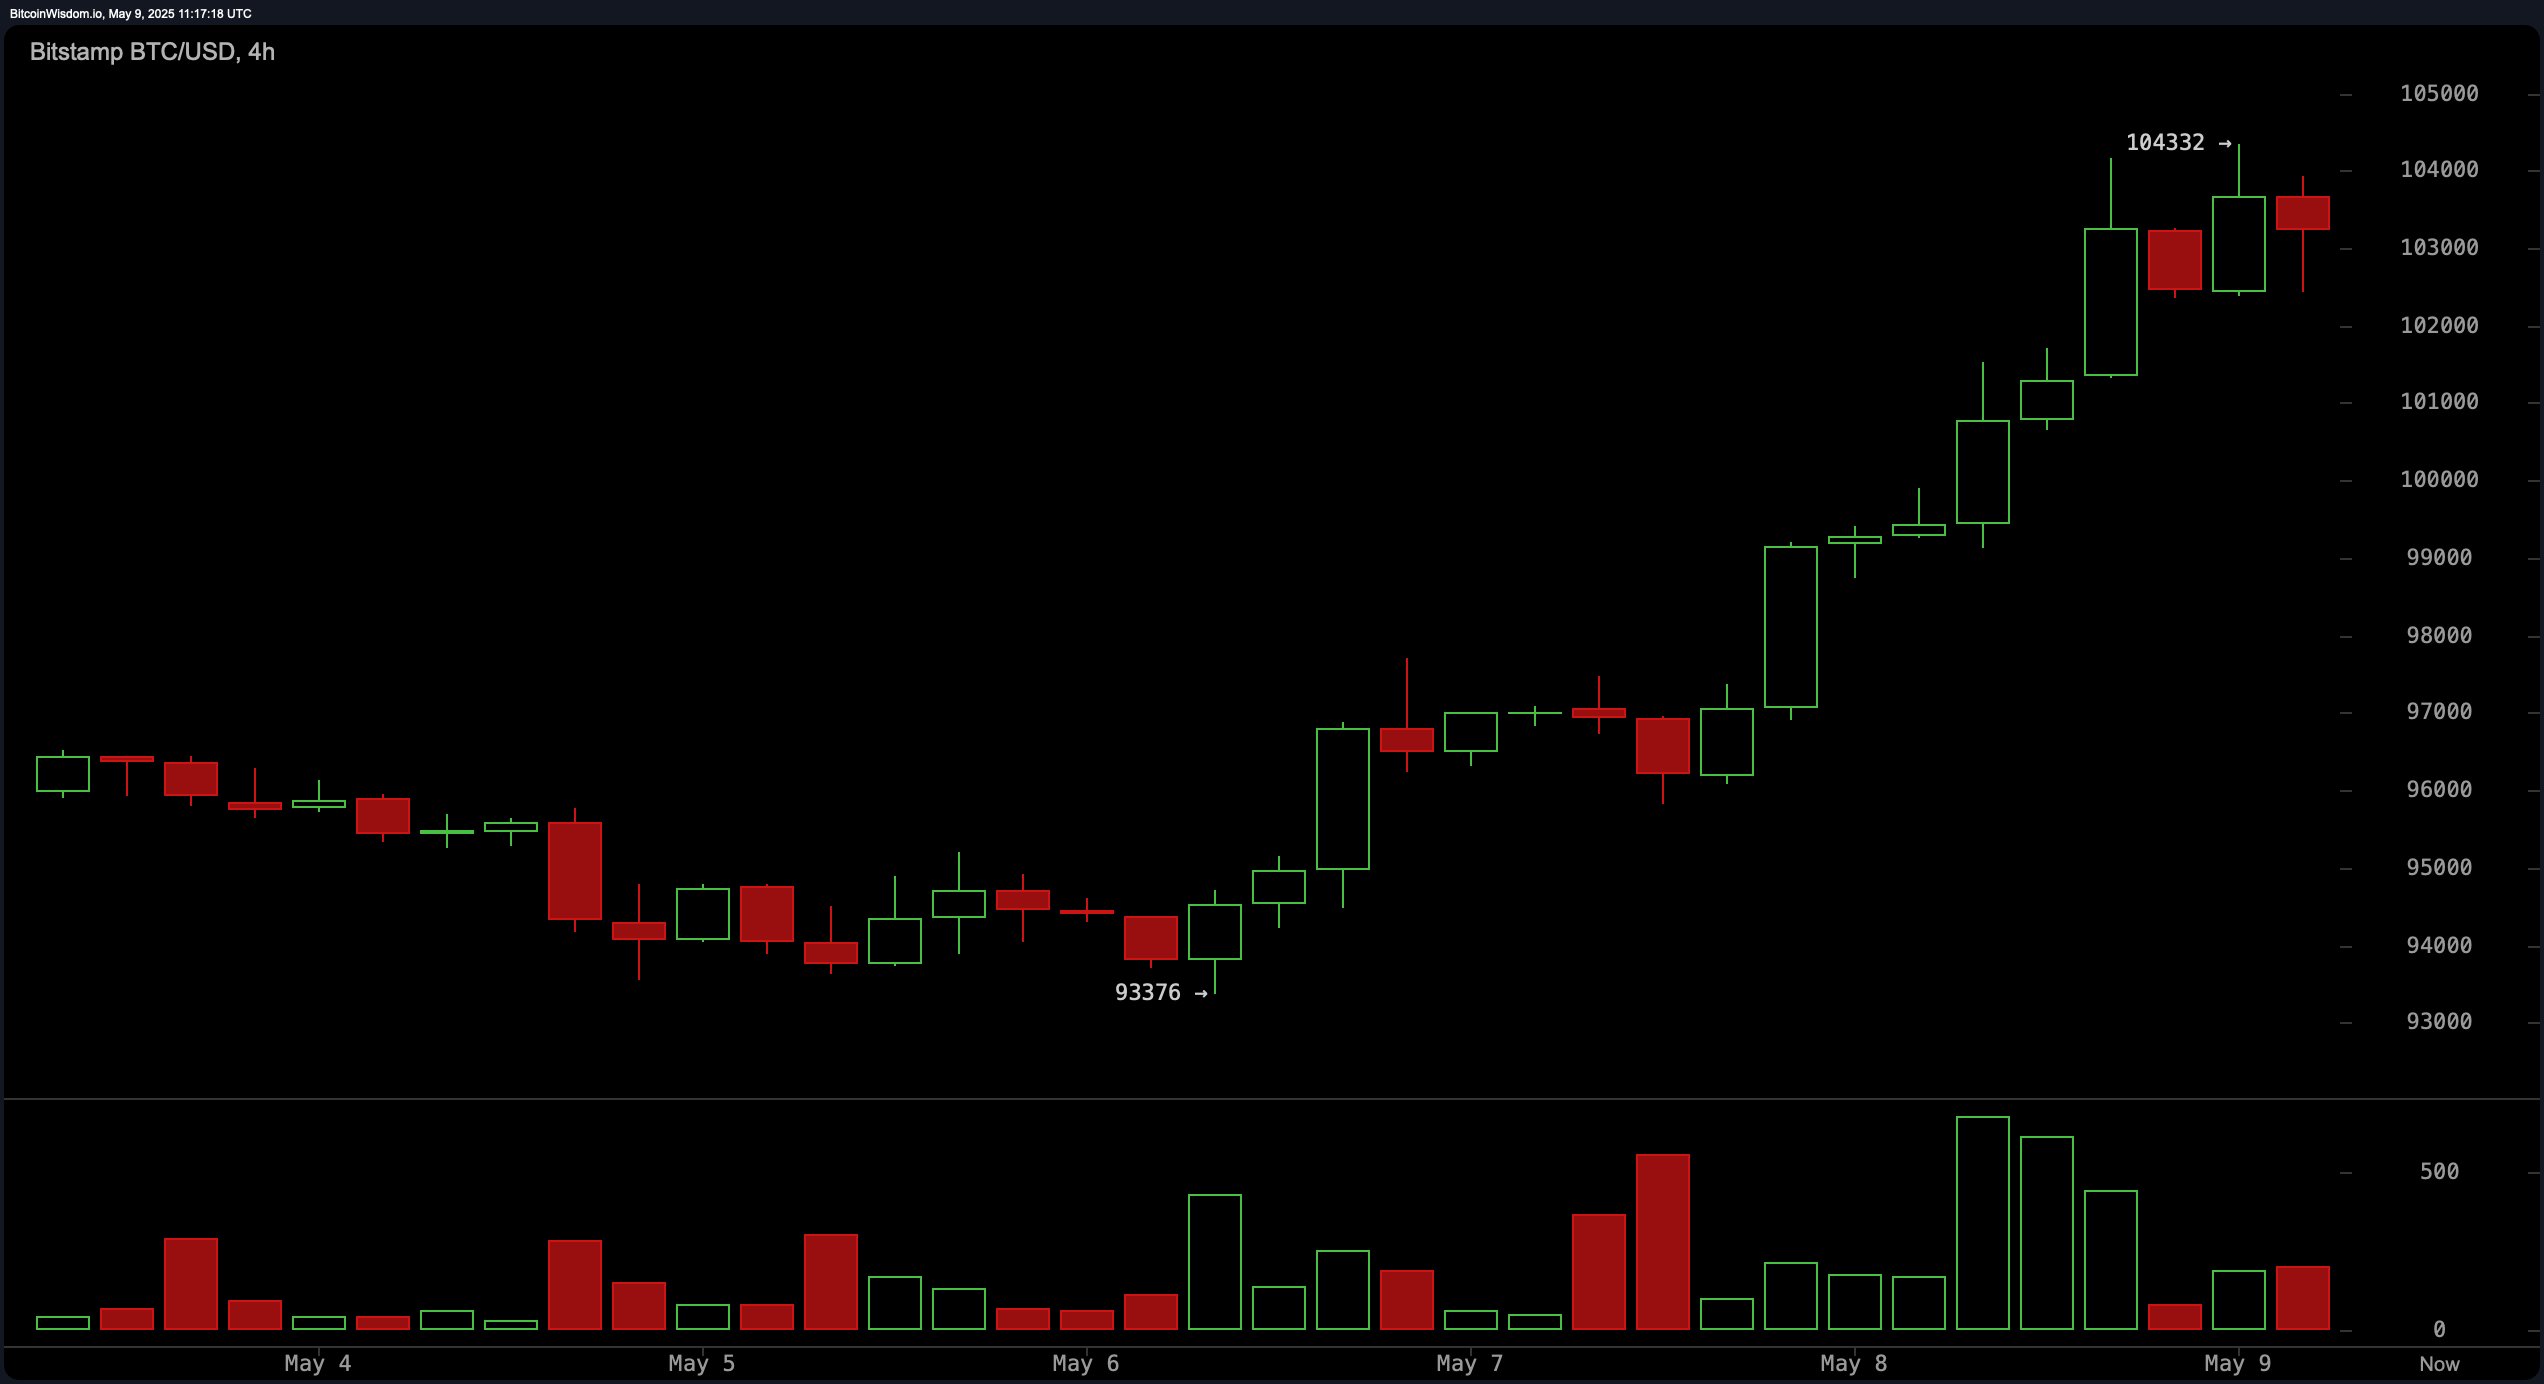
The four-hour chart reinforces the bullish continuation pattern, with price action showing stair-step advances and brief consolidation phases. After peaking at $104,332, bitcoin experienced a mild retracement, with current resistance holding firm. While the initial breakout saw a volume surge, subsequent candles indicate weaker conviction. A strategic entry near $101,000 to $102,000 is recommended, contingent on bullish confirmation such as a pin bar or engulfing candle.

BTC/USD 4H chart via Bitstamp on May 9, 2025.
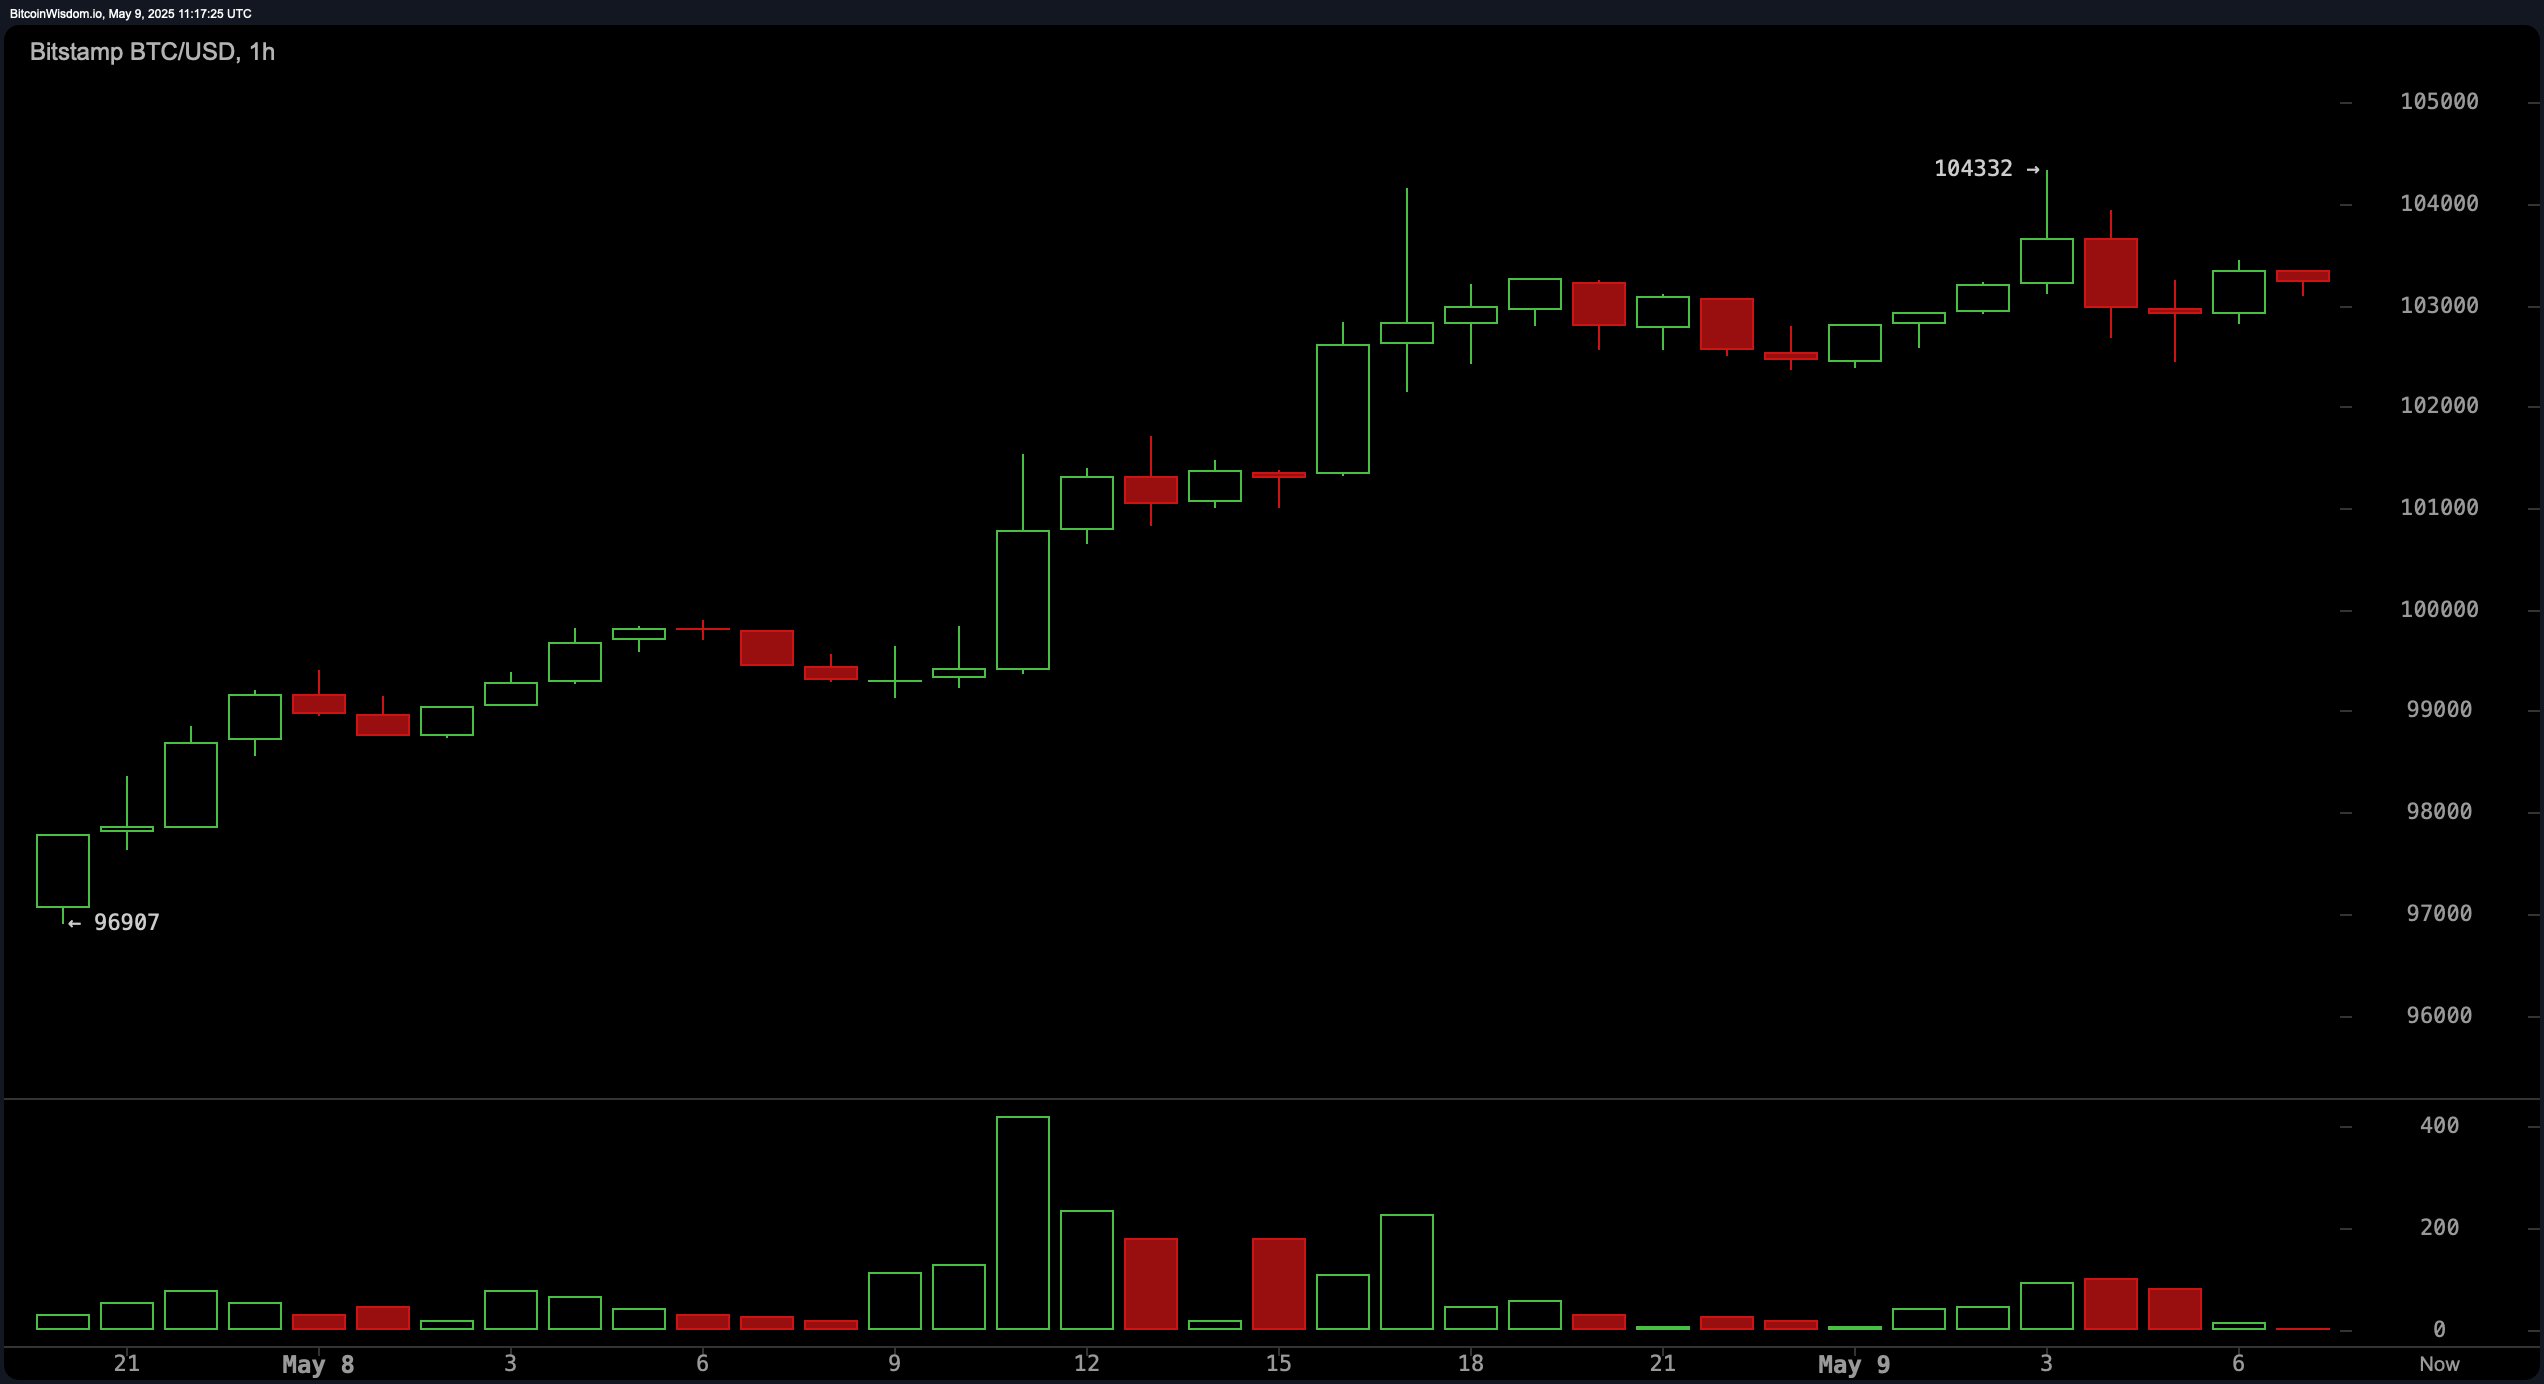
On the one-hour chart, bitcoin exhibits short-term consolidation just beneath recent highs, with a subtle bearish divergence between price and volume. The formation of lower highs suggests the development of a flag or wedge pattern. For traders focused on short timeframes, a breakout above $104,500 may offer a momentum-based opportunity with potential gains of $500 to $1,000, while a drop below $102,800 could signal a corrective phase.

BTC/USD 1H chart via Bitstamp on May 9, 2025.
Oscillators present a mixed sentiment. The relative strength index (RSI) at 76 points to overbought conditions, signaling a potential short-term sell. Both the Stochastic (89) and the commodity channel index (236) remain neutral, alongside the average directional index (33) and the Awesome oscillator (8,483), suggesting trend momentum is present but not extreme. Notably, momentum (8,946) and the moving average convergence divergence (MACD) level at 3,591 both reflect continued buying pressure.
Across the board, moving averages support the bullish trend. The exponential moving averages (EMA) and simple moving averages (SMA) across 10, 20, 30, 50, 100, and 200 periods all signal buy conditions. For instance, the EMA (10) at $97,908 and SMA (10) at $97,296 provide strong short-term support, while the longer-term EMA (200) at $86,845 and SMA (200) at $91,050 underscore sustained bullish alignment. These consistent buy signals across timeframes indicate broad market agreement on an upward momentum, albeit with caution advised near overbought thresholds and key resistance levels.
Bull Verdict:
Bitcoin remains firmly in a bullish structure across all major timeframes, supported by strong momentum indicators and consistent buy signals from moving averages. As long as the price holds above key support zones and volume sustains on upward moves, the path of least resistance remains to the upside, with the potential to test and surpass the $105,000 level in the near term.
Bear Verdict:
Despite bitcoin’s strong rally, overbought oscillator levels and fading volume post-breakout raise caution. If the price fails to break above $104,500 and instead dips below $102,800, it could trigger a broader corrective phase toward the $97,000 support zone, putting the current uptrend at risk of short-term exhaustion.
免责声明:本文章仅代表作者个人观点,不代表本平台的立场和观点。本文章仅供信息分享,不构成对任何人的任何投资建议。用户与作者之间的任何争议,与本平台无关。如网页中刊载的文章或图片涉及侵权,请提供相关的权利证明和身份证明发送邮件到support@aicoin.com,本平台相关工作人员将会进行核查。


