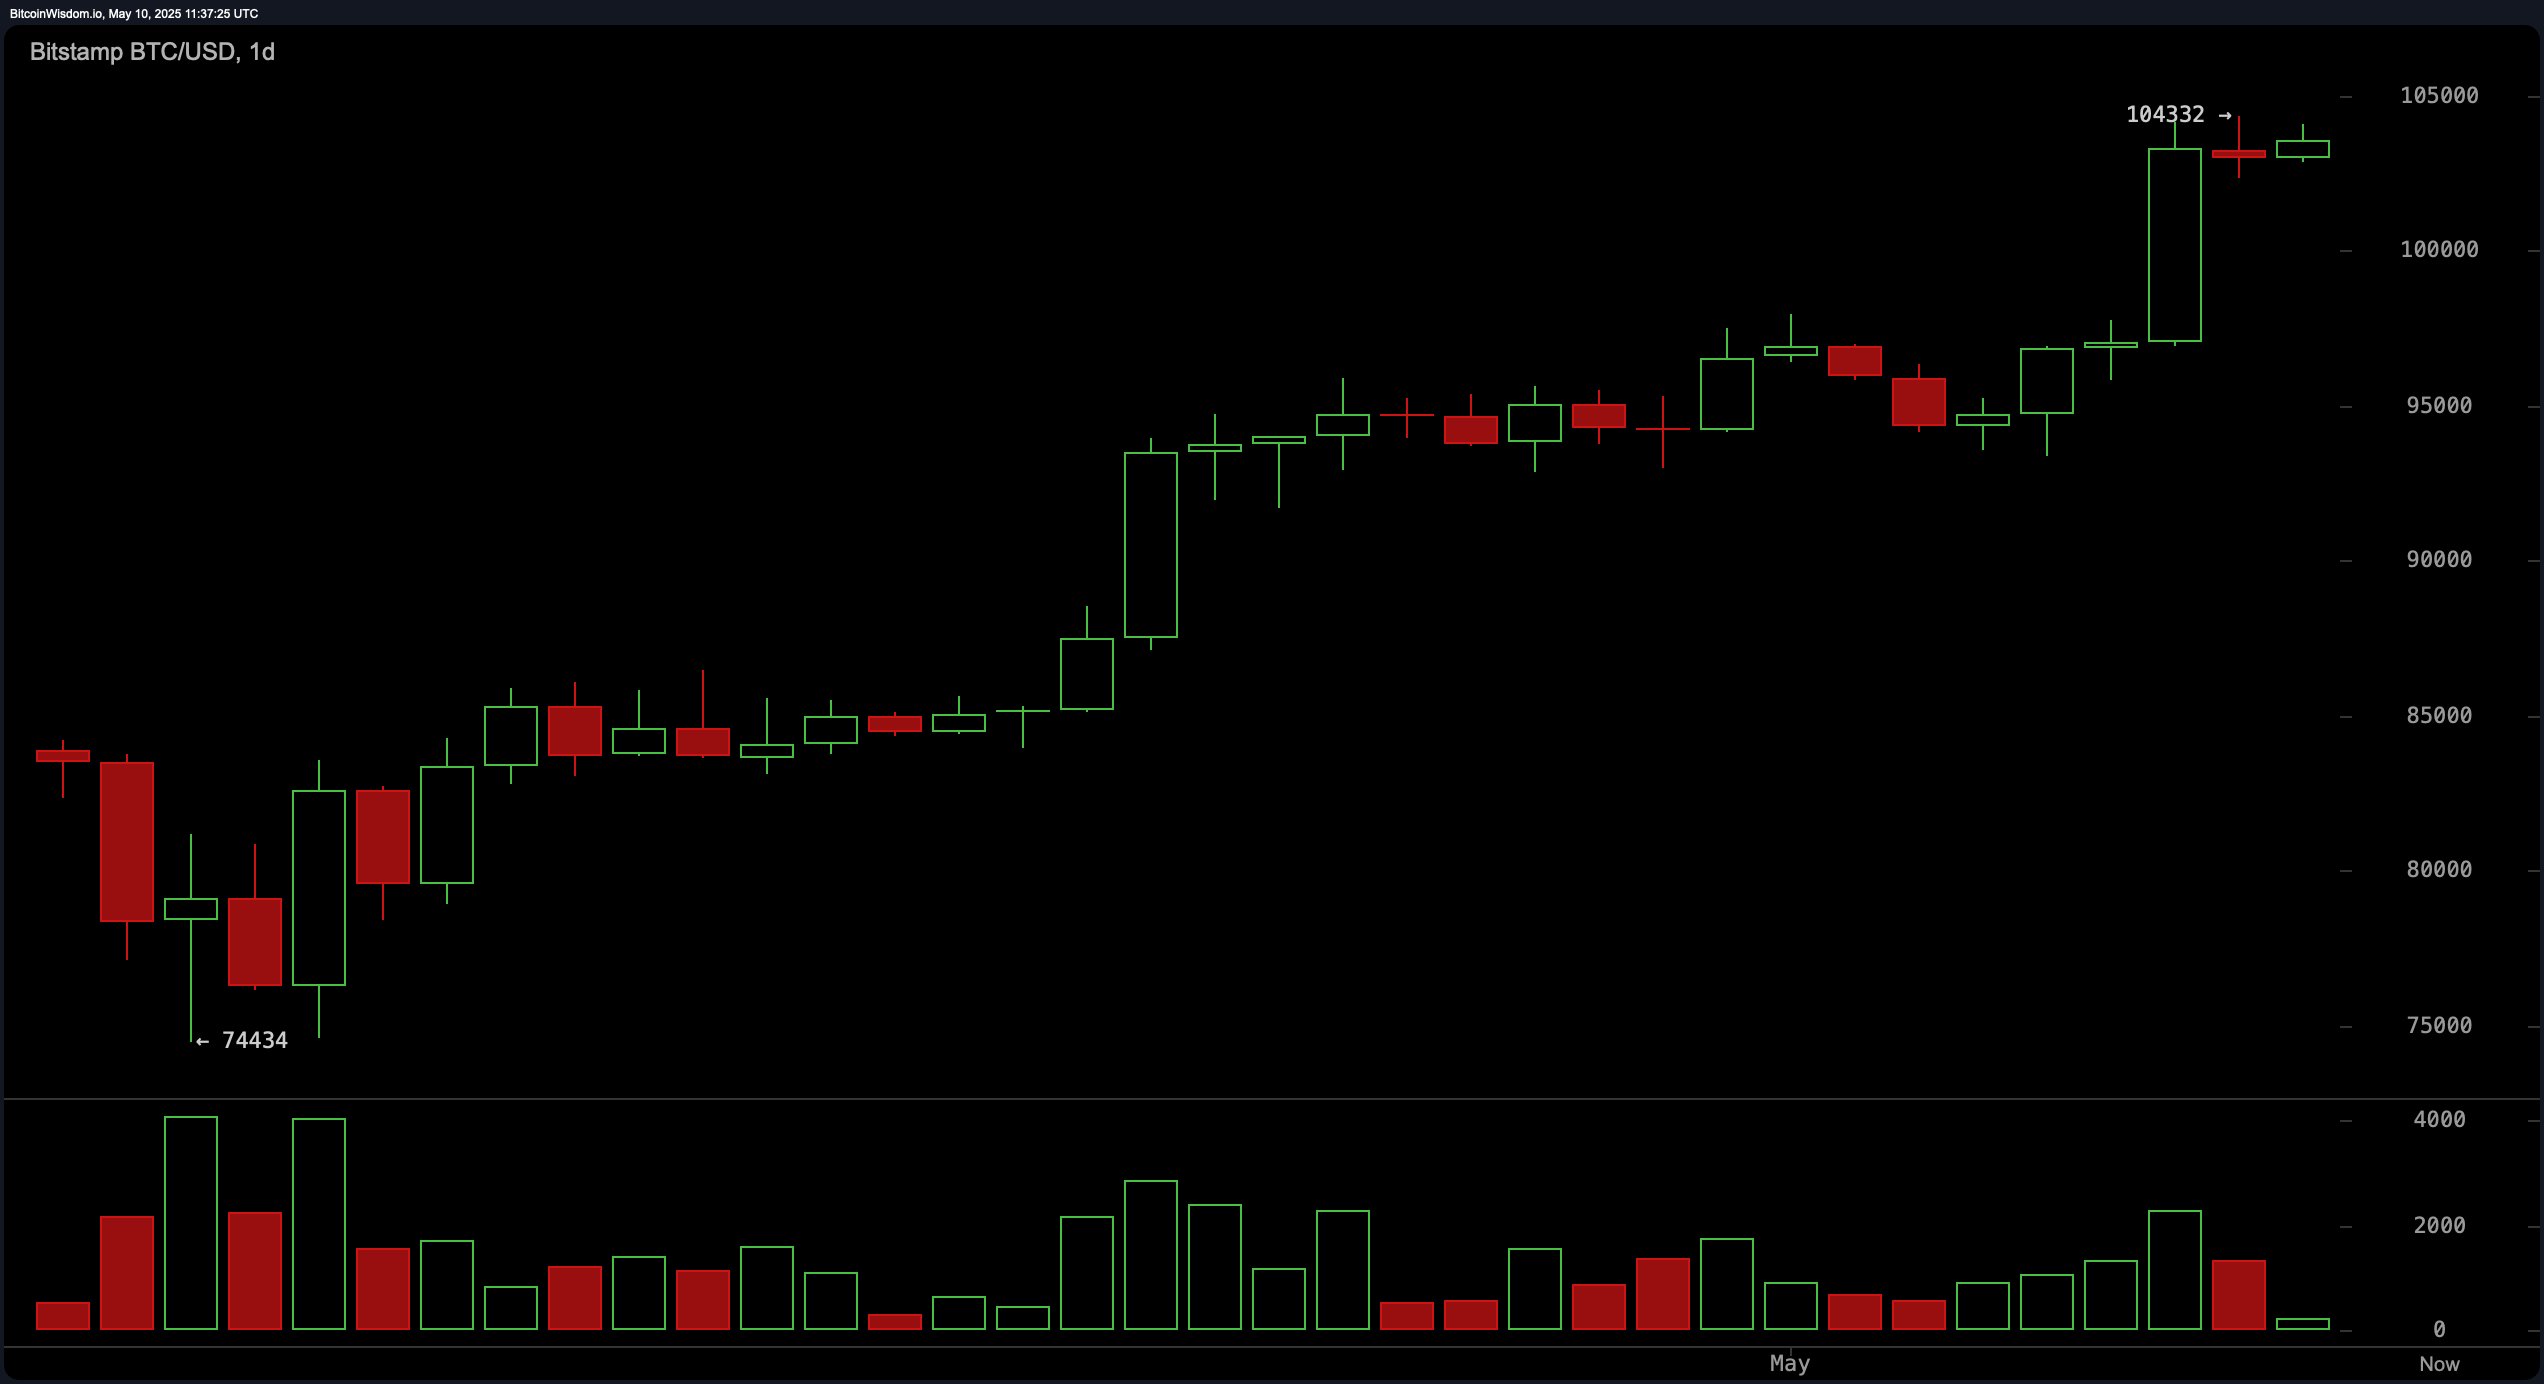
From a daily perspective, bitcoin (BTC) remains in a strong uptrend following a base near $74,434. The price has surged toward a recent high of $104,332, marking a significant resistance level. The candle structure on the daily chart, characterized by smaller-bodied candles after the breakout, indicates a possible pause or initial phase of distribution. Accompanied by increasing volume during the bullish push, this adds credence to the rally’s legitimacy. A strategic entry zone lies between $97,000 and $98,000, while a breakout above the $104,000–$105,000 range could unlock further upside.

BTC/USD 1D chart via Bitstamp on May 10, 2025.
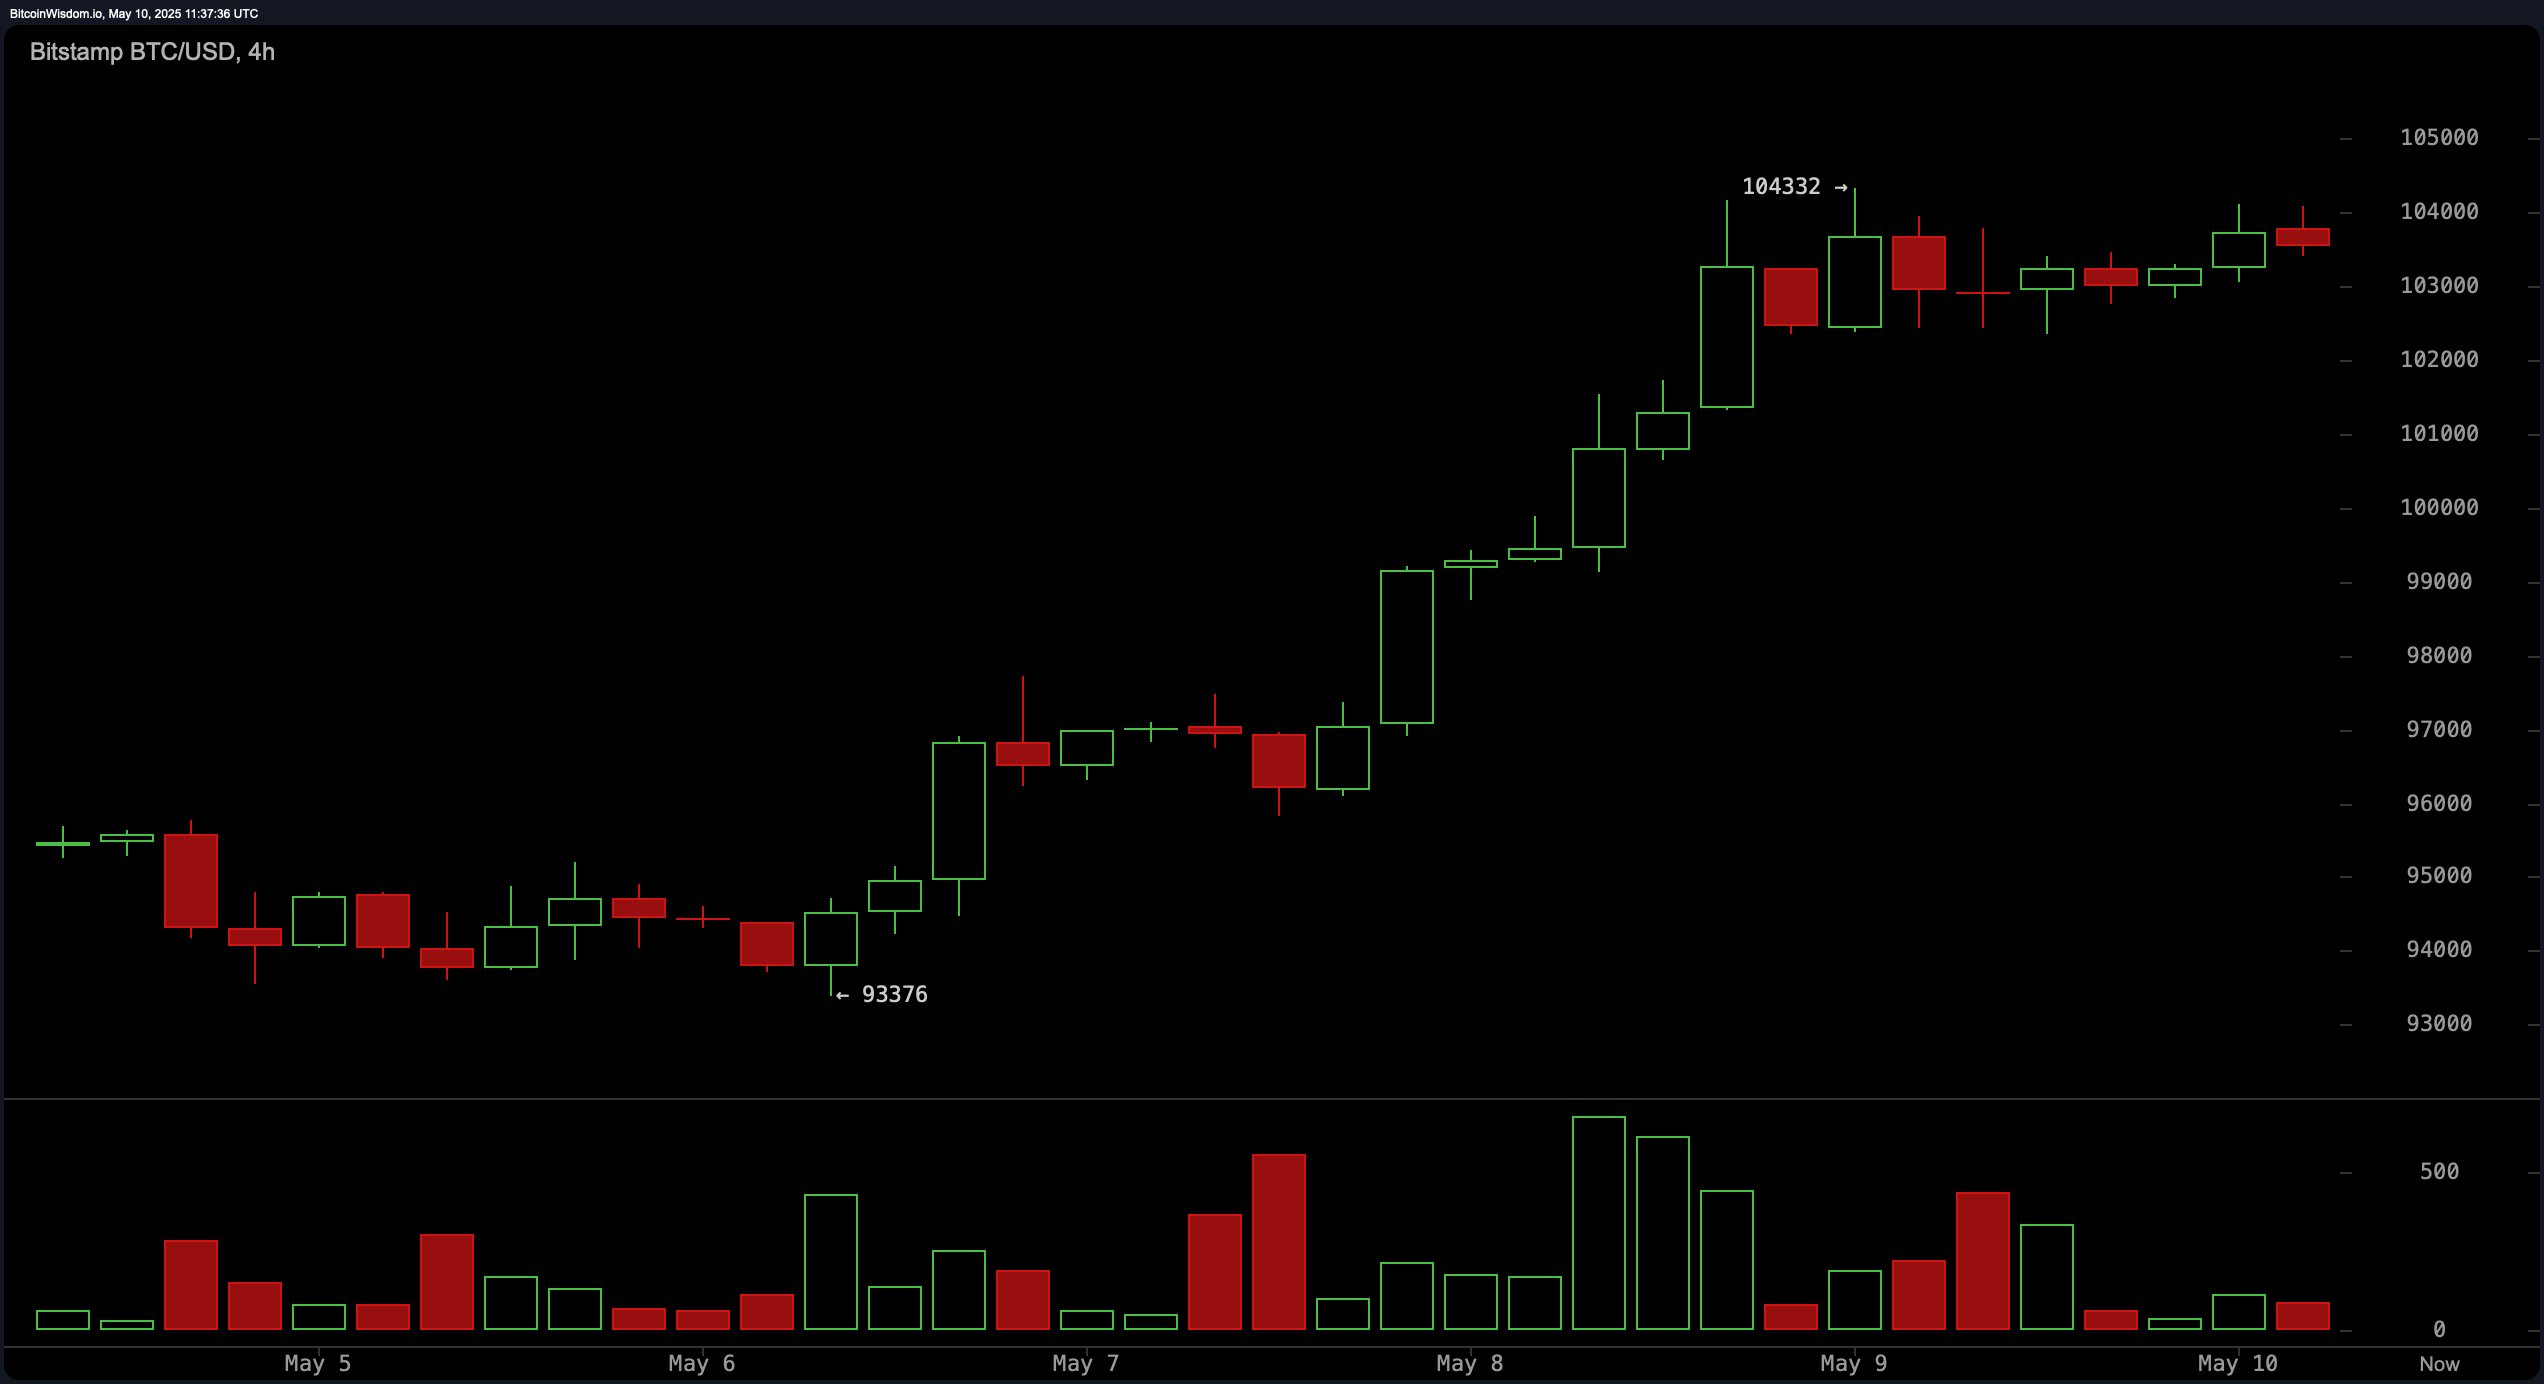
The 4-hour chart confirms a sustained breakout that followed a period of consolidation. Bitcoin established a local swing low at $93,376, with price action forming consistent higher highs and higher lows—hallmarks of a healthy short-term uptrend. Recent candles, however, suggest some degree of profit-taking, with decreasing volume pointing to possible momentum exhaustion. A bullish scenario could unfold if price consolidates and holds above the $103,000–$103,200 level, leading to another attempt at the $104,332 resistance. Conversely, a drop below $102,000 may signal a short-term correction toward $99,000.

BTC/USD 4H chart via Bitstamp on May 10, 2025.
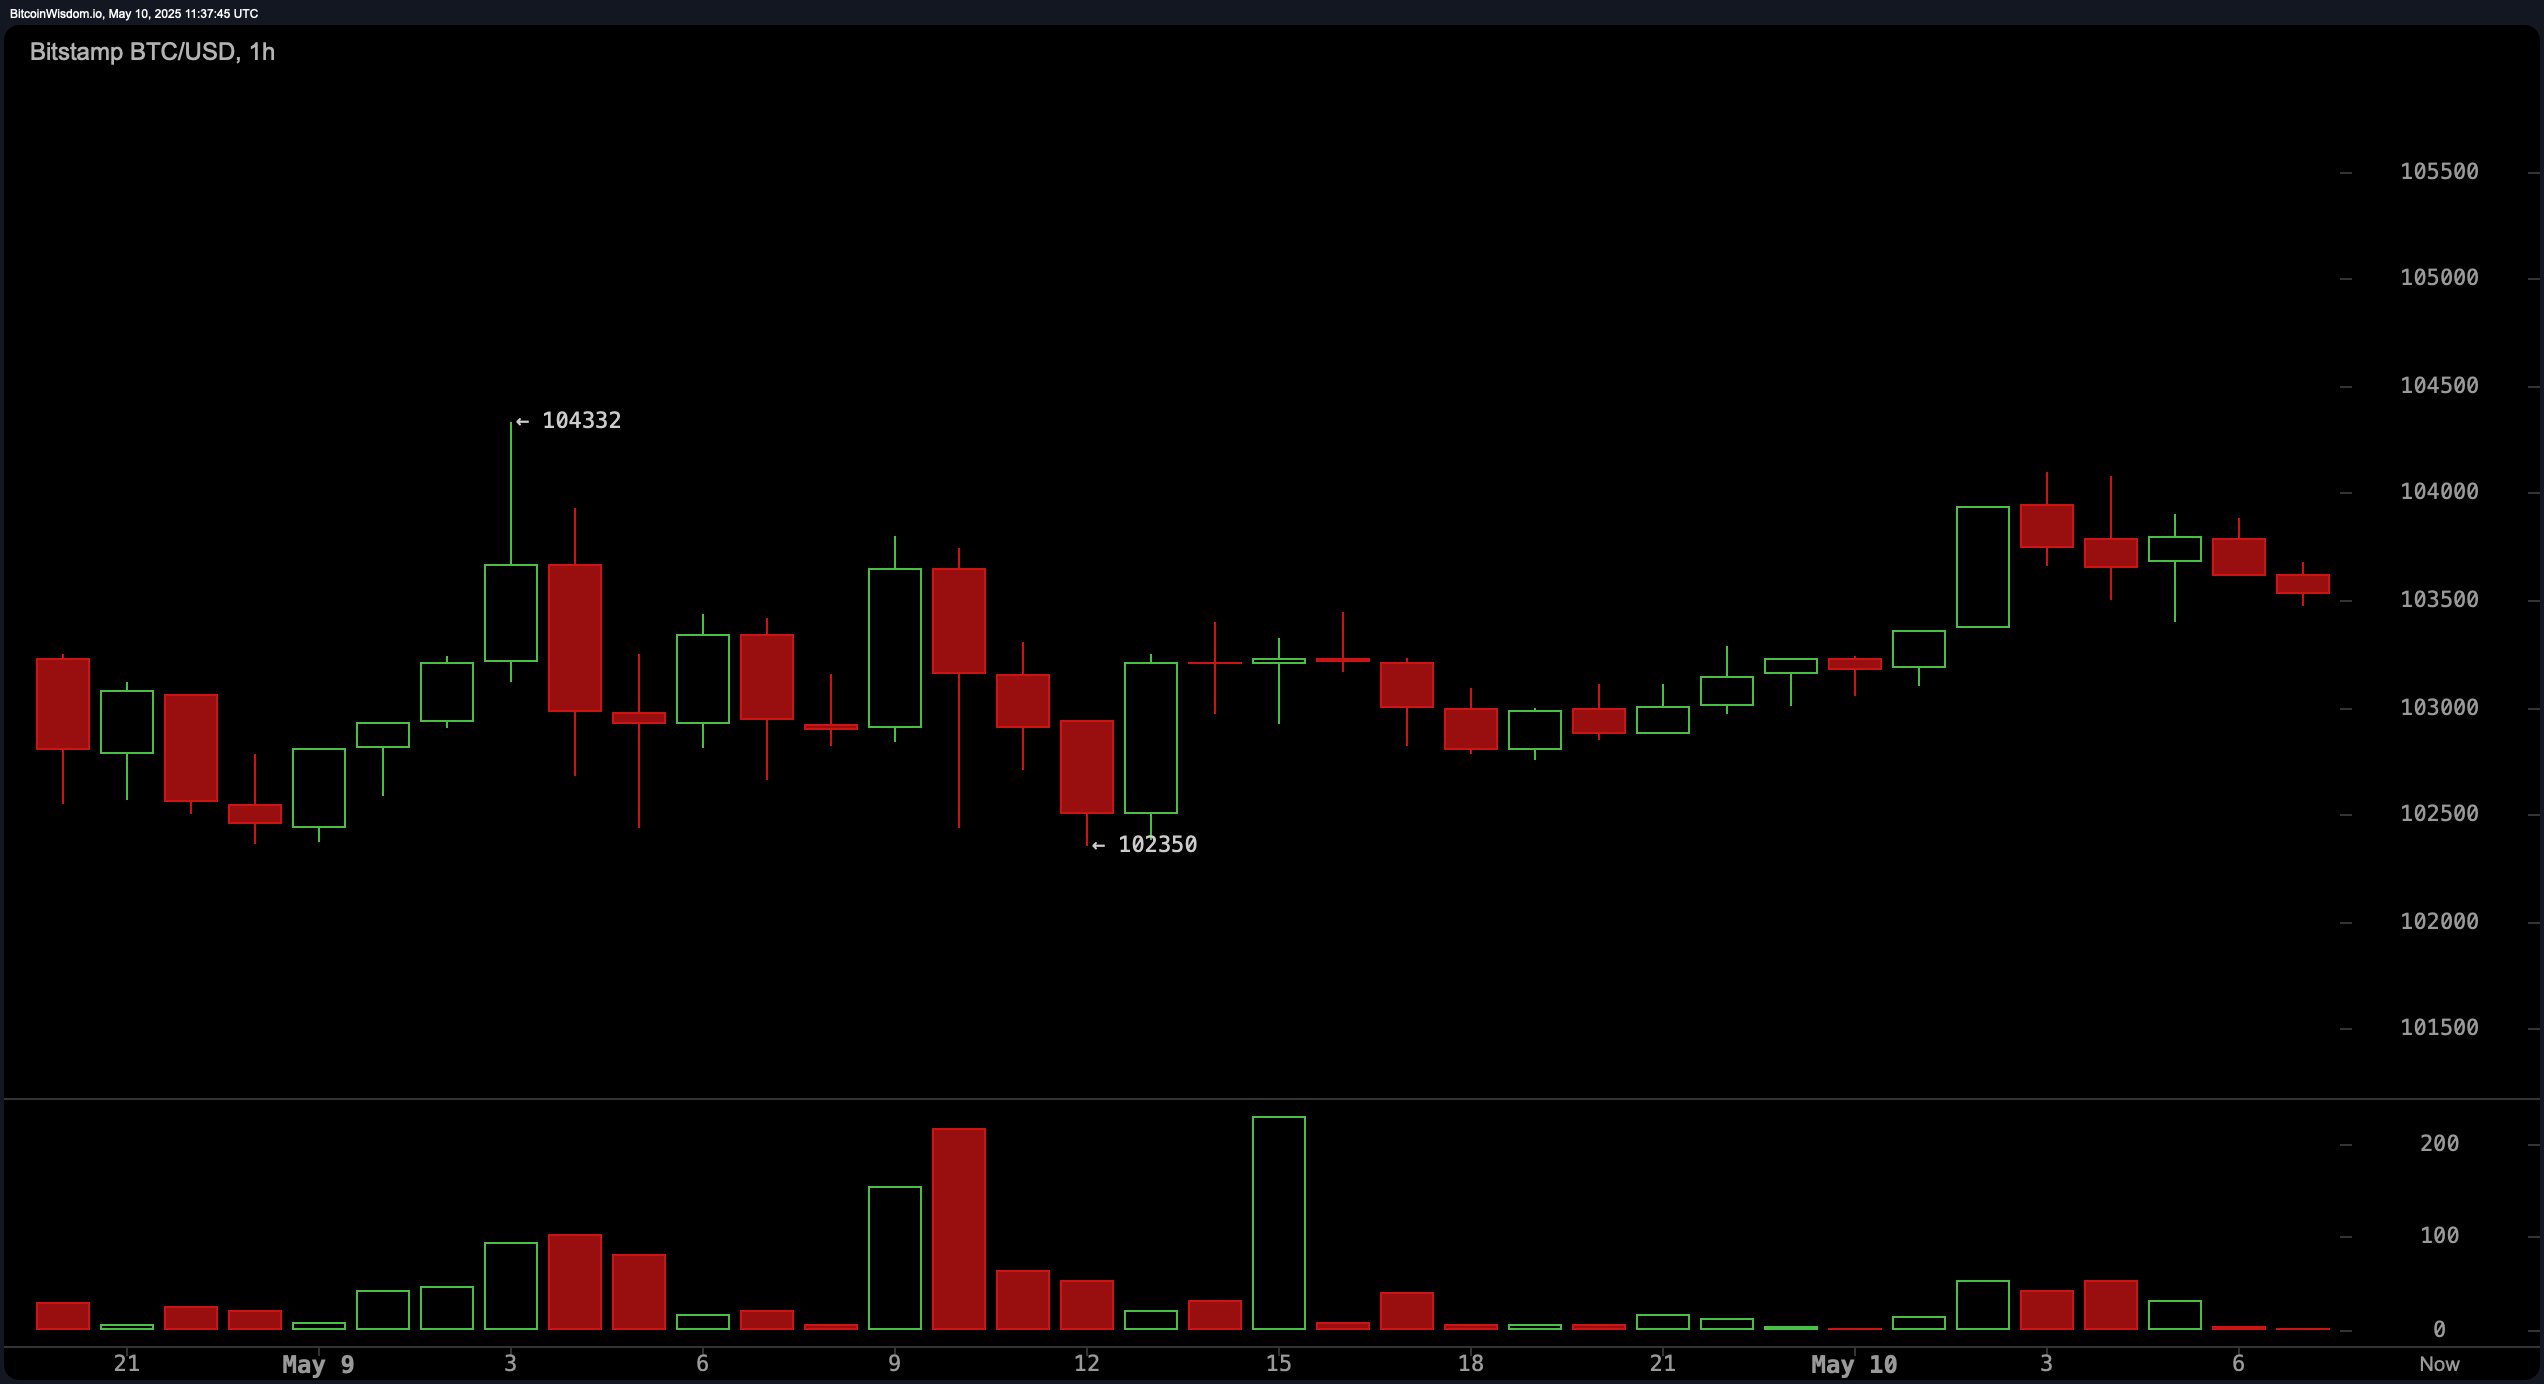
Examining the 1-hour chart reveals a short-term range-bound structure, with bitcoin recently peaking at $104,332 before retracing to $102,350. Price action has turned choppy, with red candles dominating recent sessions and momentum stalling. Trading volume remains low in this narrow band, reinforcing the idea of market indecision at current levels. Scalping strategies may be effective within the $102,300–$104,300 zone, while a clean break above $104,400 with rising volume could validate a momentum-based breakout. Until such confirmation materializes, the immediate outlook remains sideways.

BTC/USD 1H chart via Bitstamp on May 10, 2025.
Oscillators offer a mixed technical picture, suggesting potential divergence between momentum and price. The relative strength index (RSI) at 75 and the Stochastic oscillator at 91 both indicate overbought conditions but remain neutral in action. The commodity channel index (CCI) at 206 flashes a sell signal, contrasting with buy signals from the momentum oscillator at 9,287 and the moving average convergence divergence (MACD) level at 3,808. The Awesome oscillator and average directional index (ADX) both register neutral, hinting at a possible pause in trend strength. This divergence reflects a market in flux, awaiting decisive cues from price action.
Moving averages uniformly reinforce the bullish case across all observed timeframes. The 10-, 20-, 30-, 50-, 100-, and 200-period exponential moving averages (EMA) and simple moving averages (SMA) all signal buy conditions, with current price action holding well above each benchmark. The 10-period EMA and SMA, situated at $98,883 and $98,201 respectively, demonstrate strong short-term support. Longer-term averages, including the 200-period EMA at $87,008 and the 200-period SMA at $91,229, confirm robust upward alignment. As such, the medium- to long-term outlook remains favorable, barring unexpected shifts in macro or volume dynamics.
Bull Verdict:
The broader technical landscape for bitcoin continues to favor bulls, with upward alignment across all moving averages and a resilient price structure on the daily and 4-hour charts. Unless key support levels are breached and bearish volume spikes appear, the path of least resistance remains upward, with potential for retesting and surpassing the $104,332 resistance in the near term.
Bear Verdict:
Despite prevailing bullish signals on higher timeframes, emerging weakness in oscillators and low-volume price action on the 1-hour chart raise caution flags. Should bitcoin fall below the $102,000 threshold with accelerating sell volume, a short-term pullback toward the $99,000 level becomes likely, shifting sentiment toward a corrective phase.
免责声明:本文章仅代表作者个人观点,不代表本平台的立场和观点。本文章仅供信息分享,不构成对任何人的任何投资建议。用户与作者之间的任何争议,与本平台无关。如网页中刊载的文章或图片涉及侵权,请提供相关的权利证明和身份证明发送邮件到support@aicoin.com,本平台相关工作人员将会进行核查。


