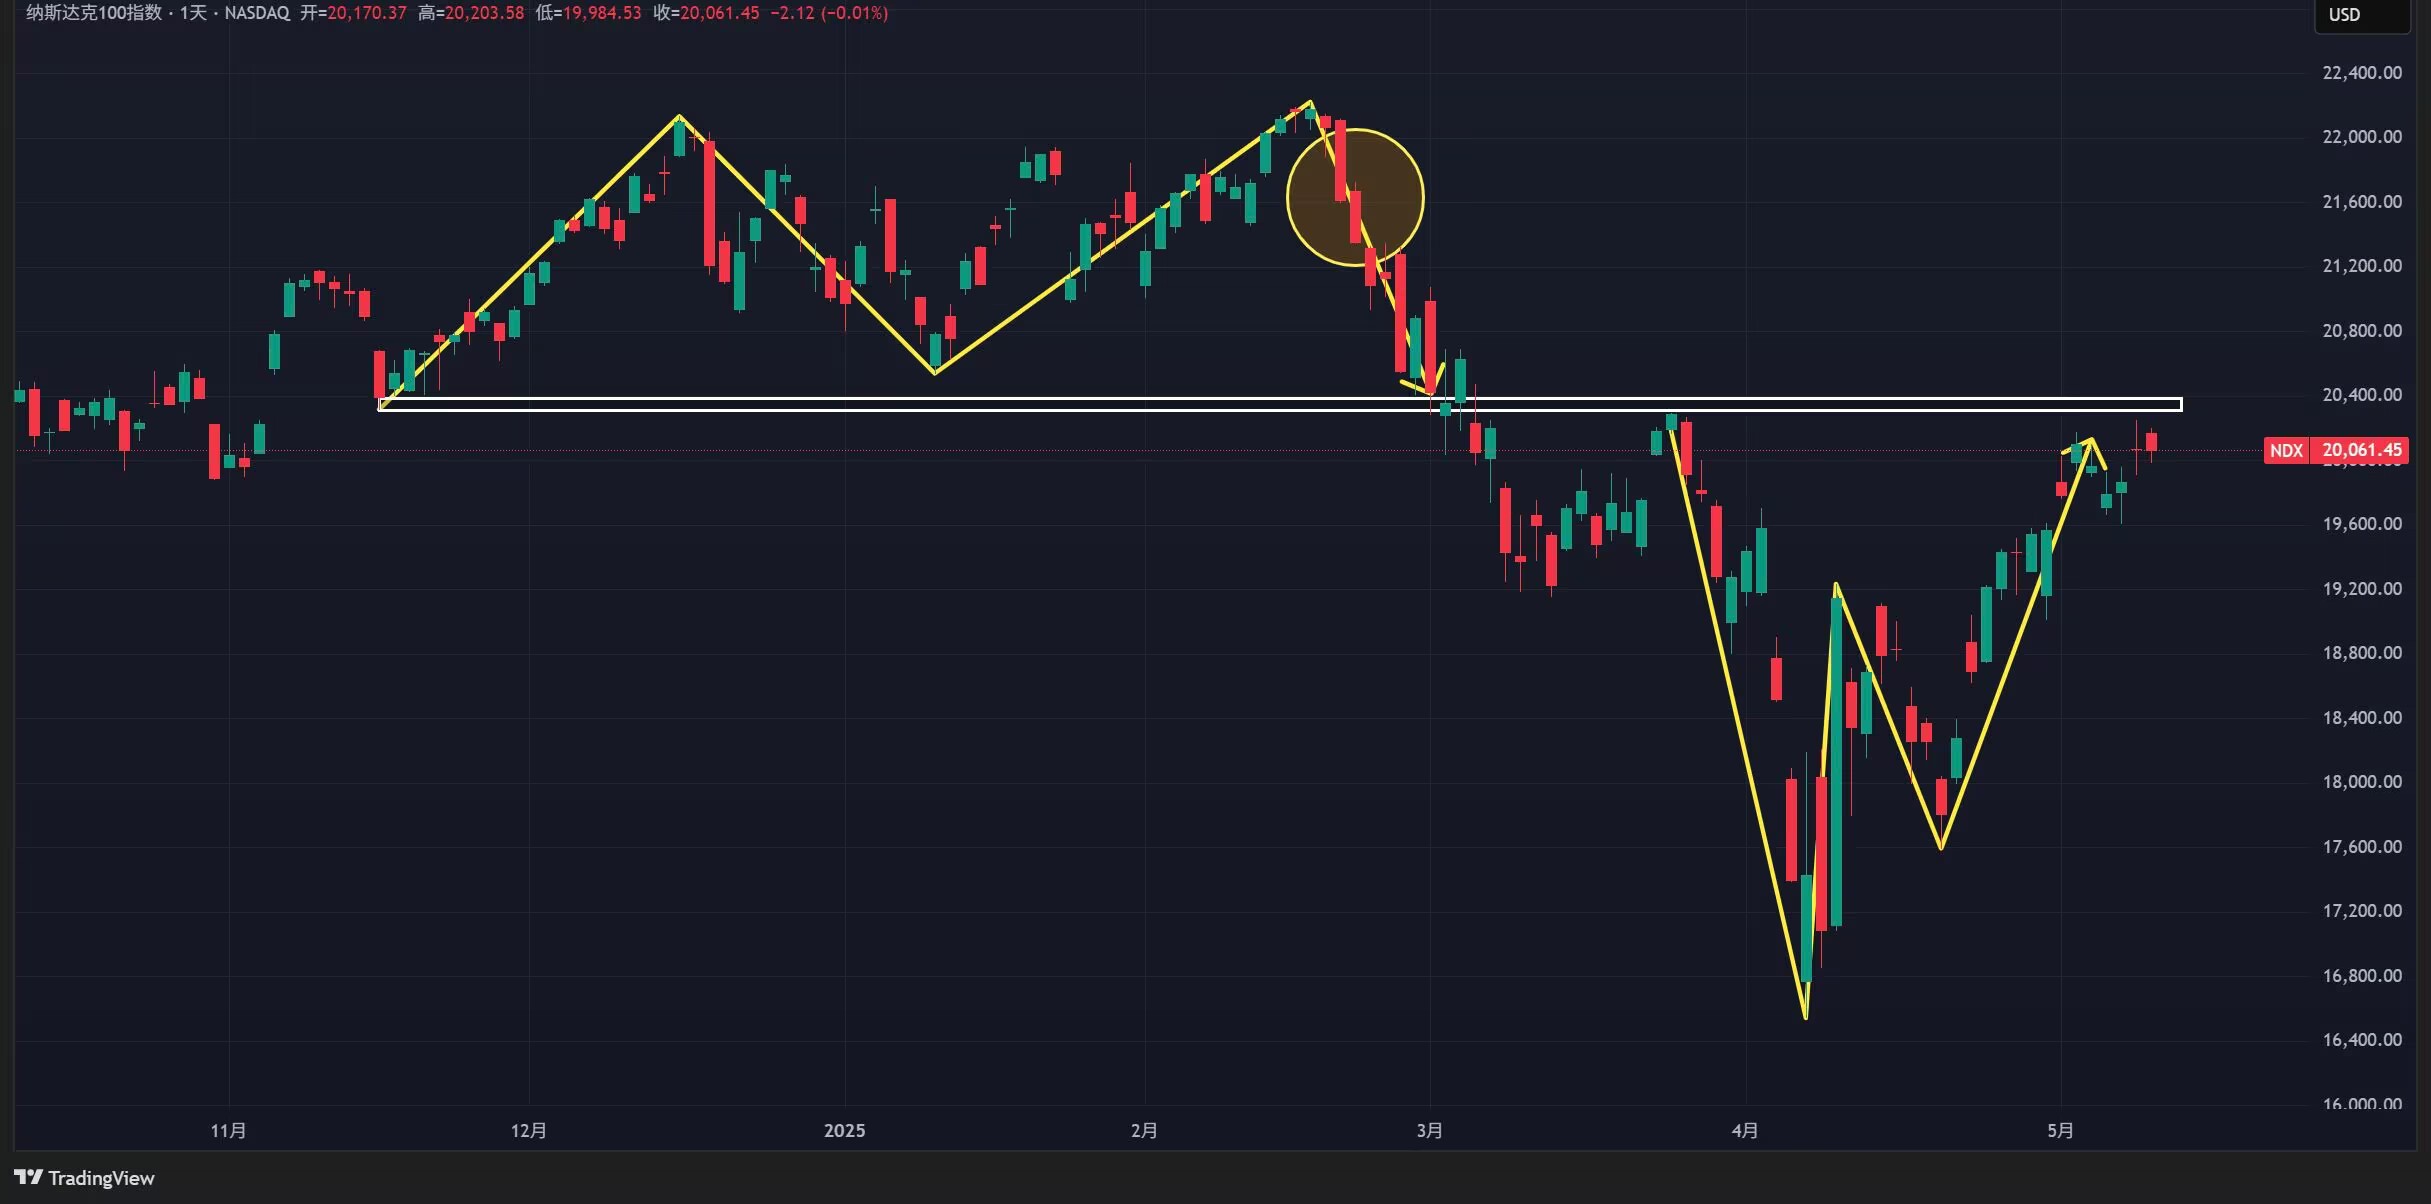
In terms of macroeconomic data, I won't elaborate too much on the news from the beautiful valley. The main focus is on the capital flow. Since the big bullish candle on the 9th, we have seen a second rebound attempt. However, last week's rebound was not ideal, closing as a doji star while being pressured below the previous M-top and the middle Bollinger Band. Next week is quite critical; I believe that even if there is a rebound, there is still a probability of a pullback. Previously, I thought we would test the rising channel pressure at 0.886 before a decline, but it may not go as planned, as the M-top pressure has not yet been broken.
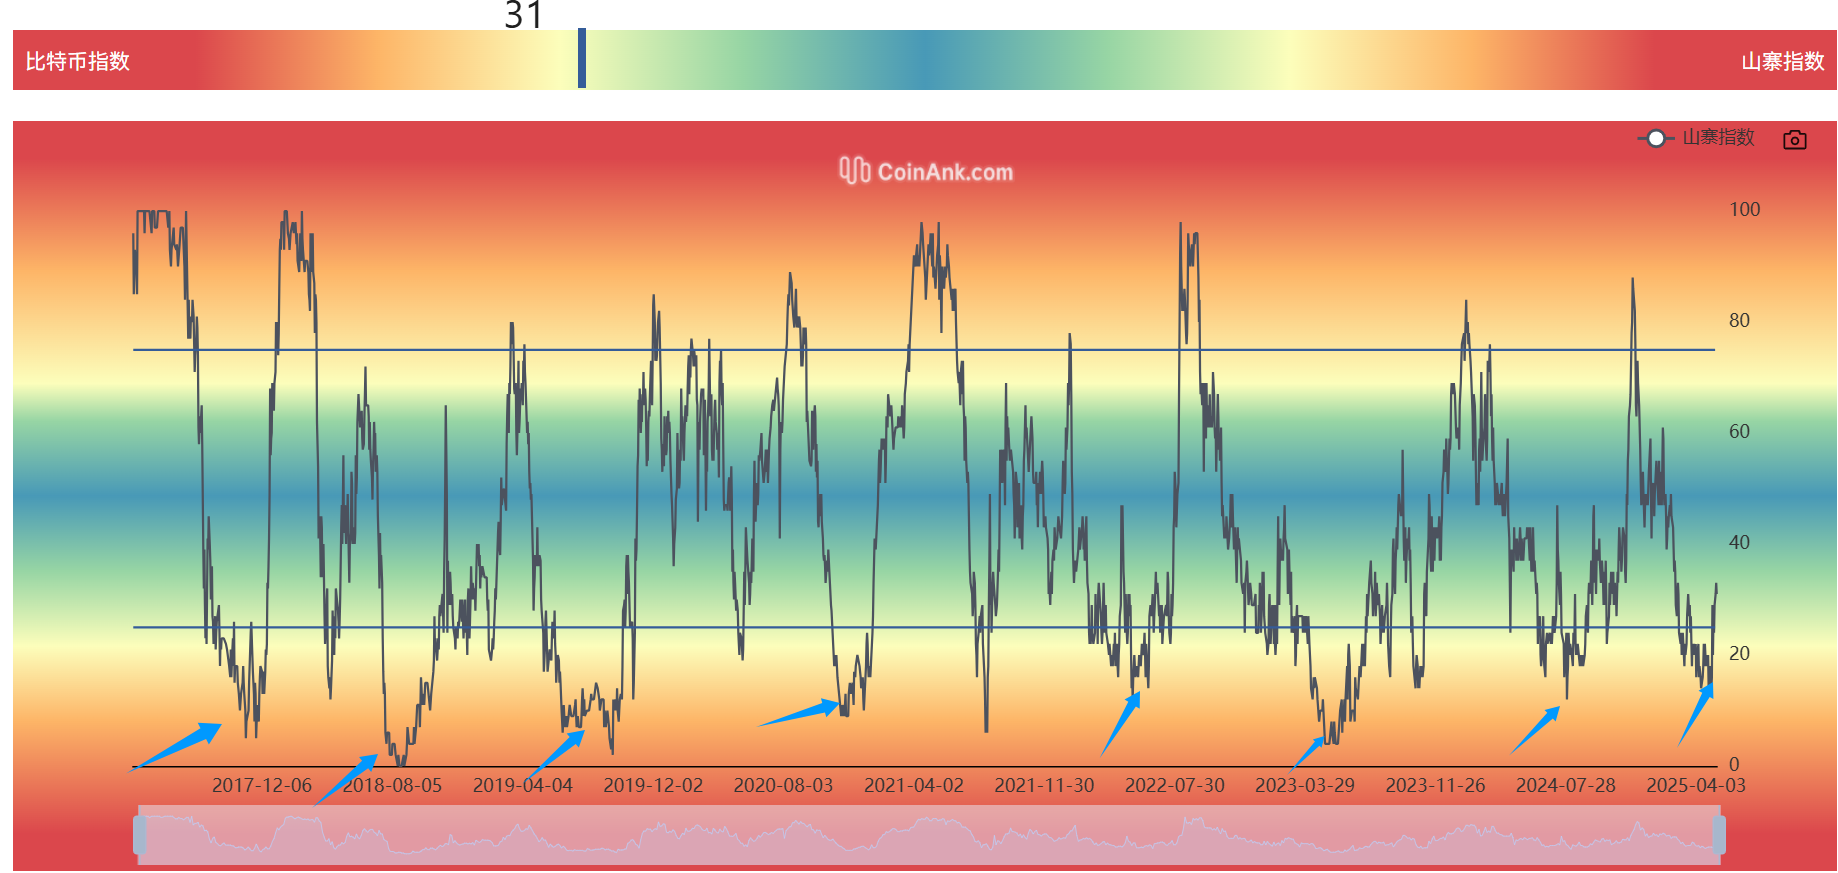
The price of Bitcoin is about 5000 points away from its historical high. Those who added positions around 78000 and 85000 can take profits in batches while keeping a core position. Ethereum is still catching up, and altcoins are rebounding from oversold conditions. The altcoin seasonal indicator is at 31, and there is always a rebound opportunity whenever it falls below 20, which has been consistently proven. In the future, there will only be opportunities for altcoin rotation, and there will be fewer opportunities for simultaneous rises.
The ETH/BTC exchange rate rebounded 33% this week. Whether 0.01766 is a historical low will depend on future retests for confirmation.
Bitcoin
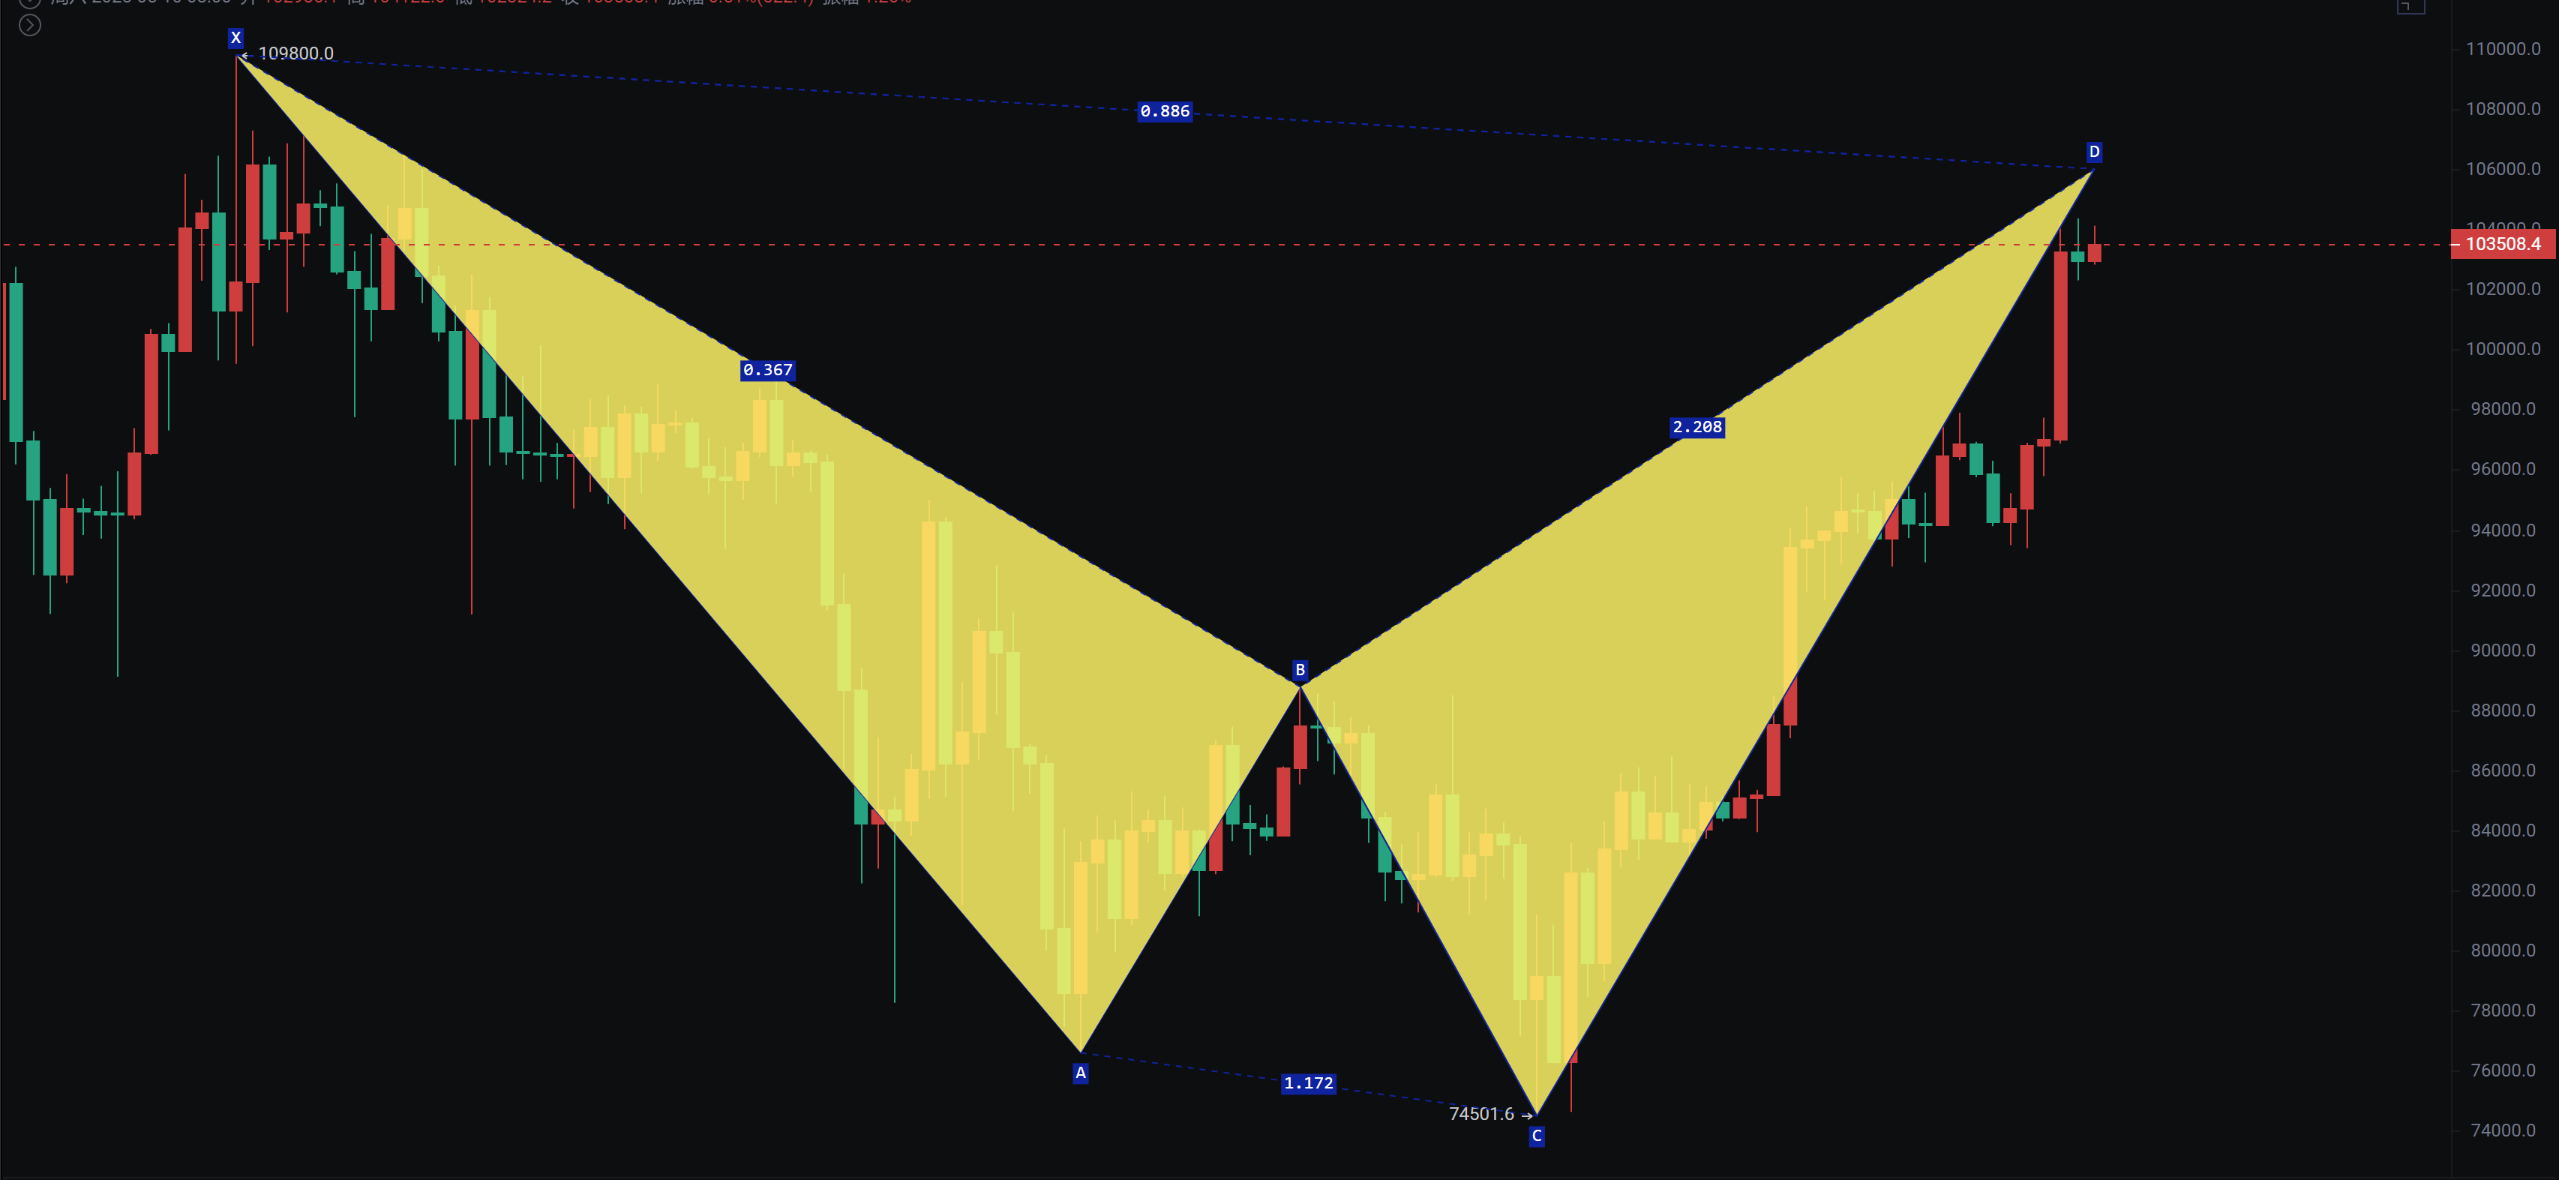
The weekly close is a medium bullish candle, and the weekly chart is still showing a volume contraction with an upward trend. The MACD is crossing the zero line, indicating a potential bullish signal. I continue to hold a bullish view, as I reminded everyone in February that there could be black swan events in the U.S. stock market, but I have always maintained that the bull market is not over. At that time, I suggested buying in batches at 76000 and 85000, believing that the U.S. stock market's harmonic pattern looking towards 0.886 would correlate with Bitcoin's shark pattern aiming for 106000, which is basically completed.
The daily chart has broken through 0.786, and the MACD currently needs to be cautious of a top divergence. It cannot fall back below 786. I have always been a die-hard bull; Bitcoin will always oscillate upwards, and I will always remain bullish and emotional. However, I never FOMO and never panic when it drops. The subsequent pullback within the 92000—97800 range is an opportunity to add positions.
Support: 92000—97800—100000
Resistance: 106000—110000
Ethereum
Ethereum is still rebounding from an oversold condition. Pay attention to the significant fluctuations in the past two years, which have been between 50—80%. At other times, it either oscillates or pulls back. The weekly chart is rebounding near the middle Bollinger Band, with the highest spike at 2608. If it continues to rebound, 2856 is a strong resistance level that broke the platform; do not go long below this resistance and do not go short near the support. The logic of Ethereum catching up and altcoin rotation is still ongoing, and currently, funds are flowing into altcoins.
Support: 2100—2300
Resistance: 2856—3200
If you like my views, please like, comment, and share. Let's navigate through the bull and bear markets together!!!
The article is time-sensitive and for reference only; it is updated in real-time.
Focusing on K-line technical research, sharing global investment opportunities. Public account: BTC Trading Prince Fusu

免责声明:本文章仅代表作者个人观点,不代表本平台的立场和观点。本文章仅供信息分享,不构成对任何人的任何投资建议。用户与作者之间的任何争议,与本平台无关。如网页中刊载的文章或图片涉及侵权,请提供相关的权利证明和身份证明发送邮件到support@aicoin.com,本平台相关工作人员将会进行核查。