Let's take a look at today's market analysis. First, we will look at Bitcoin. Bitcoin is also at the daily level, and after the weekend,
it highlighted this weekly chart. The weekly chart shows a bullish candlestick. From last week's weekly chart, we can see
that at this point, the weekly level has also formed a golden cross, indicating an upward trend. Therefore, from the weekly level, there are still bullish reasons.
The trend is also very clear. We switch to the daily level. The daily level closed with a small bearish candlestick yesterday, and today
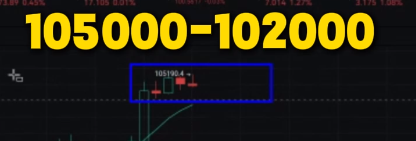
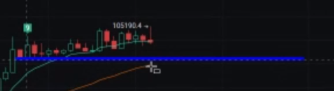
there has been a slight pullback. Continuing to pull back, from the current price, it is still in the range of 105,000 above and 102,000 below, consolidating and oscillating.
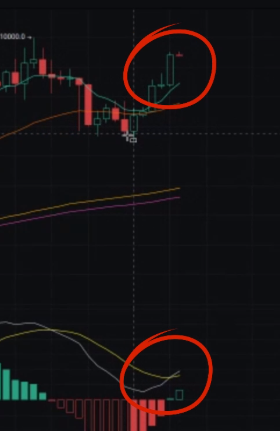
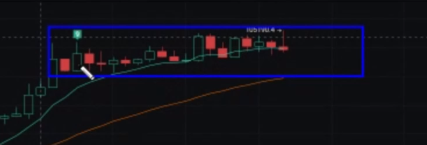
Switching to the 4-hour chart, we can see that this area has formed a box-like oscillation structure.
From the current situation, as long as it does not fall below 102,000, I personally believe that as long as it does not break below 102,000,
there is basically no risk in the short term. We can still buy on dips and go long.
However, in the short term, if it falls below 102,000, because from the overall trend, Bitcoin has risen from 74,000 to 105,000,
which is about a 30,000 point increase. A 30,000 dollar increase is actually quite significant, and this increase has not seen a major correction.
This area is close to the previous high. There is a risk of a short-term pullback, so we need to be cautious about blindly chasing long positions here and getting trapped at the top.
However, as long as it does not fall below 102,000, we can still focus around 102,000, with a small stop-loss, and continue to bet on long positions. This is something we need to pay attention to.
Looking upward, we still see the previous high points, which are 106,000, 108,000 to 110,000,
the historical highs. We can still look upward from this position. The trend lines on the 4-hour and daily levels are still very clear. As long as this trend line is not broken,
we are likely to continue buying on dips and going long.

This is basically our thought process, consistent with yesterday's video. After discussing Bitcoin, let's take a look at Ethereum.
At the weekly level, Ethereum has also produced a rare large bullish candlestick. From this week's weekly level, we can see that the weekly level has also shown signs of a
bottom golden cross, indicating that there is still a possibility of continued upward movement. Yesterday, the daily level closed with a bearish candlestick, but this is not important; it is more like
a consolidation after the rise, so there is still a possibility of further increases.
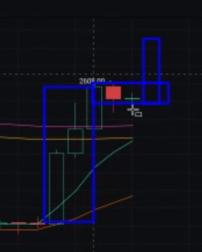
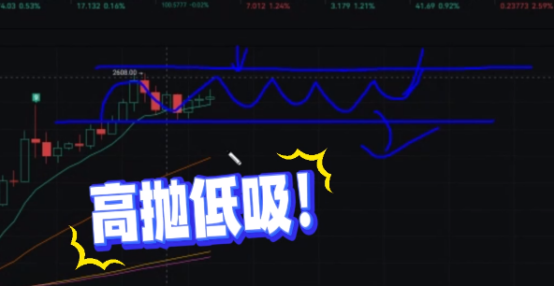
Now switching to the 4-hour chart, we can see that the previous high is in the range of 2,600 to 2,610.
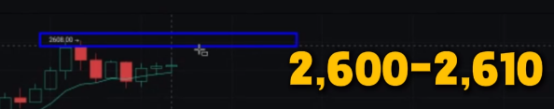
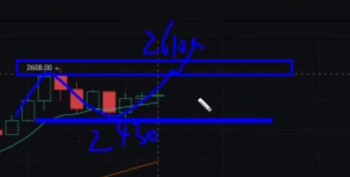
Currently, it has pulled back nearly 200 points, and the price is in this range, consolidating and oscillating. Next, we need to focus on whether the lower level of 2,430 can hold,
and above, we need to pay attention to whether the 2,610 level can continue to create new highs. If new highs are made, that would be good. In the short term, we only need to focus on the lower level of 2,430 and continue to bet on long positions.
However, one thing to note is that because Ethereum's recent surge has been very strong, we can set a small stop-loss above and continue to bet on short positions.
The short position we provided yesterday also quickly hit this level, and we instantly gained nearly 200 points in profit, then reversed and provided a long position here.
As of now, we have also gained over 100 points in profit. During this period, if new highs and new lows are not created, it is likely to oscillate within this range,
so we just need to wait for the subsequent breakout of this market or the pullback of this market. If there is such a box-like oscillation, as long as it does not break through in a day, we just need to trade high and low within this range.
This is today's market analysis. If you still feel confused about trading,
feel free to follow our public account: KK Strategy.

免责声明:本文章仅代表作者个人观点,不代表本平台的立场和观点。本文章仅供信息分享,不构成对任何人的任何投资建议。用户与作者之间的任何争议,与本平台无关。如网页中刊载的文章或图片涉及侵权,请提供相关的权利证明和身份证明发送邮件到support@aicoin.com,本平台相关工作人员将会进行核查。