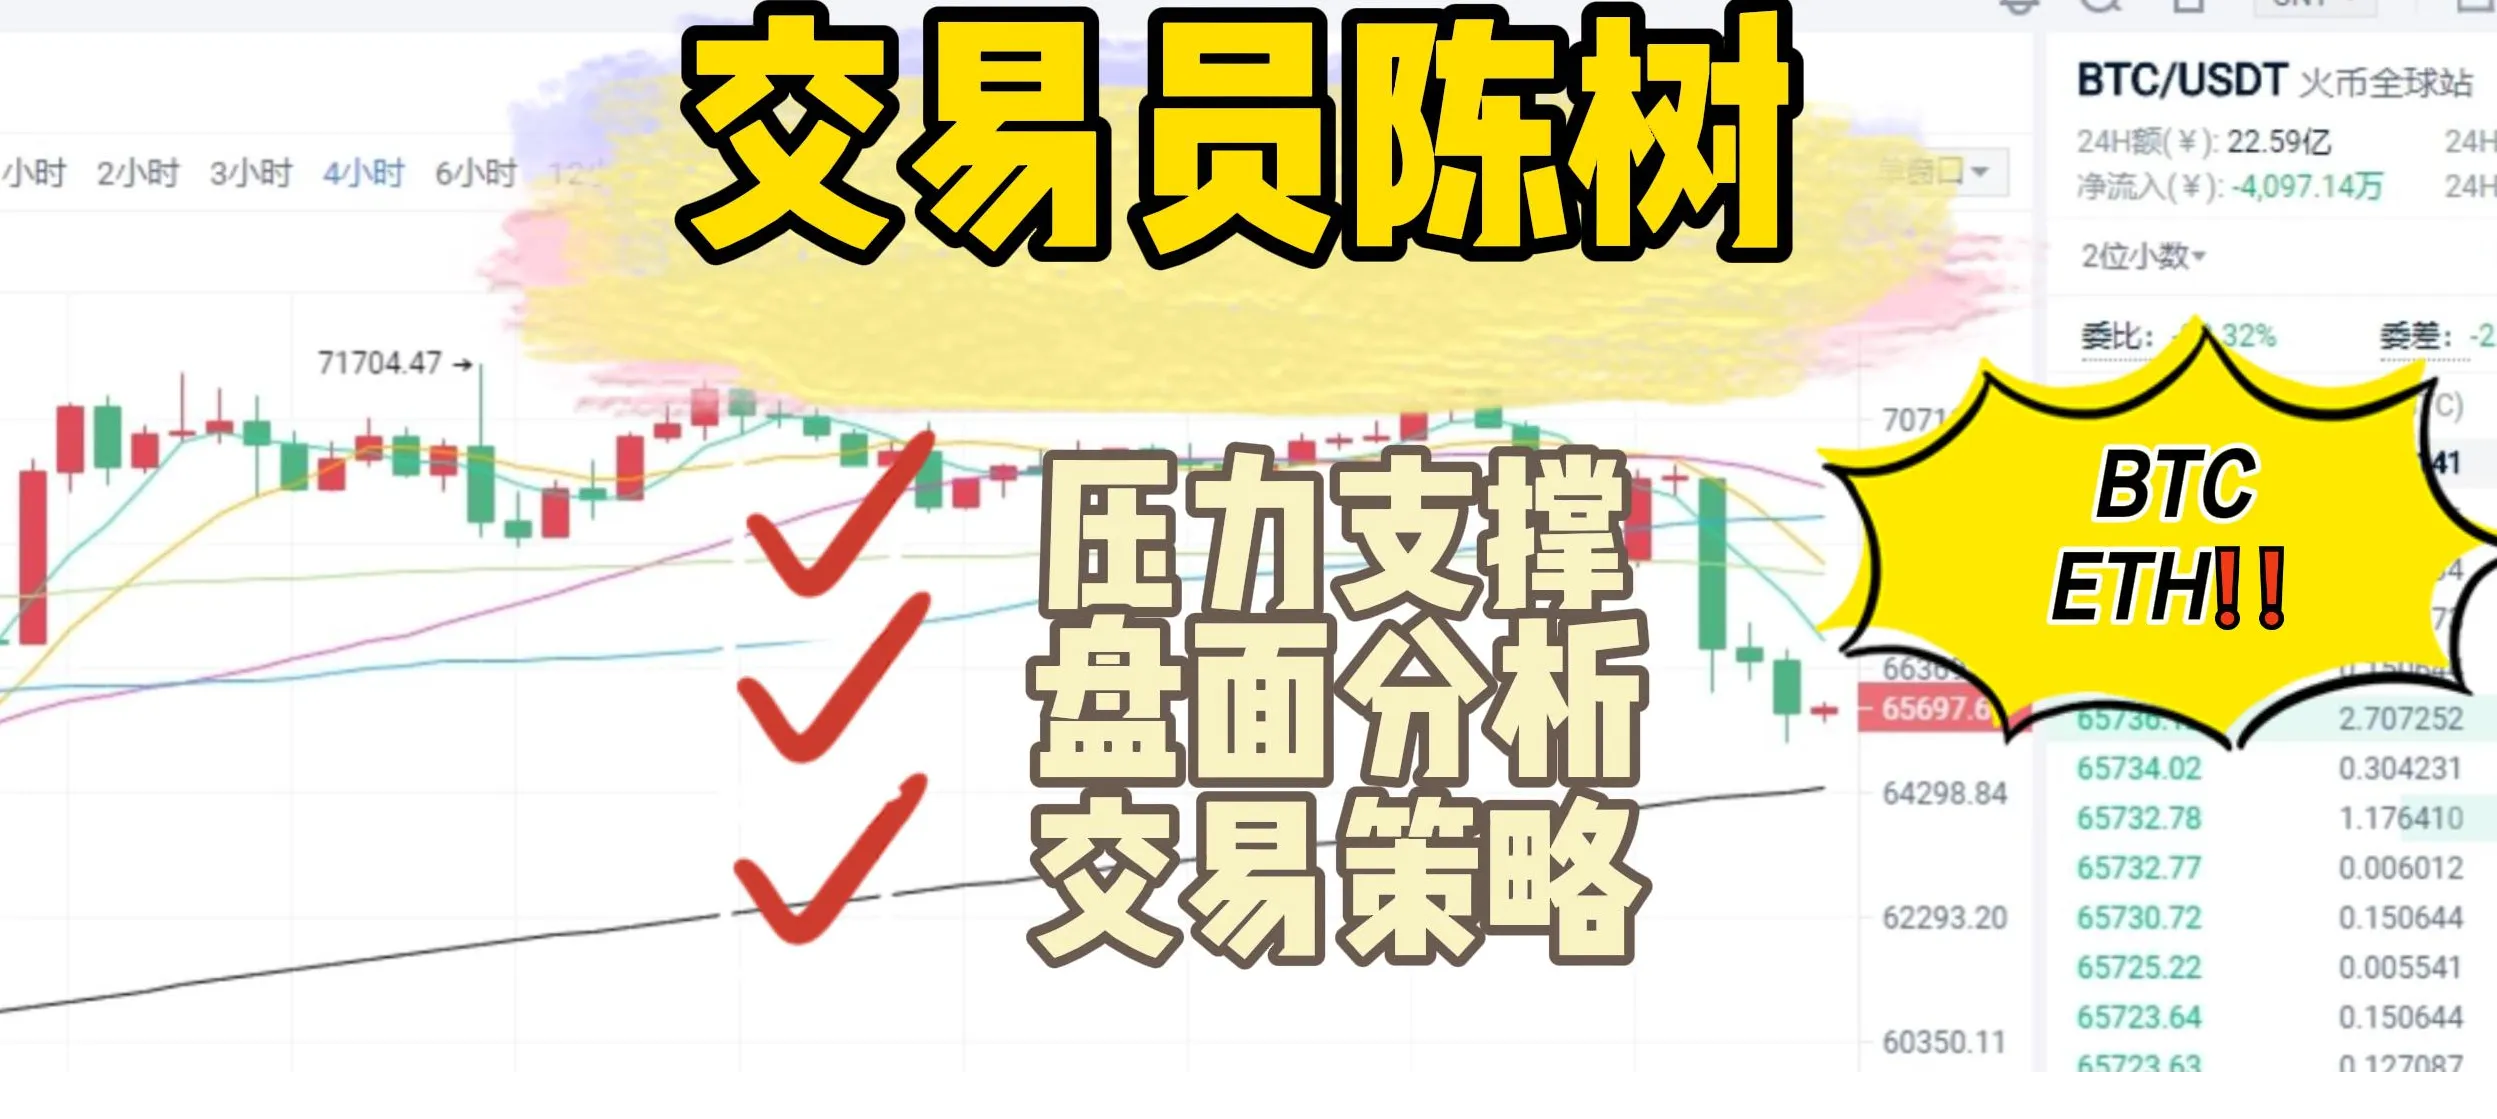
Bitcoin has experienced a brief pullback after two consecutive daily declines, which completely aligns with our previous expectations.
We discussed this issue yesterday, noting the risk of a short-term pullback for Bitcoin, as there is clearly insufficient upward momentum at the top.
We can see that from the 74,000 mark to 100,500, it has risen approximately 30,000 points, so a proper pullback is a healthy correction.
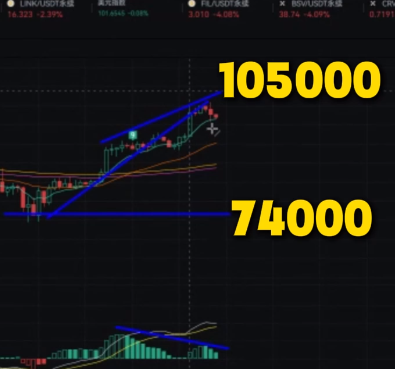
If it were to continue rising without any pullback, that would be unhealthy. Therefore, there is a risk of a short-term pullback. Yesterday, we indicated that the support level was around 102,000. Currently, this level has been broken, but the overall short-term downward trend line has not yet been breached. For now, we can observe. When approaching this trend line, which is around 100,000, and the range of 99,000 to 100,000, we can consider entering the market. If it does not break down further, then after a short-term pullback, the price will likely rise again. However, if there is a direct drop below this level.
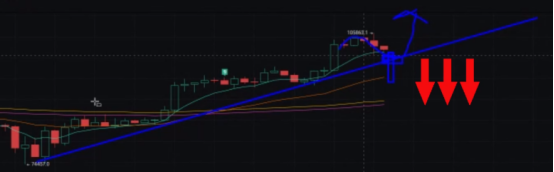
In the short term, we will no longer look for bullish positions and will wait for stabilization and a pullback before considering entry. If it breaks below the stronger support level in the range of 96,000 to 97,000, which corresponds to the previous high from a daily perspective.
Switching to the 4-hour chart, Bitcoin is currently contesting around the 102,000 mark. We will observe the final closing situation.
If the 4-hour closing shows a solid close above this level, we can continue to look for bullish positions.
This would be a breakthrough of the previous high.
In yesterday's video about Ethereum, we also mentioned the clear signs of divergence at the top. While we cannot say for certain that it will decline in the short term, we should not blindly go long.

Looking back at Ethereum, it has risen from 1,380 to 2,620, which is about a 1,200-point increase. Since it has risen by 1,200 points, a pullback of 200-300 points should be considered normal. Therefore, when trading, especially in light of the divergence mentioned yesterday, it is important to consider whether your position can withstand a pullback of around 200-300 points. This is the first point.
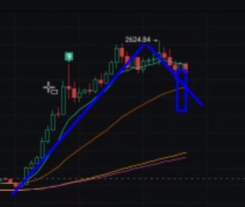
The second point is that from the 4-hour chart, we can see that a double top has formed and broken.
Next, we need to observe whether the closing price can stay above this level.
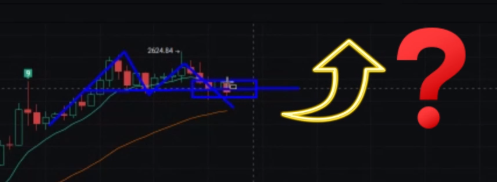
If the closing price stays above the neckline at 2,460, the price will continue to rise. If it does not stay above this level, then the double top has broken, and the short-term focus will be on bearish positions.
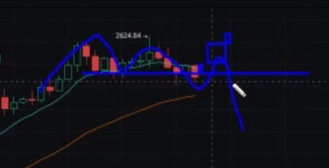
The price may further pull back, so be prepared. If Ethereum declines, a decent support level is in the range of 2,360 to 2,260, which we can consider.
At that time, we can consider placing short-term long positions in this range.
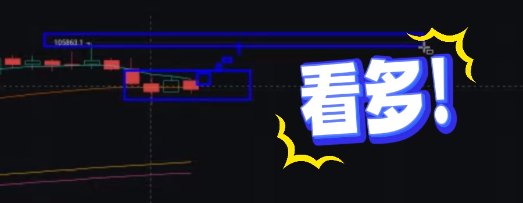
If it closes solidly above this level, the price will further rise to the previous high of 2,630, and we can consider placing our short-term short positions there.

For more strategies, follow our public account: KK Strategy

免责声明:本文章仅代表作者个人观点,不代表本平台的立场和观点。本文章仅供信息分享,不构成对任何人的任何投资建议。用户与作者之间的任何争议,与本平台无关。如网页中刊载的文章或图片涉及侵权,请提供相关的权利证明和身份证明发送邮件到support@aicoin.com,本平台相关工作人员将会进行核查。