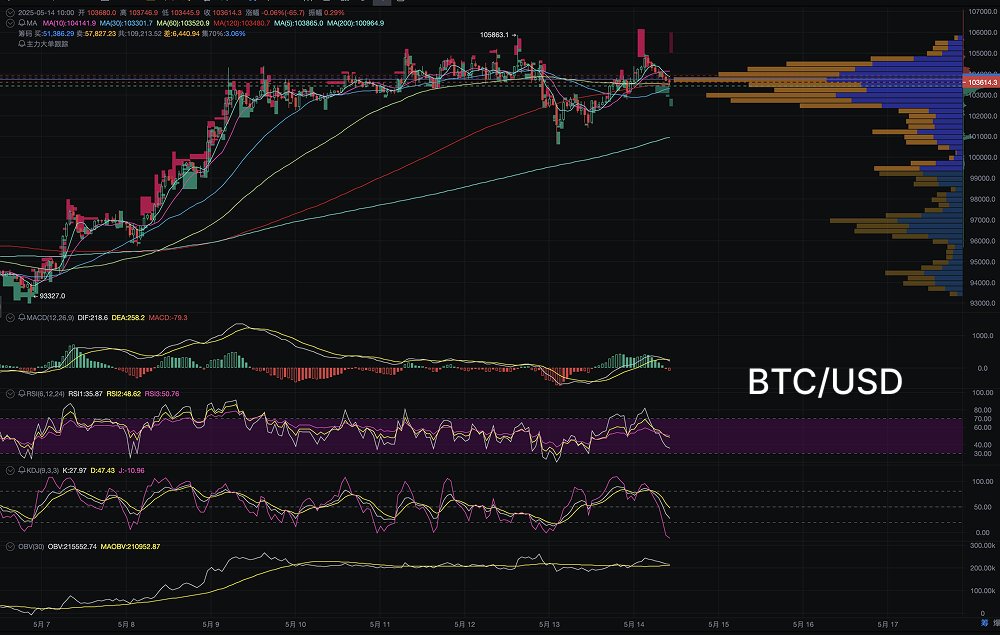
On May 14, 2025, after Bitcoin continuously rose and broke through the psychological barrier of $100,000, the market trend gradually entered a high-level sideways consolidation range. As of the time of writing, Bitcoin closed at $103,614. Although in the past month, the BTC price surged from a low of $93,000 to a historic high of $105,863, the current price performance reveals a clear exhaustion of upward momentum.
AICoin chart data shows that Bitcoin is facing resistance in a densely held area, accompanied by technical indicator divergence and large capital flow differentiation, leading to a tug-of-war between bulls and bears in the market. Analysts point out that this round of Bitcoin's rise is closely related to ETF capital inflows and institutional FOMO sentiment, but after reaching a peak, there is a lack of further catalysts to support the price in the short term. The structure of capital flow is undergoing subtle changes, and on-chain indicators along with the off-chain environment suggest that a consolidation period may be imminent.

Technical Analysis: Clear Signals of High-Level Consolidation, Multiple Indicators Diverging
From the daily and hourly candlestick structures, after reaching a high of $105,863 on May 12, BTC has been consolidating sideways for several days, with the focus gradually shifting downward, forming a top convergence triangle structure. Currently, the price is testing support and resistance multiple times around the $101,000 to $104,000 range, indicating a clear stage of bull-bear contention.
Technical indicators show clear signs of weakening:
- The MACD has formed a death cross at a high level, with the DIF line continuously declining and approaching the zero axis, indicating a gradual weakening of short-term momentum;
- The RSI has fallen from the overbought area (88.7) to around 56.0, showing a retreat in buying power;
- The KDJ indicator has formed a death cross, with the J value quickly dropping below 50, reflecting a shift in market sentiment from extremely bullish to wait-and-see;
- The OBV (On-Balance Volume) indicator, while maintaining a relatively high level, shows a significant slowdown in the rate of increase, indicating that capital is starting to wait and even partially cash out.
On-Chain Data Anomalies: Whale Capital Transfers, Slowing Net Inflows to Exchanges
On-chain data shows that since May 10, the activity of Bitcoin whale addresses (holding over 1,000 BTC) has begun to decline. Glassnode data indicates that some older addresses have gradually transferred funds to exchanges as the price approached $105,000, a typical "profit-taking at high levels" behavior.
At the same time, CryptoQuant's on-chain monitoring data shows that net inflows to exchanges turned positive from negative starting May 11, with the average daily net inflow rising to over 2,000 BTC; the average holding cost for short-term holders is approaching the current price, and the SOPR indicator is flattening at a high level, indicating that the market's profit-taking ratio is at a temporary peak; the number of active addresses on the Bitcoin blockchain has decreased, retail investor enthusiasm has waned, and on-chain trading activity has weakened.
These data collectively indicate that the current Bitcoin market is gradually transitioning from a "trend-driven rise" to a "structural adjustment period," with major capital exiting in batches rather than continuing to chase higher prices.
ETF Funds: Signs of Slowing Down, Still a Key Player in the Medium to Long Term
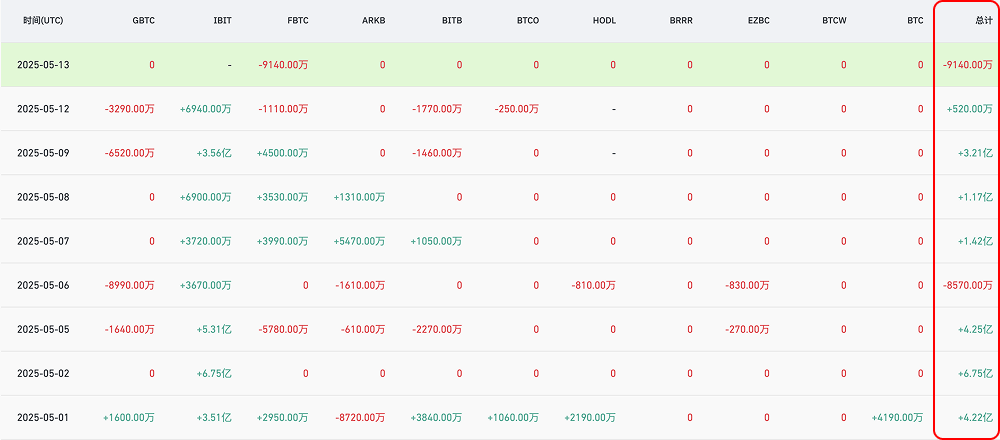
As one of the core variables driving BTC's rise, Bitcoin spot ETFs have attracted over $10 billion in funds since their launch at the beginning of the year. However, since last week, signs of differentiation in ETF incremental funds have emerged:
According to Farside Investors data, as of May 13, the daily inflow for BlackRock's IBIT has decreased significantly from an average of $350 million at the beginning of the month; Grayscale's GBTC has continued to see slight net outflows, with no signs of stopping;
Internal Wall Street data shows that the proportion of institutional allocation funds within ETF capital composition is stabilizing, while speculative short-term buying has decreased.
The fundamental reason for the slowdown in ETF funds is that Bitcoin has transitioned from a "relatively undervalued" revaluation phase to a new stage of "pricing game." Some fund managers are concerned about the uncertainty of the Federal Reserve's interest rate policy, as well as recent macro data such as the U.S. CPI and PPI, which may delay the interest rate cut cycle, thereby affecting liquidity in the crypto market.

Market Contention Structure: Bullish Confidence Intact, Bears Still Tentative
Despite short-term technical pressure, there are currently no clear trend reversal signals for BTC. CME futures position data shows that institutional long positions remain high, while hedging short positions have slightly increased, but no dominant trend has formed.
At the same time, long-term holders on-chain remain calm. Long-term holding addresses have a cost basis below $60,000, and there is currently no selling pressure, providing support for bottom capital lock-in.
The market is currently in a typical "digesting profit-taking + waiting for new catalysts" phase. If there are no strong policy benefits or capital pushes in the next two weeks, BTC will continue to consolidate around the $100,000 mark. If there are macro-positive developments or a resurgence of net inflows into ETFs, the possibility of testing the $107,000 resistance again cannot be ruled out.
This article only represents the author's personal views and does not reflect the stance or views of this platform. This article is for information sharing only and does not constitute any investment advice to anyone.
Join our community to discuss this event
Official Telegram community: t.me/aicoincn
Chat room: Wealth Group
免责声明:本文章仅代表作者个人观点,不代表本平台的立场和观点。本文章仅供信息分享,不构成对任何人的任何投资建议。用户与作者之间的任何争议,与本平台无关。如网页中刊载的文章或图片涉及侵权,请提供相关的权利证明和身份证明发送邮件到support@aicoin.com,本平台相关工作人员将会进行核查。


