Original Title: "Macroeconomic Warm Wind and Strong On-chain Signals: The Logic Chain and Outlook of BTC's 'Summer Offensive' | WTR 5.12"
Original Source: WTR Research Institute
Weekly Review
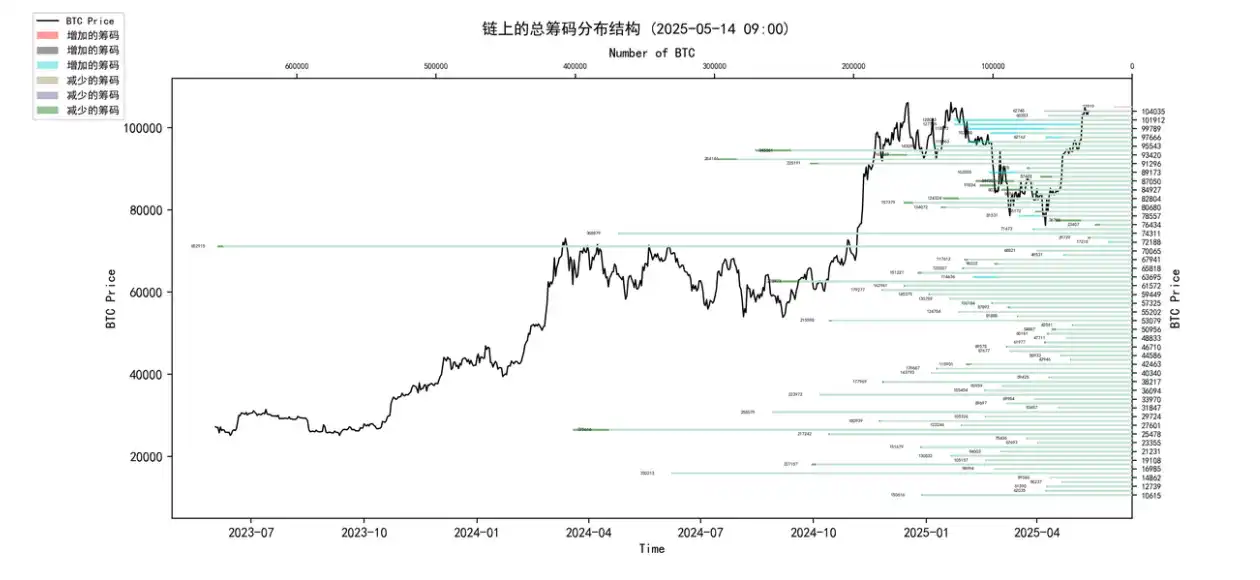
From May 5 to May 12 this week, the highest price of the ice sugar orange was around $105,819, and the lowest was close to $93,514, with a fluctuation range of about 13.16%. Observing the chip distribution chart, there is a large amount of chip transactions around $93,000, which will provide certain support or pressure.
• Analysis:
60,000-68,000 approximately 1.22 million coins;
76,000-89,000 approximately 1.1094 million coins;
90,000-100,000 approximately 1.57 million coins;
• The probability of not breaking below $95,000 to $100,000 in the short term is 80%.
Important News
Economic News
- International Trade and Tariffs:
◦ US-UK Tariff Agreement: Last week, the US and UK reached a tariff agreement.
◦ Japan-US Economic and Trade Talks (China-US Consensus): In this week's Japan-US economic and trade talks, important consensus was reached between China and the US. Subsequent attention will be on tariff agreements between the US and Japan, South Korea, and other economies. The market is recovering from the previous tariff-induced declines.
◦ Progress in Japan-US Talks (News from the 12th): The two sides reached important consensus and made substantial progress. They retained 10% of the tariffs while canceling or suspending other additional tariffs. This positive outcome brings stability signals to the market, stabilizing the international trade environment and reducing global asset market risk aversion, which has positive implications for the economic outlook. The US side stated that the differences are not significant, and the agreement was reached quickly.
◦ Trump's Softening Attitude (Mentioned): "After Trump's attitude softened," the market is recovering from declines. Looking forward to transitioning from "the window period of Trump's tariff softening."
- Federal Reserve Policy:
◦ Slowdown in Balance Sheet Reduction: The Federal Reserve's balance sheet decreased by $17 billion last month to $6.7 trillion (the lowest since April 2020). In March, it announced a slowdown in the average pace of quantitative tightening (QT) from $60 billion per month to $40 billion, indicating a slowdown in the balance sheet reduction pace.
◦ Interest Rate Cut Expectations: Inflation data (CPI) will directly affect the month in which the Federal Reserve cuts interest rates. It is expected that the US QT will soon end and interest rate cuts will begin. The market expects that the declines caused by the previous pause in interest rate cuts may be recovered in the summer.
- Inflation Data:
◦ US CPI Announcement: The US will announce CPI data on Tuesday, with a previous value of 2.4% and an expected value of 2.4%.
Cryptocurrency Ecosystem News
- SEC Dynamics and Regulation:
◦ Tokenization Roundtable: The SEC held a roundtable on the theme "Tokenization: Moving Assets Onchain: Where TradFi and DeFi Meet" on the 12th. Participants included SEC officials, the director of the crypto working group office, Commissioner Hester Peirce, and representatives from Fidelity, Nasdaq, Invesco (Will Geyer), and other institutions.
◦ BlackRock and SEC Meeting (ETH ETF): BlackRock met with the SEC last Friday to discuss issues related to crypto ETFs, staking, and options.
◦ Expectations for New SEC Director: The market expects that the new SEC director may bring breakthroughs in tokenization and staking legislation.
- US Government Holdings:
Arkham data shows that the value of the US government's cryptocurrency holdings has risen to $21.156 billion, including:
▪ 198,012 BTC (worth about $20.69 billion)
▪ 59,965 ETH (worth about $150.7 million)
▪ $122 million in stablecoins
- Analyst Views and Market Predictions:
◦ Moustache: The current market structure is similar to that of 2016 and 2020, and the altcoin season for 2025 has officially begun.
◦ Hank Huang (CEO of Kronos Research): The crypto market is rebounding on global optimism, with ETH's strong rebound driving the altcoin market. Whether capital can effectively rotate from BTC to altcoins and the participation rate of retail investors are key observation points.
◦ Min Jung (Presto Research Analyst): The recent market rise is driven by optimistic sentiment from trade negotiations. The possibility of BTC breaking historical highs depends on the development of negotiations. BTC's dominance has returned to pre-bull market levels of 2021 and is experiencing typical rotation, with capital flowing into altcoins.
◦ Rekt Fencer: Satirizing the altcoin season, he believes that the recent rebound of about 10% may be over-interpreted, as BTC's dominance remains above 54%, a key threshold, and institutional preference for BTC may continue to influence capital flows.
◦ Rekt Capital: BTC is on the verge of entering the second round of price discovery upward trend, needing to hold the $104,500 support and stand above the recent accumulation range's upper edge, which is crucial.
◦ Josh Gilbert (eToro Analyst): The market is shifting towards a risk preference as tensions ease. Mentioning "Trump's willingness to negotiate" helps boost sentiment for risk assets (especially BTC). The market is reigniting optimistic sentiment.
◦ Trend Research: Predicts that ETH will reach $5,000 in this cycle, based on the end of US QT and interest rate cuts, new SEC director breakthroughs in tokenization and staking legislation, and innovations in ETH fund infrastructure. In an optimistic scenario, if BTC breaks $300,000, ETH is expected to rise to $10,000.
- US BTC Spot ETF Fund Flows:
◦ Last week, there was a net inflow of $920 million (BlackRock IBIT inflow of $1.03 billion, Fidelity FBTC inflow of $62.4 million, Grayscale GBTC outflow of $171.5 million).
◦ As of last Friday, the cumulative net inflow reached $40.806 billion, a historical high, with $5.3 billion absorbed in the past three weeks, and the holding volume exceeding 4.9 million BTC.
◦ US Spot ETH ETF Fund Flows: Last week, there was an outflow of $3.82 million.
◦ BlackRock ETH ETF Application: BlackRock submitted an application allowing its ETH ETF to conduct physical redemptions, supporting direct repurchase of ETH.
- ETH Performance:
◦ Last week, it rose by 37.01%, marking the highest weekly increase for ETH in the 18th week of the year, surpassing 33.1% in the same period of 2021.
- Institutional Purchases:
◦ MicroStrategy (Strategy): From May 5 to May 11, increased holdings by 13,390 BTC at an average price of $99,856 (totaling $1.34 billion).
◦ Coinbase (Cb): Increased holdings of $153 million in cryptocurrencies in the first quarter, holding $1.3 billion in crypto assets as of the report date, most of which are BTC.
Long-term Insights: Used to observe our long-term situation; bull market/bear market/structural changes/neutral state
Mid-term Exploration: Used to analyze what stage we are currently in, how long this stage will last, and what situations we will face
Short-term Observations: Used to analyze short-term market conditions; and the possibility of certain directions and events occurring under certain premises
Long-term Insights
• Non-liquid long-term whales
• Non-liquid long-term whales
• BTC US spot ETF fund flows
• Large inflows and outflows net positions on trading platforms
• Total selling pressure risk ratio of BTC spot
(The following chart shows non-liquid long-term whales)
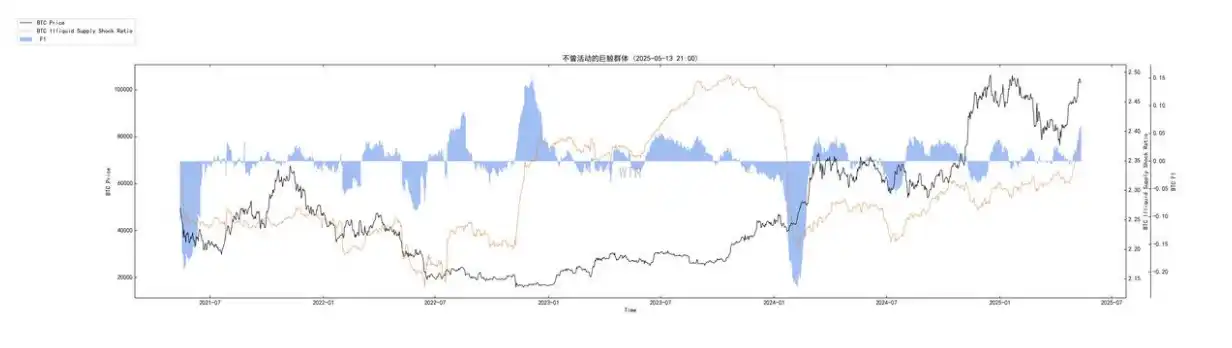
• This ratio has recently remained high, and the latest data shows an upward trend.
• This indicates that the BTC held long-term and not easily sold (non-liquid supply) is still increasing, or its growth rate exceeds the overall supply growth. This is generally seen as a positive signal, representing strong confidence from whale HODLers and lower potential selling pressure.
• Historical Comparison: Historically, the sustained rise of this indicator is often accompanied by price increases or serves as a buildup for upward movements.
• BTC price has risen in sync with the increase in non-liquid supply, indicating healthy support.
(The following chart shows BTC US spot ETF fund flows)
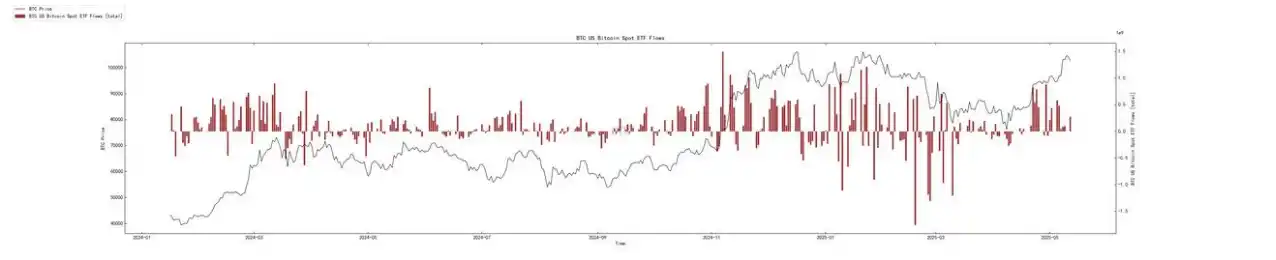
• After experiencing a period of slowed fund inflows and even brief outflows, the recent days (on the far right) show a clear recovery of net inflows.
• Although the daily inflow may not reach the peak when the ETF was first launched, the sustained net inflow indicates that traditional financial market funds are still actively allocating BTC.
• Historical Comparison: The significant inflow at the beginning of 2025 was an important driver of this round of market movement. The recent recovery inflow has supported and propelled market confidence and prices.
(The following chart shows large inflows and outflows net positions on trading platforms)
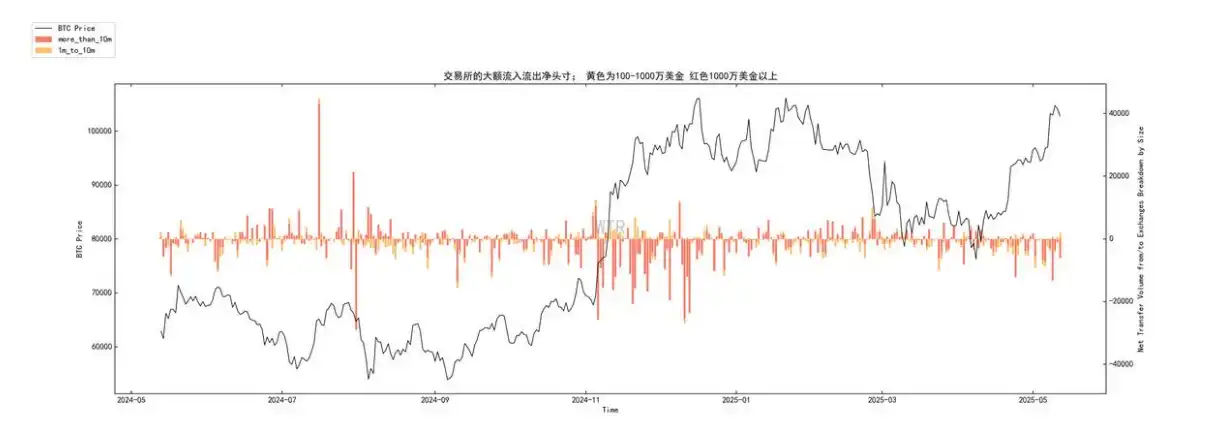
• Red bars (> $10 million): After the price rose to a high level, there were some intermittent net inflows (large holders may be cashing out or managing risks), but there was no sustained large-scale outflow to trading platforms. In recent days, there has even been a small amount of net outflow (red negative values).
• Orange bars ($1 million to $10 million): Show a more mixed performance, but overall, there have been no sustained large-scale net inflows during the price rise. In recent days, there have also been net outflows.
• Summary: Although there are signs of some large holders cashing out at high levels, there has not been a trend of panic selling or large-scale transfers of BTC to trading platforms in preparation for sale. Instead, in recent days, there are signs of large addresses net outflow from trading platforms, which is usually interpreted as accumulation or transfer to long-term storage, a positive signal.
(The following chart shows the total selling pressure risk ratio of BTC spot)
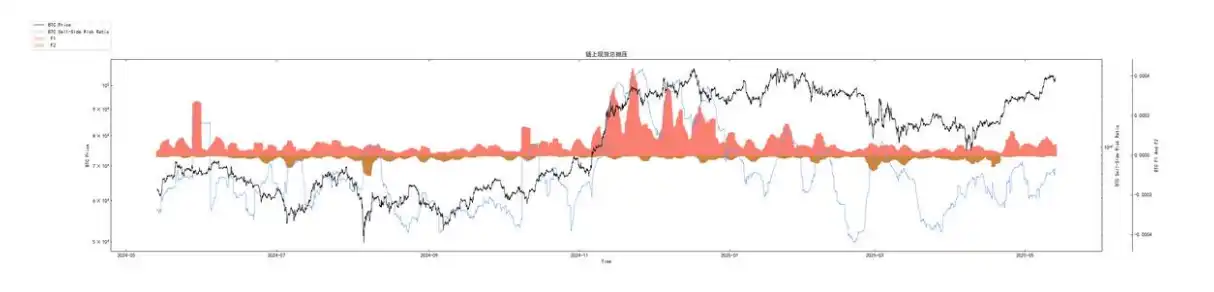
This ratio is currently at a relatively low-medium position. It is not in the extremely low "excellent buying zone," but far from the high-risk area seen at historical bull market tops. During the recent price rise, this indicator has increased, but the increase is moderate.
• Historical Comparison: Before the significant price increase at the end of 2023 to early 2024, this indicator was at a low level. Historically, this indicator is very high at bull market peaks.
• Currently, as prices rise, the selling pressure risk ratio is moderately increasing, which aligns with the characteristics of a healthy bull market, indicating that the market has not accumulated excessive short-term profit-taking pressure due to the rapid price increase.
Reanalyzing the macro and on-chain logic:
- Starting Point: Improvement in the macro environment + ETF narrative drive (news aspect and Figure 2)
◦ News Aspect: The Federal Reserve's QT slowdown, interest rate cut expectations, and easing trade tensions have enhanced market risk appetite.
◦ Figure 2 (ETF): The strong capital inflow into ETFs at the beginning of the year validated the demand for BTC allocation from traditional funds, which is a crucial foundation for this round of market movement. Recently, ETF capital has re-entered the market, injecting new momentum and confidence.
◦ Analysis: The macro tailwind combined with structural demand (ETF) has jointly built the foundation for the bull market.
- Continuation: Enhanced HODLer confidence and supply tightening (Figure 1)
◦ Figure 1 (Non-liquid long-term whales): Against the backdrop of rising prices and continuous ETF accumulation, non-liquid supply continues to increase, indicating that long-term investors (HODLers) are not selling off in large quantities due to price increases; rather, they are holding back and even increasing their positions. This has led to a tightening of the actual tradable supply.
◦ News Aspect: Institutions like MicroStrategy continue to increase their BTC holdings, consistent with the trend of increasing non-liquid supply.
◦ Therefore: Strong HODLing behavior + continuous ETF purchases further reduce the supply shock effect of BTC available for trading, providing strong support for prices.
- Verification: Large holder behavior and market risk assessment (Figures 3 and 4)
◦ Figure 3 (Net outflows from large trading platforms): Despite high prices, large addresses have recently shown a trend of net outflows from trading platforms, indicating that whales/institutions are still accumulating or transferring BTC to cold wallets for long-term holding, rather than large-scale selling. This further reinforces expectations of supply scarcity.
◦ Figure 4 (Total selling pressure risk ratio): This is at a moderately low level, indicating that the market is not overheated, and the current upward trend has a certain degree of health, not purely driven by short-term speculation.
◦ Figure 1 (Non-liquid long-term whales): Also indicates that the market is far from reaching a frenzied top.
◦ News Aspect: Analysts believe that BTC is on the verge of entering the second round of price discovery, needing to hold key support (such as $104,500). On-chain data shows the solidity of this support.
◦ Thus: The large holders' accumulation behavior and manageable market risks provide space and possibilities for further price increases. The market structure is relatively healthy.
- Progressively: Rotation expectations and new catalysts (news aspect)
◦ News Aspect: The market is paying attention to the progress of the ETH ETF and the possibility of capital rotating from BTC to altcoins. The decline in BTC's market share is seen as one of the signals of the altcoin season.
◦ On-chain correlation: If BTC continues to be strong and attracts more capital, when its price stabilizes or the rate of increase slows, some funds seeking higher alpha may flow into ETH and other altcoins. This may be reflected in BTC-related on-chain indicators (such as the slowdown in the growth rate of non-liquid long-term whales or increased short-term capital activity on trading platforms), but currently, BTC's fundamentals remain very strong.
◦ Summary: Currently, BTC remains the absolute market leader. If the macro environment and ETF capital flows continue to improve, BTC is expected to continue leading. Clear progress on the ETH ETF will be the next important market catalyst and observation point.
Future Outlook:
Short to Mid-term Outlook:
◦ High probability of continued BTC strength: Given the strong growth of non-liquid long-term whales, the re-entry of ETF capital, signs of large holder accumulation, and the not-overheated total selling pressure risk indicators, BTC prices are expected to continue to oscillate upward and may even challenge previous highs. If the mentioned support at $104,500 can be maintained, it will be an important signal.
◦ Focus on the sustainability of ETF capital flows: Whether ETF capital can maintain stable net inflows (as shown in the recent trend in Figure 2) is crucial. If there are sustained large-scale net outflows, caution should be exercised regarding the risk of a pullback.
◦ Impact of macro data: Macroeconomic events such as CPI and Federal Reserve meetings will still bring market volatility. Inflation data and dovish signals that meet expectations will further boost the market.
◦ Progress on ETH ETF: Any substantial positive news regarding the ETH ETF could ignite market enthusiasm for ETH and related ecosystems in advance, potentially diverting some short-term capital attention from BTC, but in the long term, it is beneficial for the entire crypto market.
Mid to Long-term Outlook:
◦ Deepening bull market phase: The characteristics shown in current on-chain data (high non-liquid long-term whales in the early stages of growth, manageable risks) align with the characteristics of a small bull market transitioning from early to mid-stage. If the macro environment continues to improve (such as the Federal Reserve starting a rate-cutting cycle), combined with the continuous penetration of compliant channels like ETFs, the bull market may further deepen.
◦ Price discovery and increased volatility: As prices continue to reach new highs, market volatility may increase. At this time, it is essential to closely monitor the non-liquid long-term whales in Figure 1 and the total selling pressure risk ratio in Figure 4; if they quickly approach historical top regions, market risks will sharply rise, necessitating caution regarding potential phase tops or deep pullbacks.
◦ Long-term impact of tokenization and regulation: The SEC's focus on tokenization and potential policy breakthroughs from the new director mentioned in the news are long-term positives. If compliance and scaling of asset tokenization can be achieved, it will open up significant incremental space for the crypto market.
◦ Arrival of the altcoin season: When BTC's upward momentum slows or enters a high-level consolidation, and positive developments like the ETH ETF are realized, the likelihood of a large-scale rotation of capital into altcoins, signaling the "altcoin season," will increase. At that time, BTC's market share will be an important observation indicator.
Mid-term Exploration
• Liquidity supply volume
• Cost structure at various price levels
• USDC purchasing power composite score
• Whale composite score
• Incremental model
• Liquidation structure
(The following chart shows liquidity supply volume)
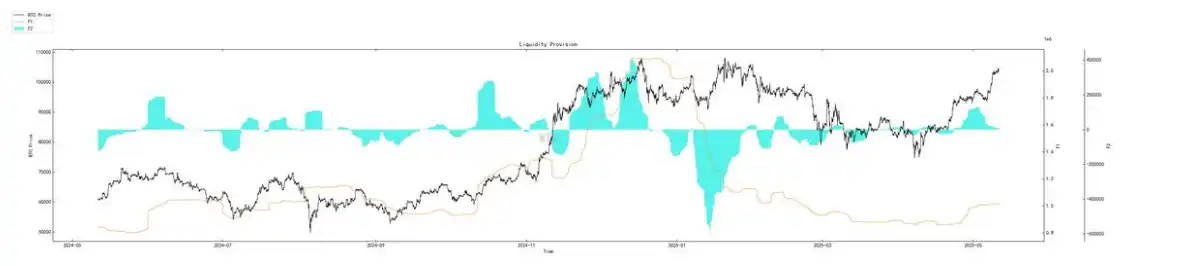
From the current situation, liquidity supply volume is diminishing and decreasing. The recent market rise may belong to a low-volume trend, which is not sustainable in a stagnant environment.
(The following chart shows cost structure at various price levels)
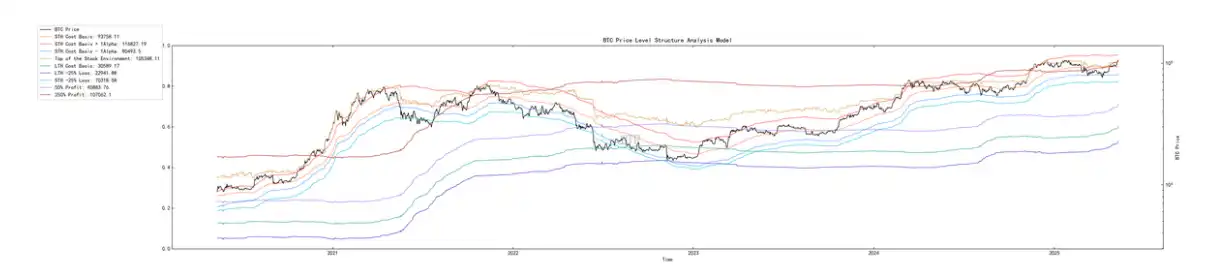
The market's stock top is facing a stock upper limit dilemma around $105,000. If there is no significant incremental supply afterward, it may peak at this price level. Meanwhile, if the market remains in a stock structure, it may experience high-intensity oscillations within the $80,000-$105,000 range. Of course, the current range provided is a rough estimate of the market liquidity support price range. If an incremental trend occurs, emotional pullbacks, or deep liquidation of leverage, this range may be broken.
(The following chart shows USDC purchasing power composite score)
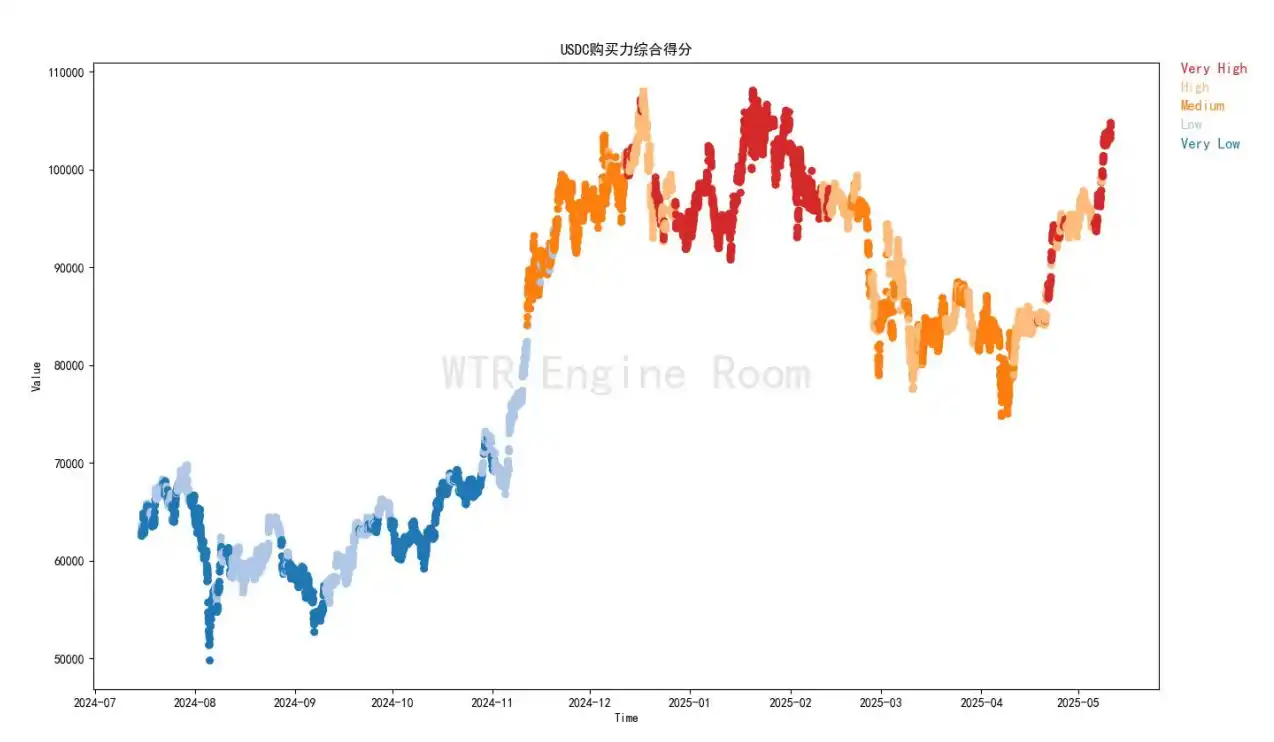
Currently, USDC funds still have relatively high purchasing power, suggesting that the market may still have residual liquidity supporting market pricing in the short term.
(The following chart shows whale composite score)
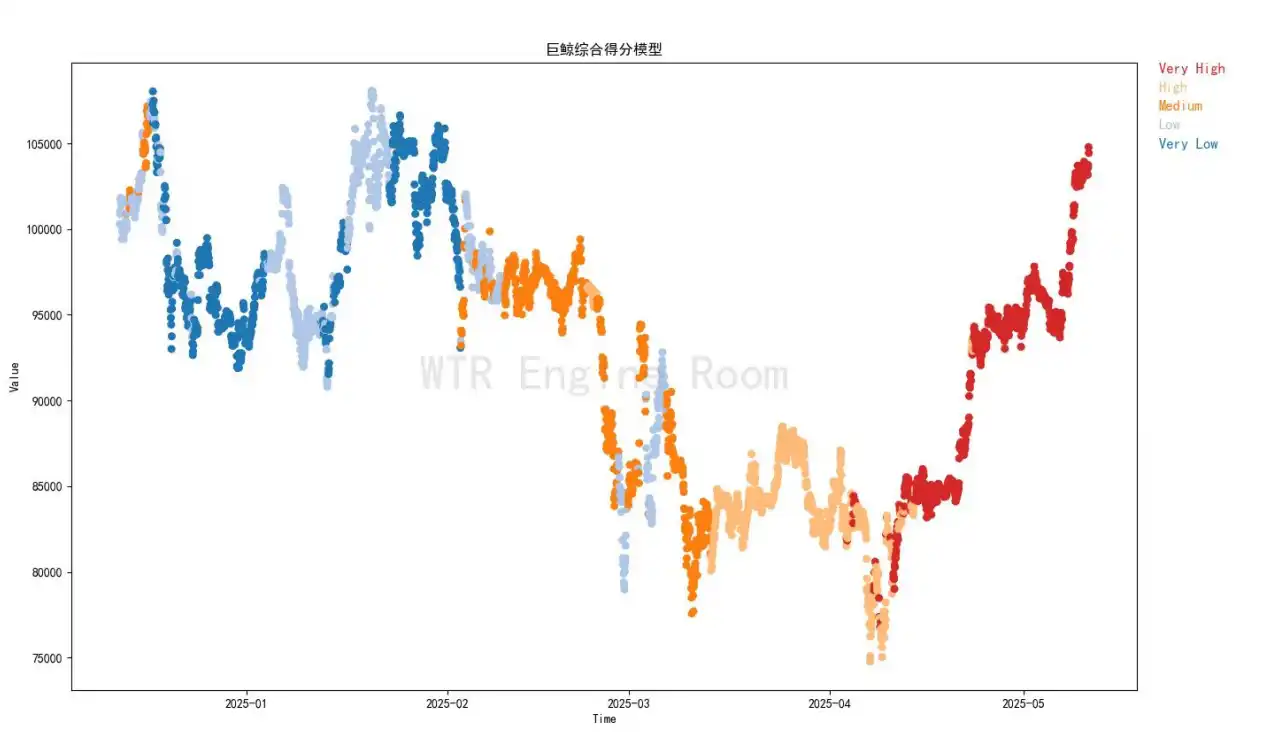
Whales' purchasing power remains at a high level, and the current market trend has not shown any overall shaking or divergence among whales.
(The following chart shows incremental model)
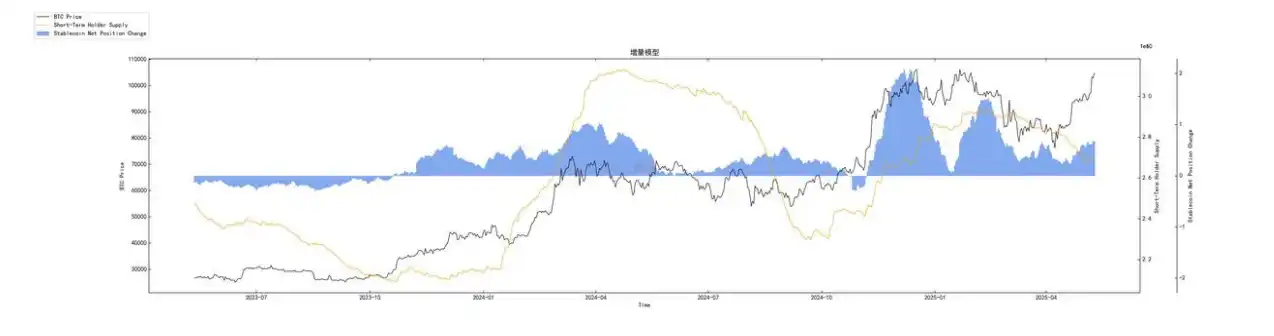
The current supply strength of incremental funds is insufficient, indicating that the market may need to grow, or the current incremental funds do not intend to chase prices excessively.
(The following chart shows liquidation structure)
The market is switching from a short liquidation structure to a long liquidation structure. If there is no incremental fund supply in the market, there may be significant volatility in the coming period.
Short-term Observations
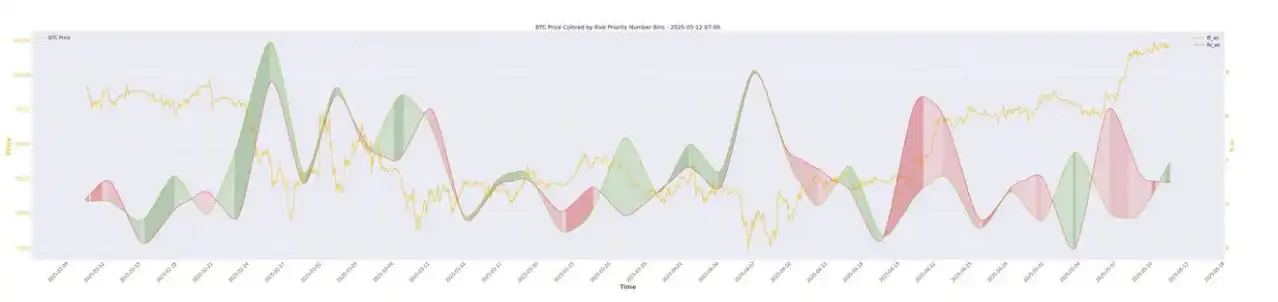
• Derivative risk coefficient
• Options intent transaction ratio
• Derivative trading volume
• Options implied volatility
• Profit and loss transfer volume
• New addresses and active addresses
• Ice sugar orange trading platform net positions
• Pionex trading platform net positions
• High-weight selling pressure
• Global purchasing power status
• Stablecoin trading platform net positions
• Off-chain trading platform data
Derivative rating: The risk coefficient is in the red zone, indicating high derivative risk.
(The following chart shows derivative risk coefficient)
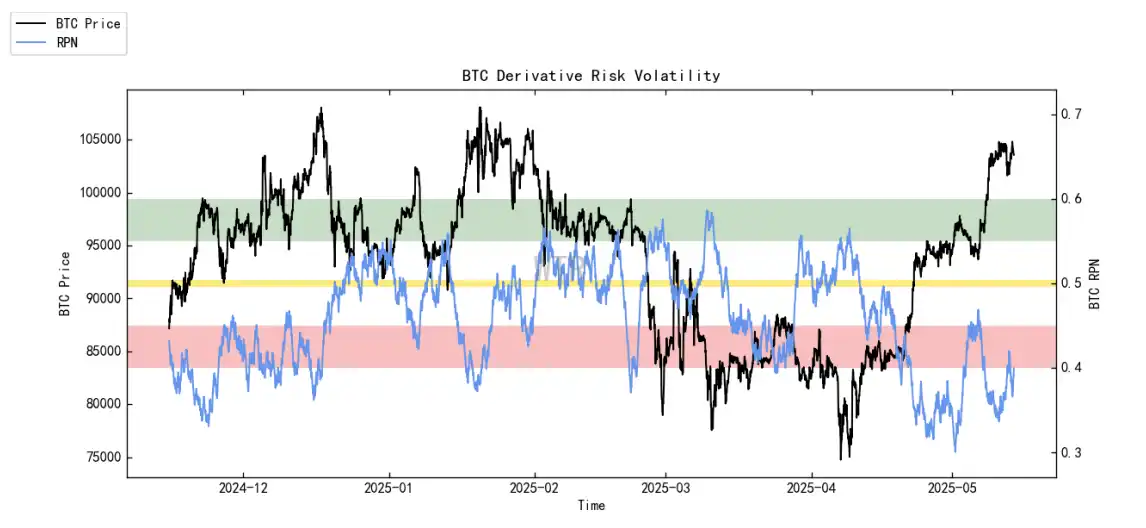
The risk coefficient has re-entered the red zone with the market's continued short squeeze, but compared to last week, the intensity of the short squeeze has slightly decreased.
(The following chart shows options intent transaction ratio)
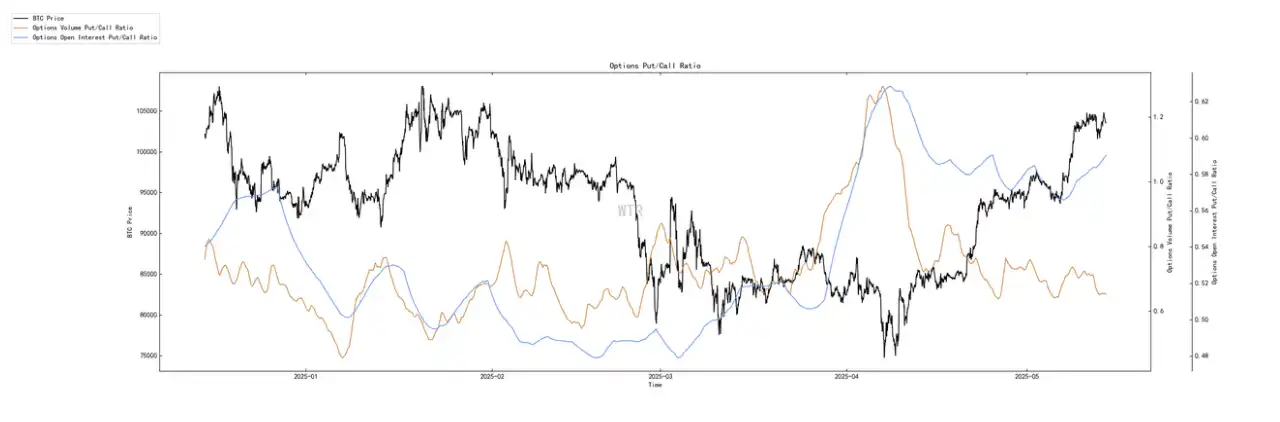
The proportion of put options has slightly increased, with trading volume remaining flat compared to last week.
(The following chart shows derivative trading volume)
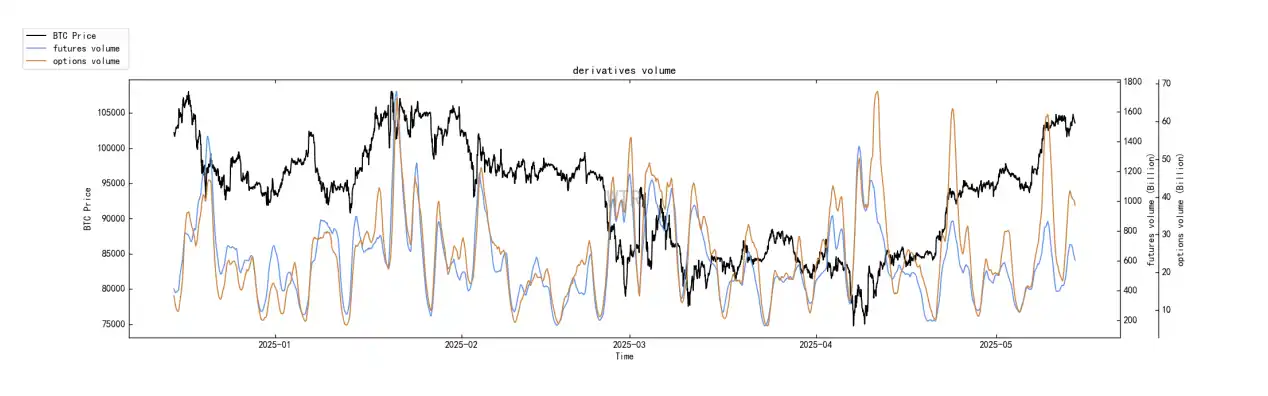
Derivative trading volume is at the median.
(The following chart shows options implied volatility)
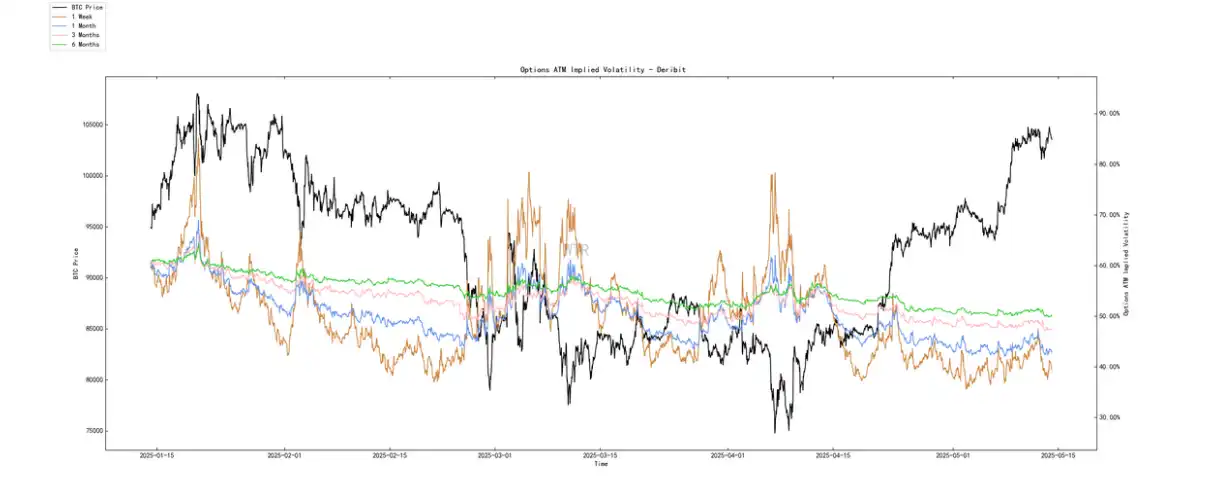
Options implied volatility has only shown low fluctuations in the short term.
Sentiment state rating: Neutral
(The following chart shows profit and loss transfer volume)
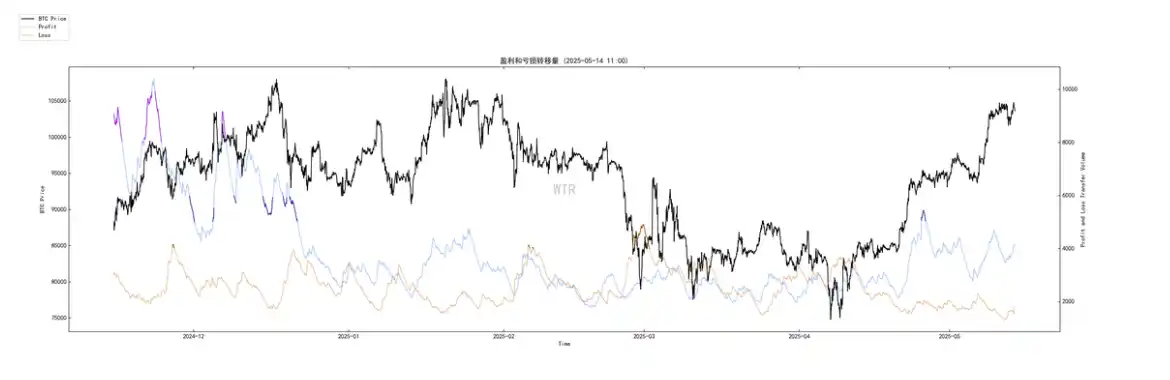
Although the market is experiencing a continued short squeeze, the market's sentiment itself has not continuously risen into a frenzy.
(The following chart shows new addresses and active addresses)
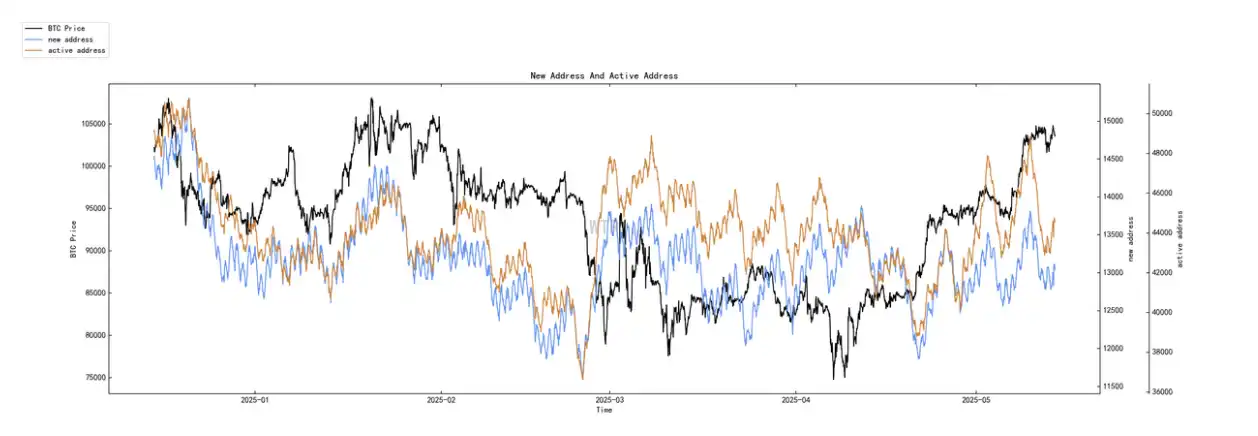
The number of new active addresses is at the median.
Spot and selling pressure structure rating: BTC and ETH are in a state of continuous large outflows.
(The following chart shows net positions on the Ice Sugar Orange trading platform)
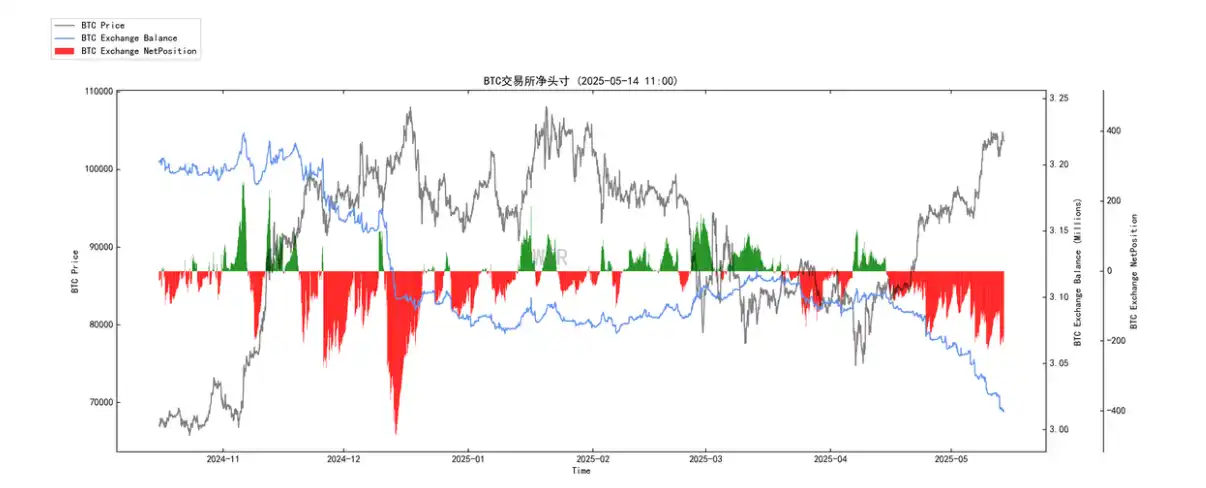
Currently, BTC is experiencing continuous large outflows.
(The following chart shows net positions on the Pionex trading platform)
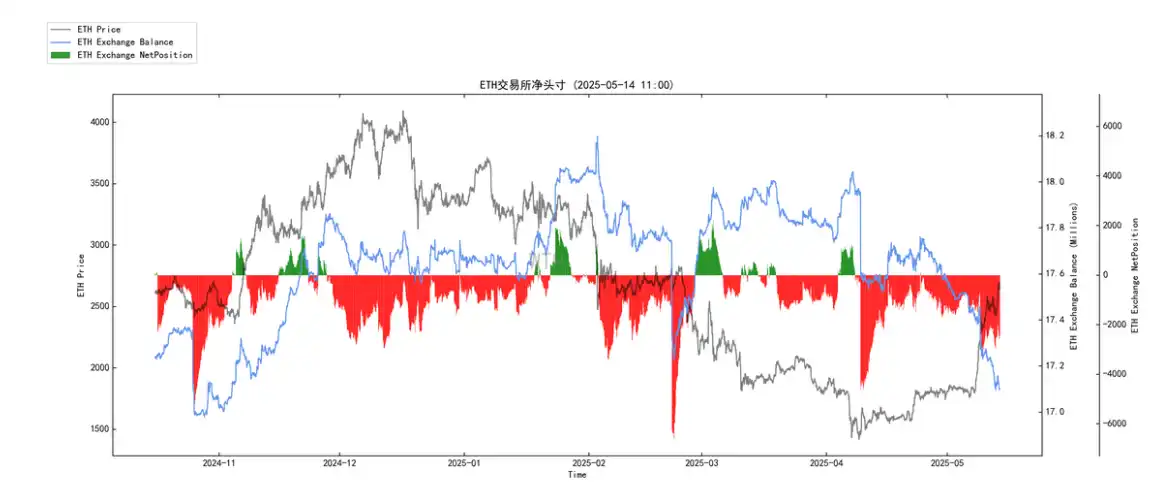
Currently, ETH is experiencing continuous large outflows.
(The following chart shows high-weight selling pressure)
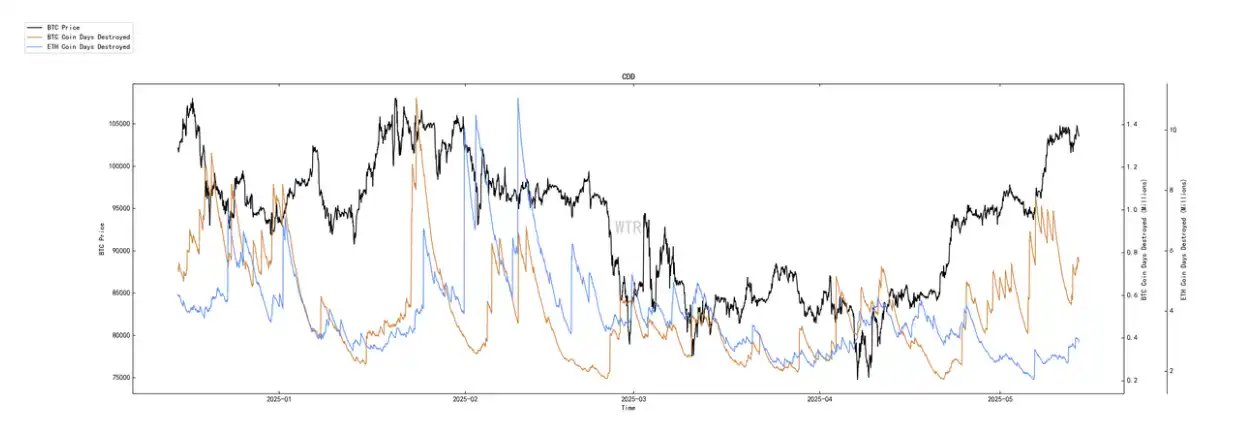
There is a small amount of high-weight selling pressure, but it has currently eased.
Purchasing power rating: Global purchasing power has significantly rebounded, and the purchasing power of stablecoins is basically flat compared to last week.
(The following chart shows global purchasing power status)
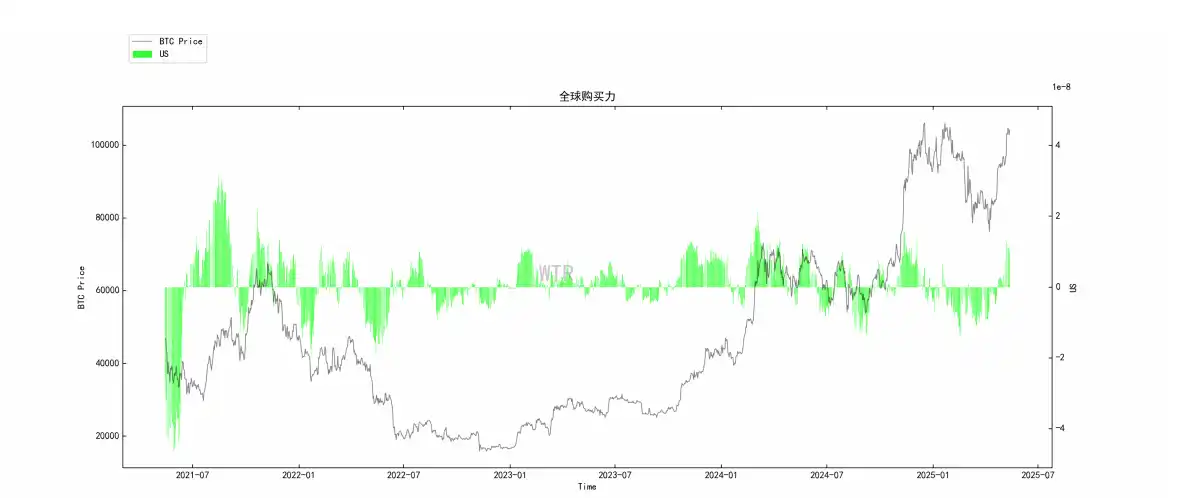
Global purchasing power has rebounded significantly again.
(The following chart shows net positions on the USDT trading platform)
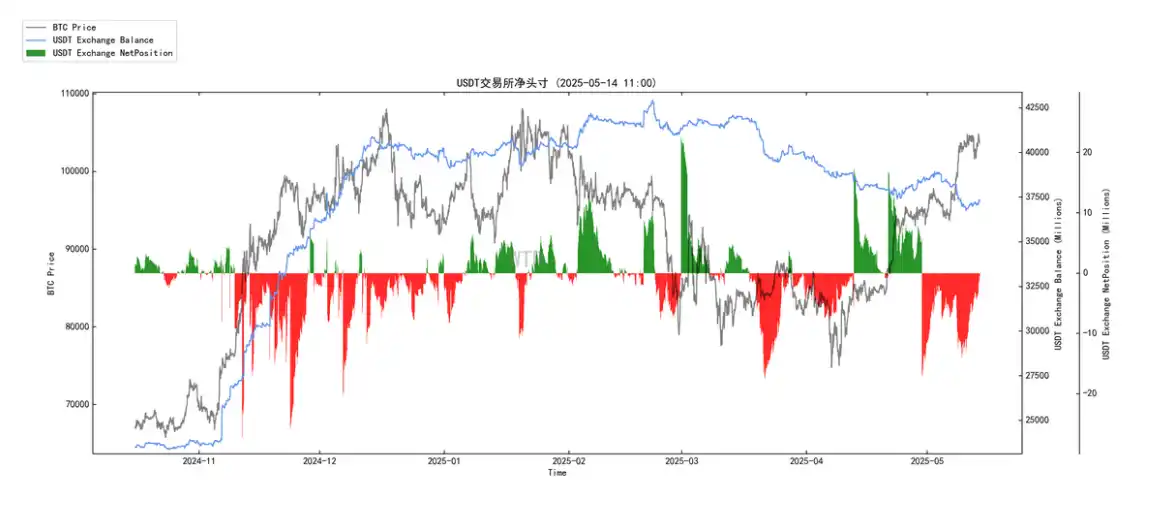
The overall purchasing power of stablecoins is flat compared to last week.
Off-chain trading data rating: This week's data website is down, and there is currently no off-chain trading data.
This Week's Summary:
News Analysis and Summary:
Short-term:
CPI data is key: If inflation data remains moderate or declines, it will solidify expectations for Federal Reserve interest rate cuts, benefiting risk assets, and the crypto market is expected to continue its upward trend. Conversely, this may bring short-term pullback pressure.
BTC may continue to oscillate upward, but volatility may increase: The market may need to wait for clearer macro signals (such as the first interest rate cut) after digesting the existing ETF benefits before new large-scale incremental capital enters. $104,500 is an important observation point.
ETH ETF news will dominate ETH and some altcoin sentiment: Any positive or negative news regarding the ETH ETF could trigger significant market volatility. The actions of BlackRock are worth close attention.
Mid-term:
The "summer window" is a core focus: The market generally expects a substantial shift in Federal Reserve policy (such as a clear interest rate cut path) and further clarification of tariff policies this summer. If both are favorable, it will provide strong macro support for the crypto market.
The fate of the ETH ETF: If approved, it is expected to drive ETH and related altcoins to move independently, creating a scenario of "BTC as the stage, ETH as the performance, and altcoins celebrating." The target of $5,000 for ETH is not out of reach under optimistic sentiment.
Whether capital rotation is smooth: Whether BTC's dominance can continue to decline and whether capital will flow into altcoins on a large scale as expected are key factors determining whether the altcoin season can fully explode. Caution is needed against "false breakouts" and the aftermath of hype in certain hotspots.
Long-term:
The potential of tokenization and asset on-chain: The SEC's roundtable is just the beginning. If a favorable regulatory framework can be established, the tokenization of traditional assets will bring trillions of incremental space to the crypto market.
The trend of institutional entry remains unchanged: Although the pace may slow down at times, the trend of traditional financial institutions allocating crypto assets (especially BTC and ETH) is expected to continue.
Clarification of regulations is one of the biggest driving forces: Clear regulations will reduce uncertainty, attract more conservative capital, and promote industry innovation.
In summary: The current market sentiment is relatively optimistic, primarily driven by improved macro expectations and the successful capital inflow of the BTC ETF. The ETH ETF is the next core narrative. However, market volatility remains high and depends on multiple conditions being met (such as CPI data, actual actions by the Federal Reserve, ETF approvals, etc.). It is essential to remain rational, be cautious of "overinterpretation" of short-term rebounds, and pay attention to key changes in capital flows and market structure, especially regarding altcoin selections, where the importance of fundamentals and narratives will become more pronounced.
On-chain Long-term Insights:
Macro improvement + structural demand from ETFs enhances whale HODLer confidence;
Non-liquid supply continues to push large holders to accumulate, and market selling pressure is manageable;
Healthy risk indicators provide a sustainable basis for BTC price to continue rising (in the future) with new catalysts like the ETH ETF expected to connect, allowing the bull market to develop further;
Caution is needed regarding the rapid rise of on-chain risk data in the mid to late stages.
• Market Tone:
Currently, various on-chain indicators and news aspects point to a positive market environment, with BTC's role as the leader remaining solid.
For now, whether the positive trend can continue is crucial, as on-chain, macro, and regulatory aspects need to keep releasing favorable signals.
On-chain Mid-term Exploration:
Liquidity is diminishing, and low-volume increases are hard to sustain.
The stock upper limit is around $105,000; insufficient incremental supply may trigger range oscillations.
USDC's short-term purchasing power still supports market pricing.
Whale purchasing power remains strong, with no signs of divergence.
Incremental capital supply is insufficient, lacking momentum for chasing prices.
The market is shifting to a long liquidation structure, and the absence of incremental supply may exacerbate volatility.
• Market Tone:
Key price levels, intense competition.
Around $105,000 is the stock top area for BTC.
From the perspective of derivatives, it has entered the tail end of a short liquidation chain.
After the "short fuel" is exhausted, new capital needs to be injected to ensure healthy trading for BTC, thereby breaking through the stock upper limit.
If BTC's pricing gets stuck around $105,000, it may lead to a lack of capital support due to excessive profits in the market.
On-chain Short-term Observations:
The risk coefficient is in the red zone, indicating high derivative risk.
The number of new active addresses is at the median.
Market sentiment state rating: Neutral.
Net positions on trading platforms show BTC and ETH are in a state of continuous large outflows.
Global purchasing power has significantly rebounded, and the purchasing power of stablecoins is basically flat compared to last week.
The probability of not breaking below $95,000 to $100,000 in the short term is 80%.
• Market Tone:
Current market sentiment, even in the face of continuous short squeezes, has not entered the "frenzy" zone and remains within a neutral range. Comprehensive observation data indicates that there is preliminary divergence at the current price level in the short-term market, but there is still the possibility of further short squeezes, with a low probability of a pullback.
Risk Reminder: The above is all market discussion and exploration, and does not constitute directional opinions for investment; please approach with caution and guard against market black swan risks.
This article is from a submission and does not represent the views of BlockBeats.
免责声明:本文章仅代表作者个人观点,不代表本平台的立场和观点。本文章仅供信息分享,不构成对任何人的任何投资建议。用户与作者之间的任何争议,与本平台无关。如网页中刊载的文章或图片涉及侵权,请提供相关的权利证明和身份证明发送邮件到support@aicoin.com,本平台相关工作人员将会进行核查。


