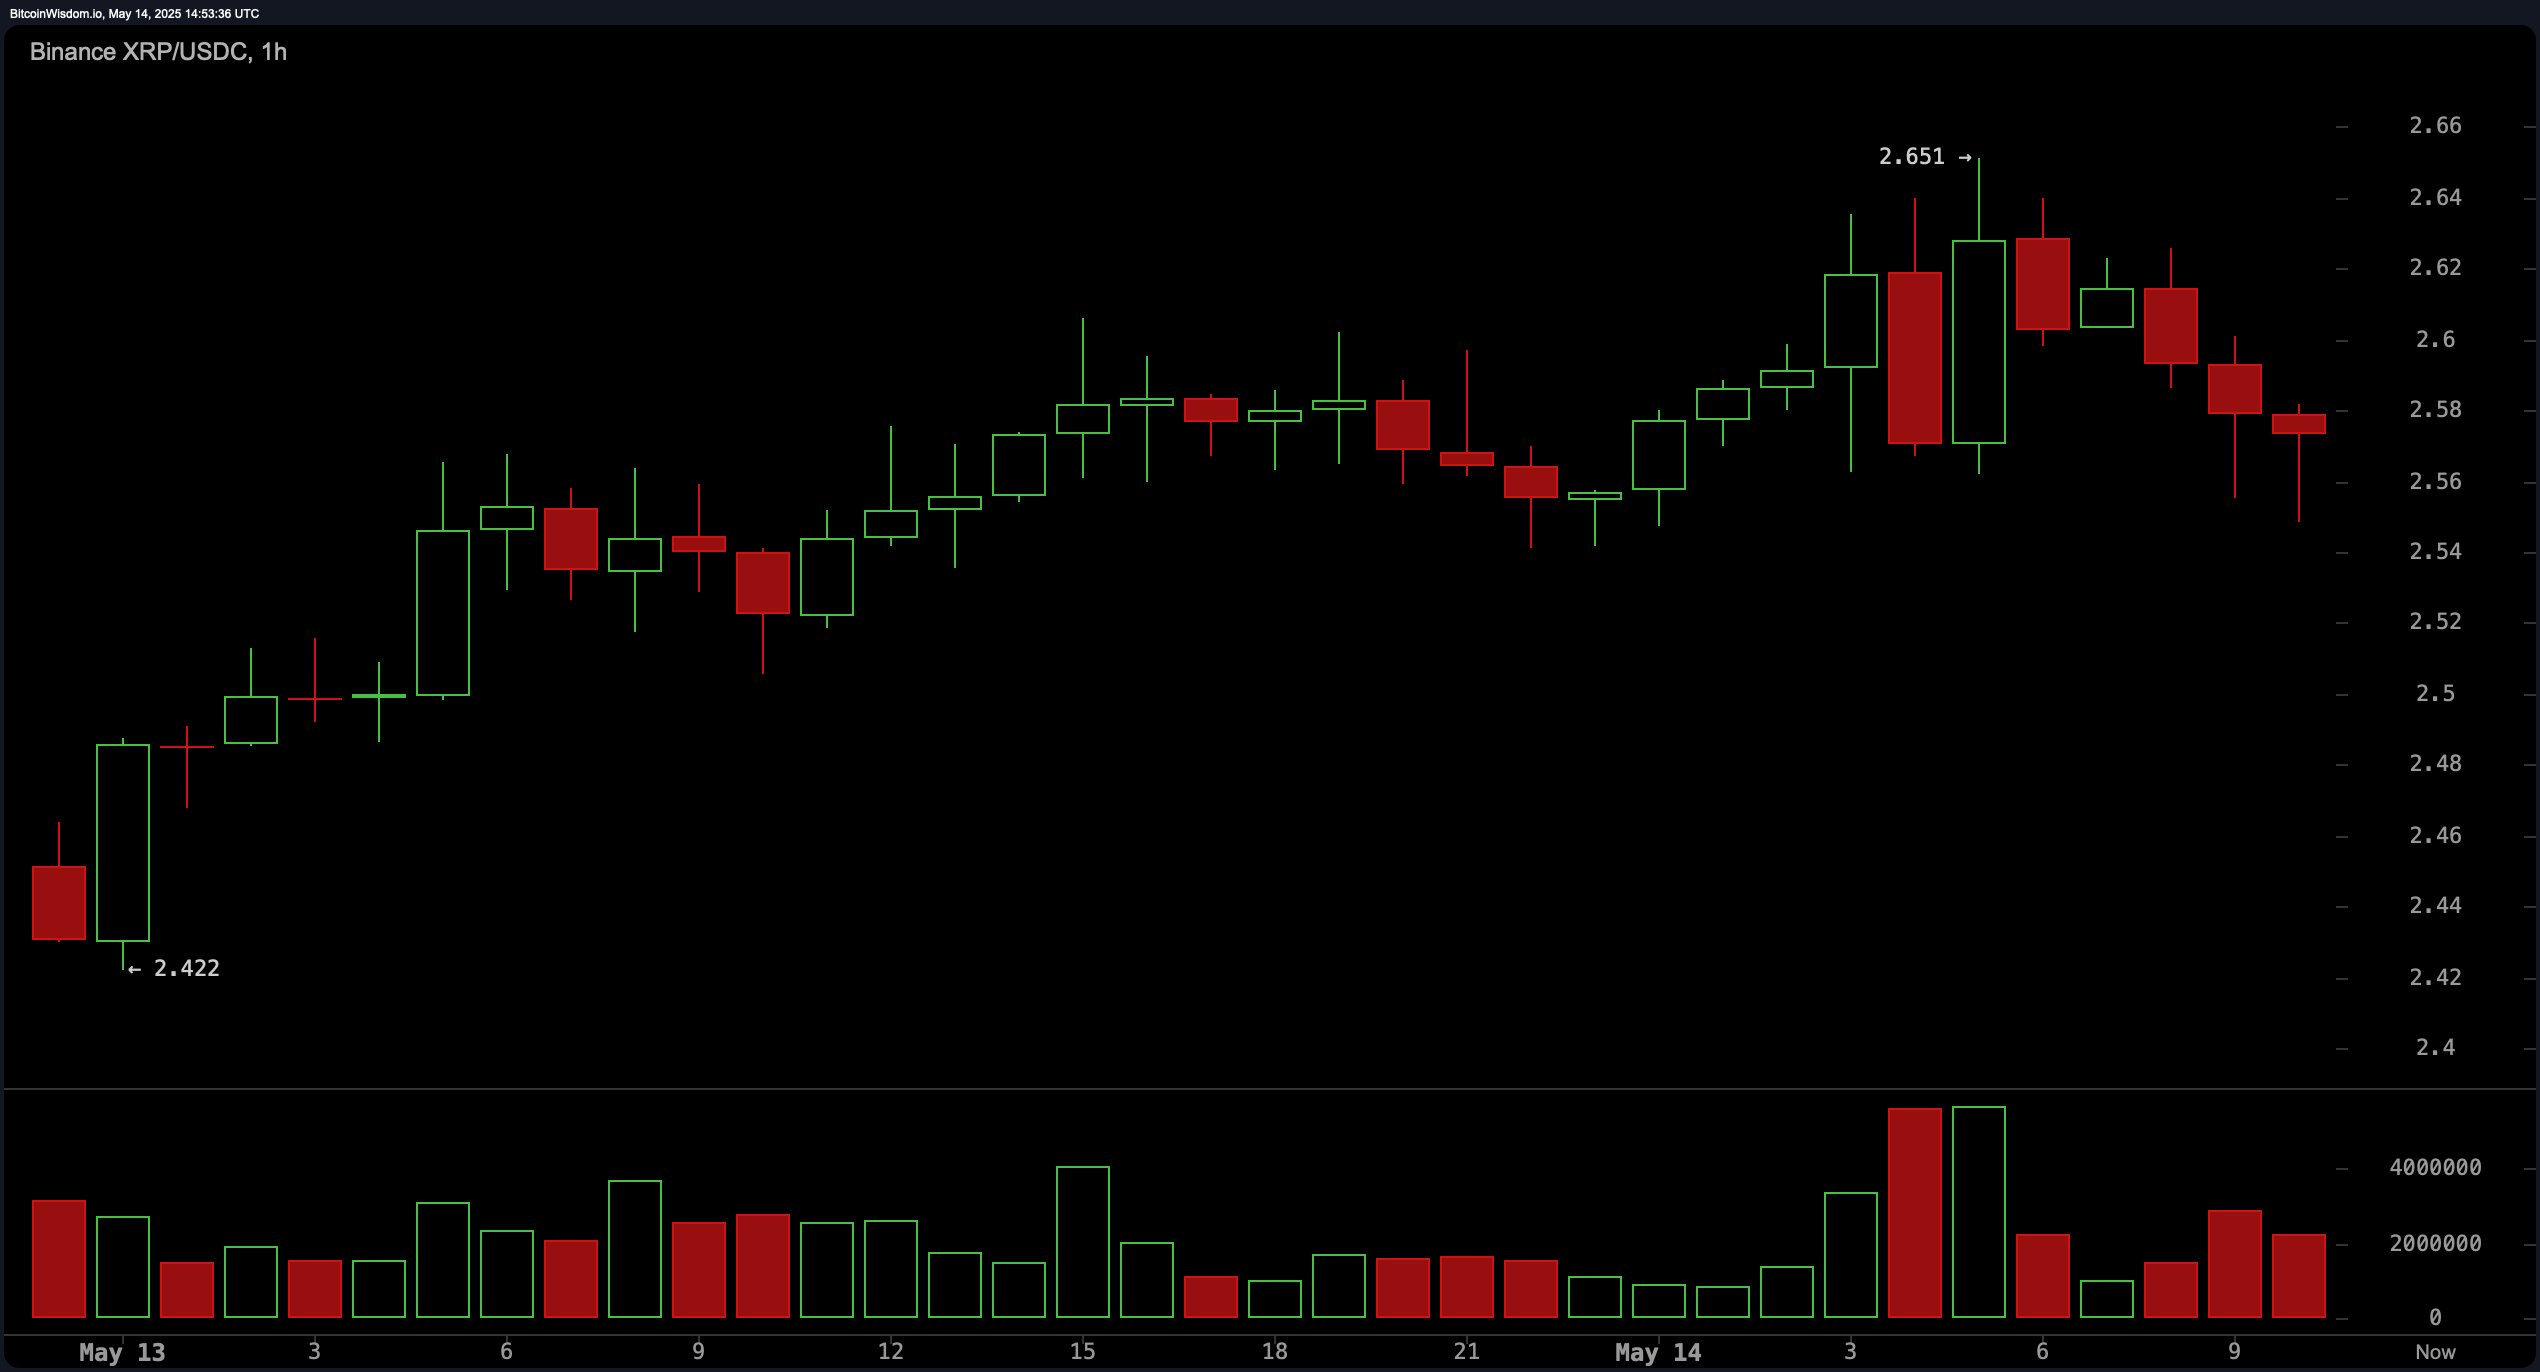
On the 1-hour chart, XRP’s bullish momentum shows signs of exhaustion, despite the recent upward movement. After peaking at $2.651, the price action has been marked by consecutive red candlesticks and declining volume, which signals a potential short-term retracement. The appearance of a bearish divergence—indicated by lower volume accompanying tests of similar price levels—suggests a cooling phase. Traders may find opportunities by watching support around $2.55–$2.57; however, a break below $2.54 may lead the price to test the $2.50 level rapidly, warranting caution for short-term positions.

XRP/USDC 1H chart via Binance on May 14, 2025.
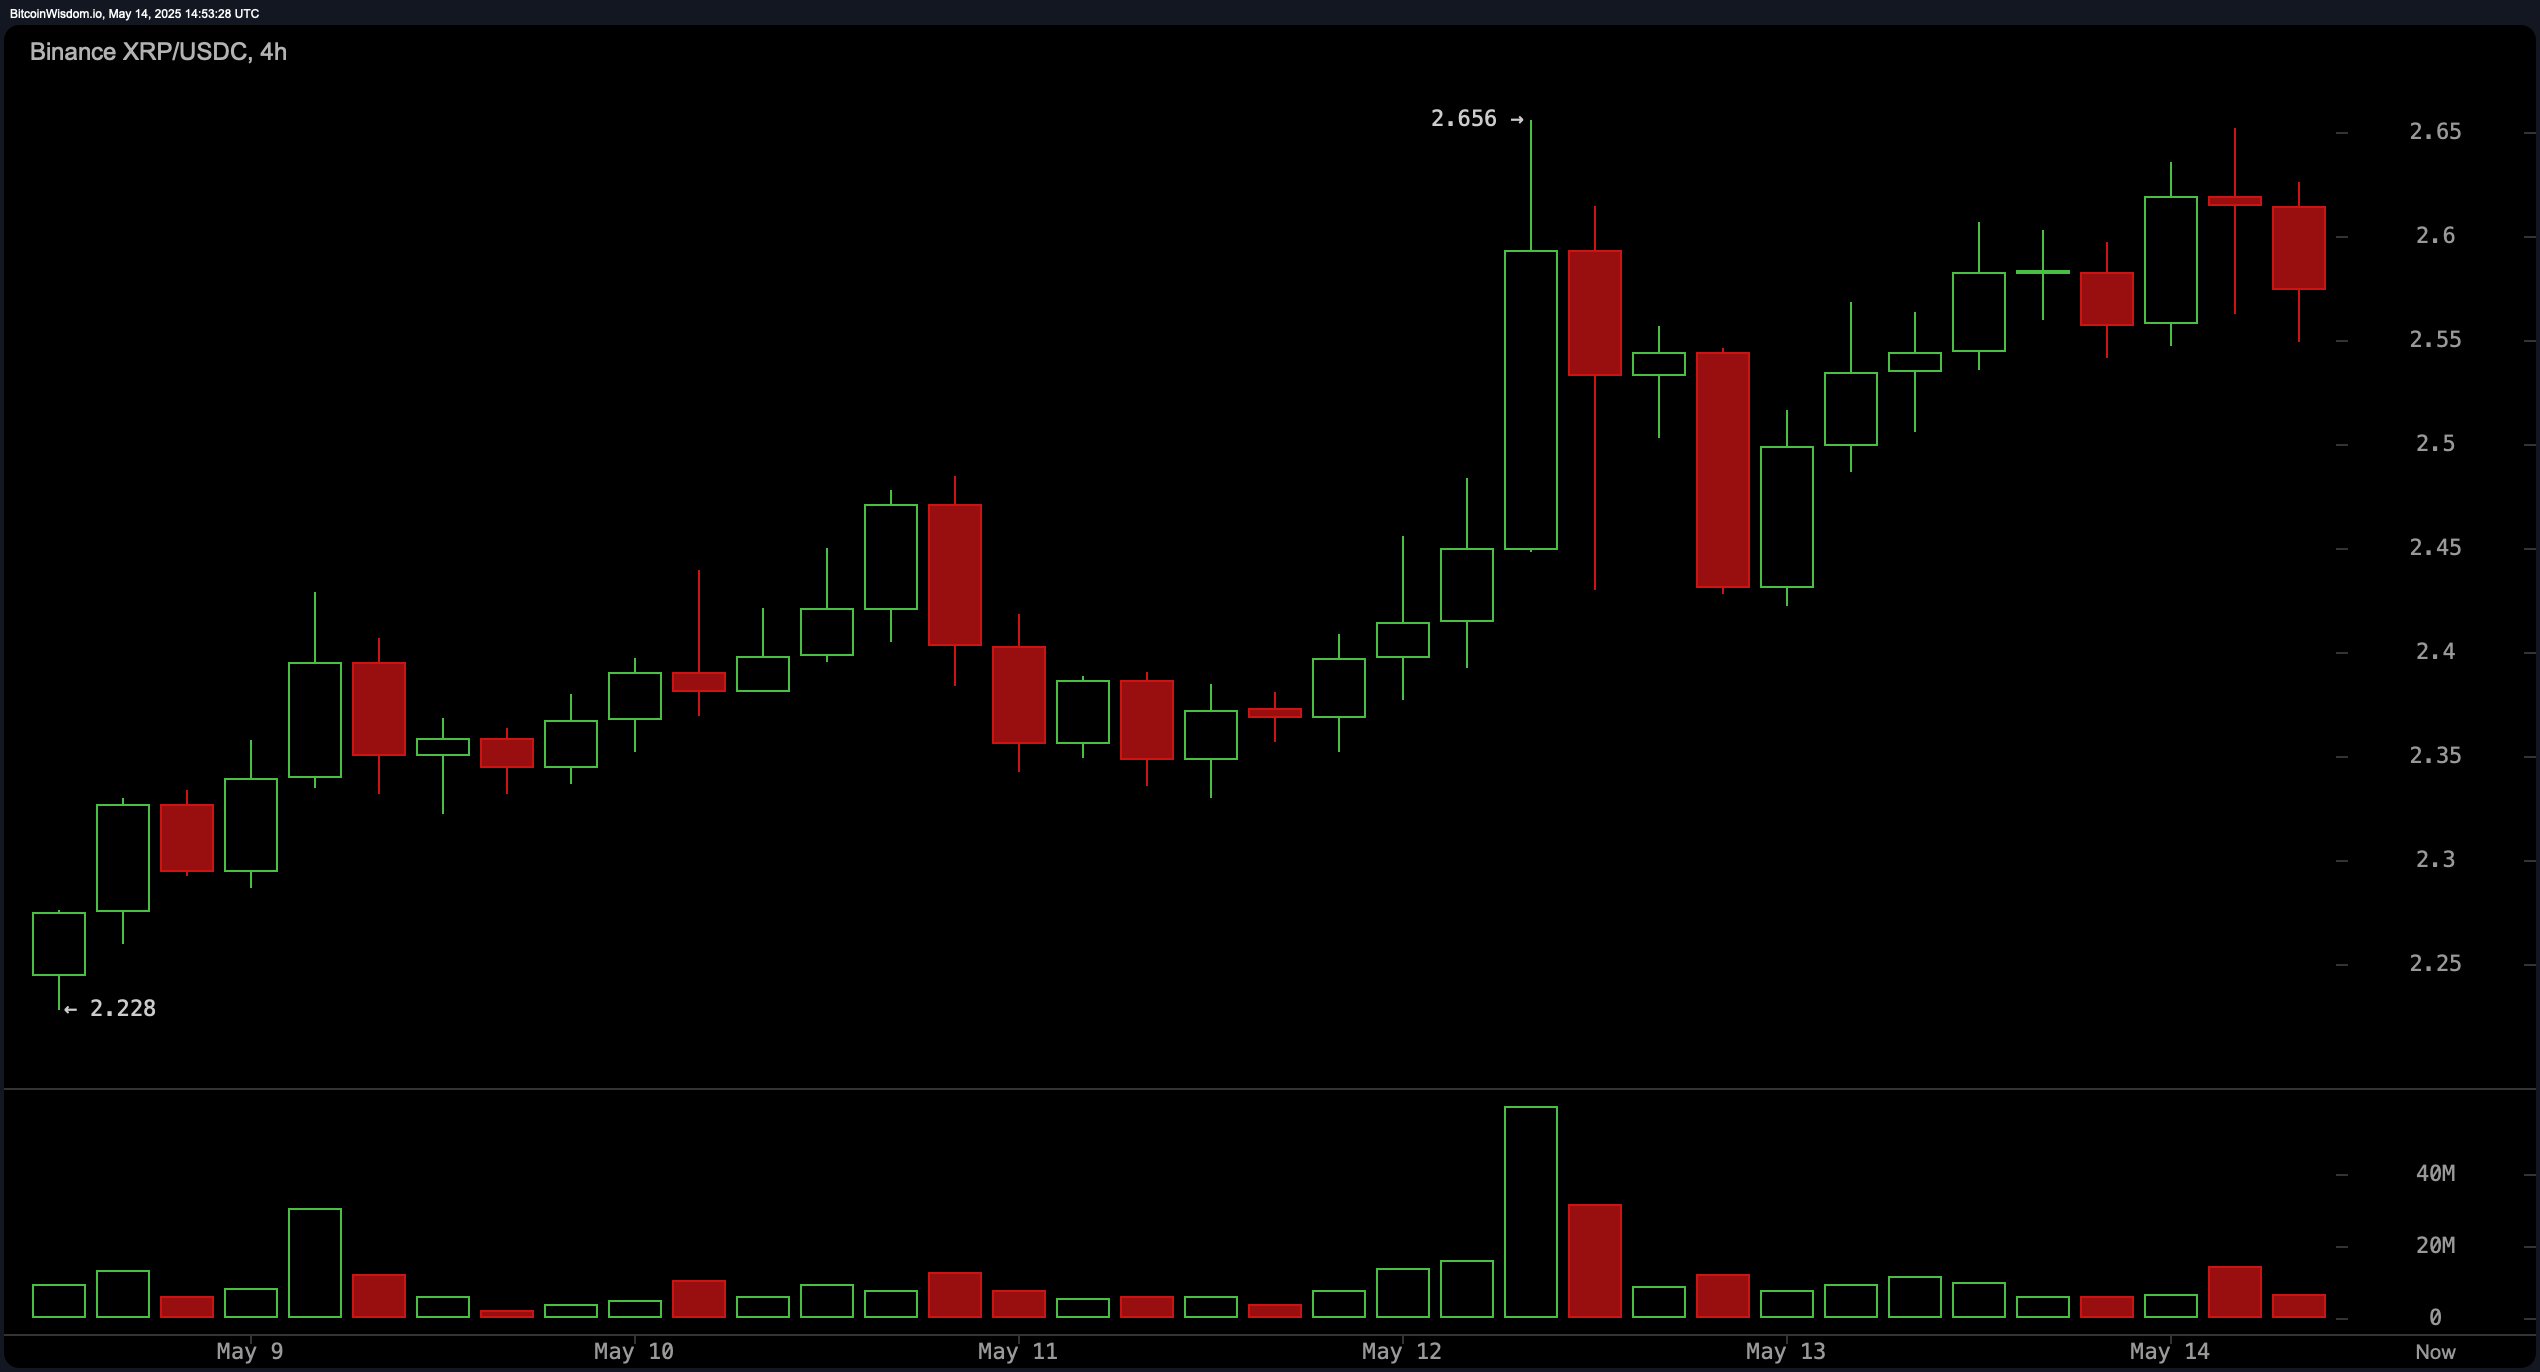
The 4-hour chart presents a sustained uptrend, although early signs of waning momentum are apparent. Price action following a large bullish candle has transitioned into a series of indecisive candlesticks, potentially forming a bullish flag or signaling the beginning of a distribution phase. A notable upper wick rejection at $2.656 illustrates heightened selling pressure near that resistance. As long as XRP holds above $2.50, the medium-term bullish structure remains intact. Entries near the $2.45–$2.50 range could present favorable risk-reward setups, while a confirmed breakout above $2.66, supported by increased volume, could validate a continuation to higher price targets.

XRP/USDC 4H chart via Binance on May 14, 2025.
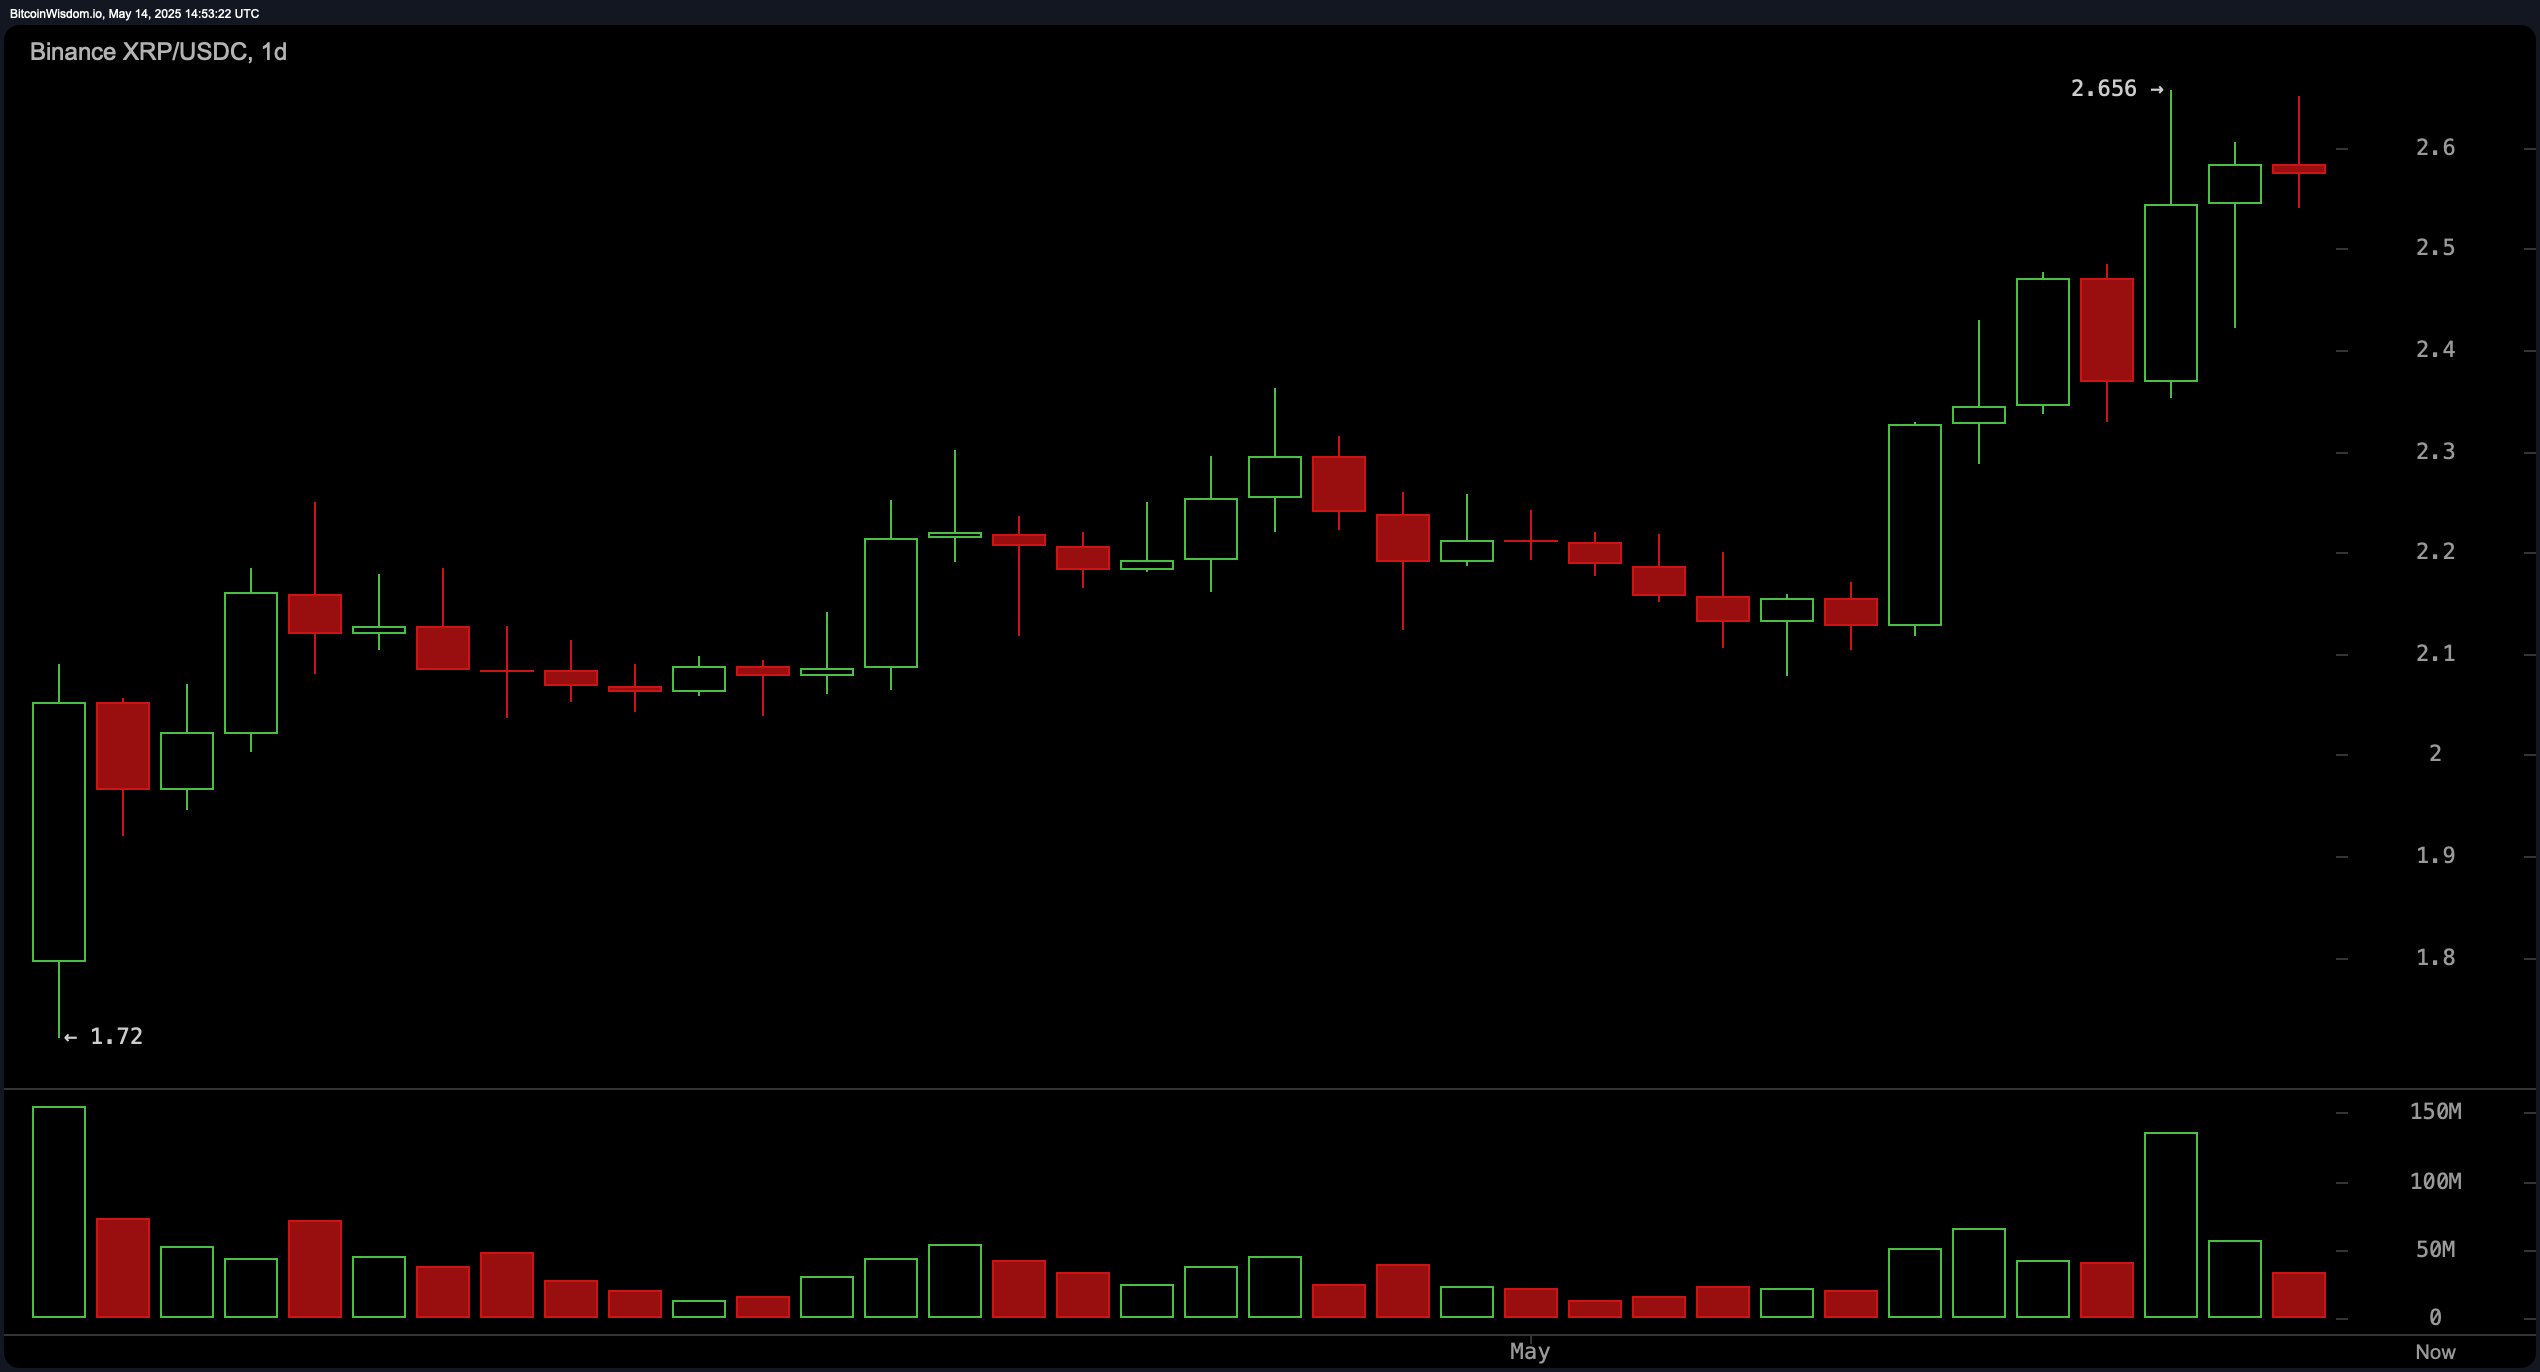
The daily chart analysis highlights a strong bullish breakout that recently propelled XRP past former resistance levels around $2.30, reaching a high of $2.656. A substantial surge in buying volume validated the upward move, although the current formation of small-bodied candles reflects indecision and potential consolidation near the recent peak. Key support levels now lie at $2.30 and $2.10, which previously acted as resistance. A strategic entry point for swing or position traders would be on dips toward the $2.30–$2.40 range, especially if volume confirms a bounce. A decline below $2.10 would compromise the broader bullish structure and suggest a deeper correction.

XRP/USDC 1D chart via Binance on May 14, 2025.
The oscillator indicators provide a mixed outlook. The relative strength index (RSI) at 67.92130 and Stochastic at 84.12581 both remain in neutral zones, indicating neither overbought nor oversold conditions. The commodity channel index (CCI) at 180.06346 signals a potential sell, suggesting prices may be extended above their mean. Meanwhile, the average directional index (ADX) at 21.30462 also shows neutrality, lacking a strong trend confirmation. Positive momentum is observed with the momentum reading at 0.41380 and the moving average convergence divergence (MACD) level at 0.09519, both suggesting ongoing buying interest.
All moving averages continue to support a bullish stance. Both the exponential moving averages (EMA) and simple moving averages (SMA) for the 10, 20, 30, 50, 100, and 200 periods indicate bullish signals. Specifically, the exponential moving average (10) stands at $2.41372, and the simple moving average (10) is at $2.36197, both sitting below the current price, reinforcing the short-term bullish outlook. Long-term indicators such as the exponential moving average (200) at $2.02880 and simple moving average (200) at $2.14926 reflect strong underlying support for XRP, aligning with the uptrend visible on higher timeframes. This unified bullish consensus across moving averages underscores a robust trend continuation scenario, barring significant macro or technical disruptions.
Bull Verdict:
XRP’s consistent support across all major exponential and simple moving averages, alongside bullish momentum signals from the moving average convergence divergence (MACD) and momentum indicators, underpins a strong technical foundation for further gains. If buying volume resurfaces on dips and resistance at $2.66 is decisively broken, XRP could accelerate toward $2.70 and beyond, validating a continuation of the uptrend.
Bear Verdict:
Despite the bullish trend on higher timeframes, warning signs on the 1-hour and 4-hour charts—such as bearish divergence, declining volume, and resistance rejection at $2.656—suggest a possible near-term pullback. A failure to hold support at $2.50 and especially a breach below $2.45 would likely trigger a deeper correction, potentially challenging the $2.30 level and undermining the current bullish structure.
免责声明:本文章仅代表作者个人观点,不代表本平台的立场和观点。本文章仅供信息分享,不构成对任何人的任何投资建议。用户与作者之间的任何争议,与本平台无关。如网页中刊载的文章或图片涉及侵权,请提供相关的权利证明和身份证明发送邮件到support@aicoin.com,本平台相关工作人员将会进行核查。


