This Week's Preview (5.19-5.25): Numerous Federal Reserve Officials Will Speak; Nearly $500 Million Net Outflow from BTC ETF in One Week
Table of Contents:
- This Week's Large Token Unlock Data;
- Overview of the Crypto Market, Quick Read on Weekly Popular Tokens' Price Changes/Fund Flows;
- Bitcoin Spot ETF Dynamics;
- BTC Liquidation Map Data Interpretation;
- Key Macroeconomic Events and Key Announcements and Interpretations in the Crypto Market This Week.
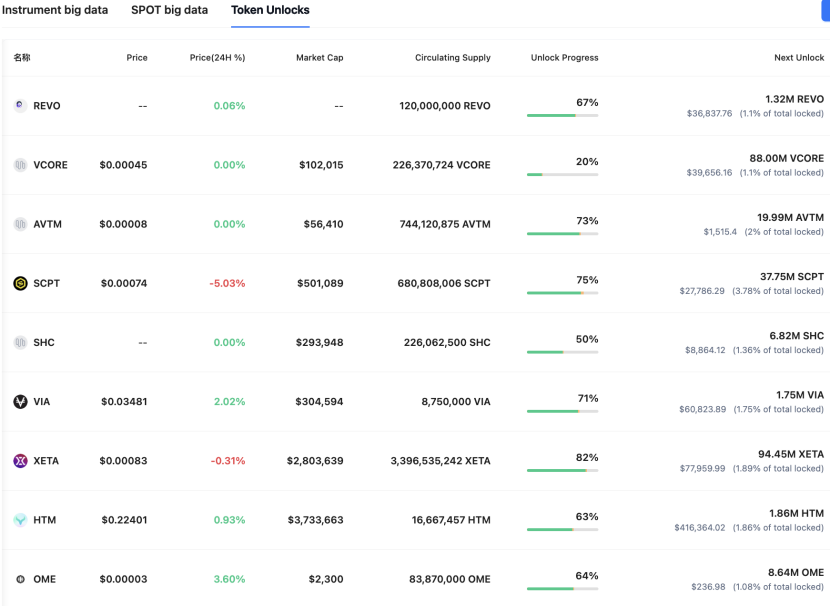
1. This Week's Large Token Unlock Data;
Coinank data shows that tokens such as PYTH, ZKJ, and PIXEL will experience significant unlocks this week, including:
Pyth Network (PYTH) will unlock approximately 2.13 billion tokens at 10 PM on May 19, accounting for 58.62% of the current circulating supply, valued at about $338 million;
Polyhedra Network (ZKJ) will unlock approximately 15.53 million tokens at 8 AM on May 19, accounting for 5.3% of the current circulating supply, valued at about $32.3 million;
Pixels (PIXEL) will unlock approximately 9.118 million tokens at 6 PM on May 19, accounting for 11.83% of the current circulating supply, valued at about $4.7 million;
SPACE ID (ID) will unlock approximately 12.65 million tokens at 8 AM on May 22, accounting for 2.94% of the current circulating supply, valued at about $2.7 million.
We believe that this week's token unlock events will have a structural impact on market supply and demand relationships and investor expectations. Specifically:
The scale of the PYTH unlock is significant, and caution is warranted regarding short-term selling pressure. Pyth Network's unlock of 2.13 billion tokens (accounting for 58.62% of the circulating supply) is valued at up to $338 million. Although its underlying oracle network has long-term value support due to institutional backing (such as Jane Street and Jump Trading), approximately 16.67% of the unlocked tokens are directed to private investors, who typically have strong cash-out motives. Historical cases show that projects with a sudden increase in circulating supply of over 50% often face price correction pressure.
The ZKJ unlock may trigger a market cap reassessment. The unlock volume of Polyhedra Network's ZKJ token accounts for 5.3% of the circulating supply, but based on current market cap, it represents 25.7%. Although some tokens are used for ecosystem incentives, its cross-chain interoperability technology, zkBridge, has not yet formed significant revenue support, and the market may maintain a cautious attitude towards the actual application progress post-unlock.
The impacts of PIXEL and ID unlocks are relatively limited. The unlock ratios for PIXEL and ID are 11.83% and 2.94%, respectively, which fall within the normal release range. As a GameFi project, PIXEL's tokens are primarily used for in-game incentives, and user stickiness may buffer selling pressure; approximately 70% of the unlocked ID tokens are directed to the foundation and ecosystem fund, and the restricted use reduces market supply shocks.
Token unlocks are essentially a stress test of liquidity management capabilities. Project teams need to balance the exit demands of early investors with ecosystem development goals; for example, PYTH plans to use 75% of the unlocked tokens for ecosystem growth, which, if executed effectively, could translate into long-term value. Investors should focus on the flow of tokens (private placement/team/ecosystem) and the project's fundamentals, avoiding the pitfall of solely relying on unlock ratios to assess risk. The recent Movement Labs incident exposed risks of off-market trading manipulation, further highlighting the importance of a transparent unlocking mechanism.
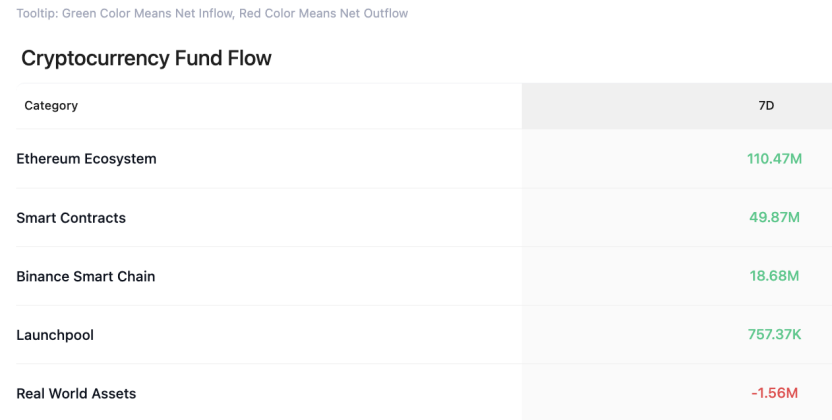
2. Overview of the Crypto Market, Quick Read on Weekly Popular Tokens' Price Changes/Fund Flows
CoinAnk data shows that over the past week, the crypto market, categorized by concept sectors, saw net inflows in sectors such as the Ethereum ecosystem, smart contracts, BSC, and Launchpool.
In the past 7 days, the top gainers among tokens (selected from the top 500 by market cap) include NEIRO, FXS, ATH, ULTIMA, and BGB, which should continue to be prioritized for trading opportunities this week.
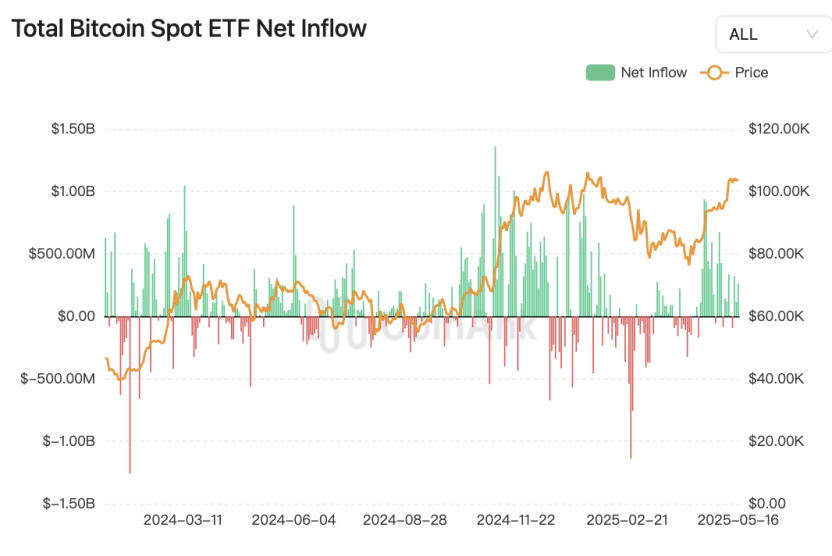
3. Bitcoin Spot ETF Fund Dynamics.
CoinAnk data shows that last week (May 12 - May 18), the U.S. Bitcoin spot ETF recorded a net outflow of $479 million, but in the first half of May, institutions increased their holdings by 26,700 BTC, exceeding the miners' output by 3.7 times, forming a "fund outflow - entity accumulation" divergence structure.
The ETH/BTC ETF holding ratio has significantly increased, with the Ethereum ecosystem showing reversal signals. The MVRV ratio of ETH/BTC has dropped to a five-year low, indicating significant implied valuation recovery space. Coupled with the Pectra upgrade introducing modular account abstraction, institutional holdings have risen to 19%, a new high since 2023. On-chain liquidity indicators show that ETH exchange inventory decreased by 12% weekly, while futures positions increased by 23%, forming a "spot contraction - derivatives accumulation" technical pattern.
We believe that the recent 38% rebound in the ETH/BTC exchange rate may signal a market style switch: first, the outflow of Bitcoin ETF funds suggests that some institutions are shifting to yield enhancement strategies, with ETH staking annualized returns reaching 4.2%, creating attractiveness; second, the Coinbase ETH futures premium rate has risen to 0.15%, indicating that professional investors are betting on a rebound; finally, the altcoin season index has risen to the 35 threshold, and historical data shows that this level often triggers excess return cycles of over 30% for small and mid-cap tokens. However, caution is warranted regarding increased selling pressure from Bitcoin miners—the MPI index has dropped to -1.2, and combined with the reduction in block rewards post-halving, this may suppress overall market liquidity and delay the timing of a full altcoin market breakout.
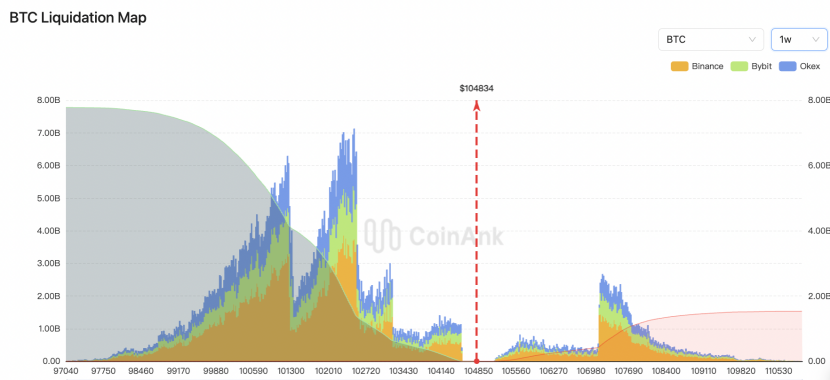
4. BTC Liquidation Map Data.
CoinAnk liquidation map data shows that if BTC breaks $110,000, the cumulative short liquidation intensity on major CEXs will reach $1.518 billion. Conversely, if Bitcoin falls below $100,700, the cumulative long liquidation intensity on major CEXs will reach $5.546 billion.
We believe that the current liquidation thresholds in the Bitcoin market reflect the game between bulls and bears at key price levels. According to the liquidation map data, if BTC breaks $110,000, it will trigger $1.518 billion in short liquidations, which may lead to a "short squeeze" effect, where short covering further drives up prices, creating a positive feedback loop. Conversely, if the price falls below $100,700, the liquidation pressure of up to $5.546 billion in long positions suggests a dense concentration of leveraged long positions below, and once the key support is breached, liquidity exhaustion may trigger a "long liquidation" sell-off, exacerbating short-term downside risks.
It is important to note that liquidation intensity is not an exact amount waiting to be liquidated but rather an assessment of market reaction intensity after price reaches a threshold, based on the density comparison of adjacent liquidation clusters. For example, historical data shows that the liquidation intensity at the same price level (e.g., $100,000) can vary significantly at different times (from $791 million to $1.012 billion), reflecting the dynamic changes in market leverage structure and position distribution. This elastic characteristic indicates that the liquidation map essentially reveals market vulnerability nodes—when prices break through thresholds, the self-reinforcing effect of liquidity waves may far exceed the amplitude of fundamental-driven volatility.
The current asymmetry in long and short liquidation intensity (the long liquidation intensity is 3.65 times that of shorts) may suggest that the market's defensive layout against short-term corrections is more concentrated, while also highlighting the fragility of funds chasing high prices. Researchers should be cautious of the amplifying effect of such technical liquidations on market sentiment, especially in the absence of significant fundamental catalysts, which may lead to extreme volatility detached from value anchoring.
5. Key Macroeconomic Events and Key Announcements and Interpretations in the Crypto Market This Week.
CoinAnk data shows that the key macroeconomic events and key announcements in the crypto market this week are as follows:
May 19: U.S. lawmakers will hold a final vote on the stablecoin GENIUS Act;
Solana will host the Accelerate 2025 crypto summit from May 19 to 23;
Sahara AI announces the launch of the SIWA public testnet;
May 20: The Mayor of New York City will advance cryptocurrency plans ahead of the crypto summit;
May 22: The TRUMP dinner will be held on May 22, and the next phase of the token plan will be announced that day;
Numerous Federal Reserve officials will also speak from Monday to Friday.
This week's core variables in the crypto market focus on policy regulation and political games, while also paying attention to the interaction between technical ecosystems and macro liquidity. First, the Senate's vote on the GENIUS Act on May 19 may become a watershed moment for the stablecoin market. The bill requires issuers to hold 100% reserves of highly liquid assets and mandates annual audits for projects with a market cap exceeding $50 billion. While this move may enhance market transparency and institutional participation, it may also stifle innovation space for small and medium-sized stablecoins. If the bill passes, the USDC, which has lower compliance costs, may benefit, while the USDT, whose reserve transparency is questionable, will face pressure.
Second, the Mayor of New York City's push for cryptocurrency plans resonates with the Trump dinner's policy narrative. New York City is attracting crypto companies through public-private partnerships, which may stimulate regional market activity; meanwhile, Trump’s announcement of the token plan at the dinner continues his "crypto strategic reserve" advocacy, potentially driving short-term speculation in meme tokens tied to personal IP (such as $TRUMP). However, caution is warranted regarding the risk of policy reversals due to political cycle fluctuations.
On the technical ecosystem front, the Solana summit and the launch of the Sahara AI testnet may boost market attention on high-performance public chains. If Solana announces ecosystem support plans during the summit, it may alleviate the recent decline in trading volume; the Sahara AI testnet marks a new stage in the integration of AI and blockchain, potentially attracting institutional capital.
In terms of macro liquidity, the intensive speeches from Federal Reserve officials may reinforce market expectations regarding the interest rate path. Current CME data shows that the probability of a rate cut in June is only 11.6%; if officials release hawkish signals, it may suppress risk appetite in the crypto market, leading to a migration of funds towards safe-haven assets like stablecoins. However, if the dollar index weakens due to easing rate cut expectations, it may trigger a risk-off correlation effect between Bitcoin and gold.
In summary, the compliance dividends brought by regulatory implementation and the narrative speculation driven by political benefits form the short-term dual lines of the market, but the Federal Reserve's monetary policy remains the underlying pricing anchor. Long-term observation is needed on the restructuring effects of the GENIUS Act on the stablecoin market and the substantive progress of AI and blockchain applications.
免责声明:本文章仅代表作者个人观点,不代表本平台的立场和观点。本文章仅供信息分享,不构成对任何人的任何投资建议。用户与作者之间的任何争议,与本平台无关。如网页中刊载的文章或图片涉及侵权,请提供相关的权利证明和身份证明发送邮件到support@aicoin.com,本平台相关工作人员将会进行核查。


