Entering mid-May 2025, Ethereum has caught up with Bitcoin's gains, but Bitcoin has undergone consolidation, with its volatility dropping to a low point. The market anticipates a critical breakthrough. Around 8 AM on the 19th, Bitcoin briefly broke through $107,000, and most traders expect Bitcoin to enter a new phase of 【PriceDiscovery】. There is a bullish sentiment towards the current market structure, with expectations that the price will explore new historical highs.
However, there are also cautious voices in the market, as Bitcoin has so far failed to effectively break through resistance, and a temporary pullback may occur in the short term. Compared to the stock market, Bitcoin has not significantly risen recently, especially after the US-China trade agreement, which may indicate that when funds flow out or uncertainty arises elsewhere, investors are more inclined to seek Bitcoin purchases.
After Bitcoin briefly broke through $107,000 on the morning of the 19th, it rapidly fell back due to emerging selling pressure. By around 2:30 PM on the 19th, it had touched a low of around $102,000, pulling back nearly $5,000. As of the time of writing, it has rebounded to a quote of $105,000, with a decline of about 0.47% in the last 24 hours.
Bitcoin Four-Hour Chart
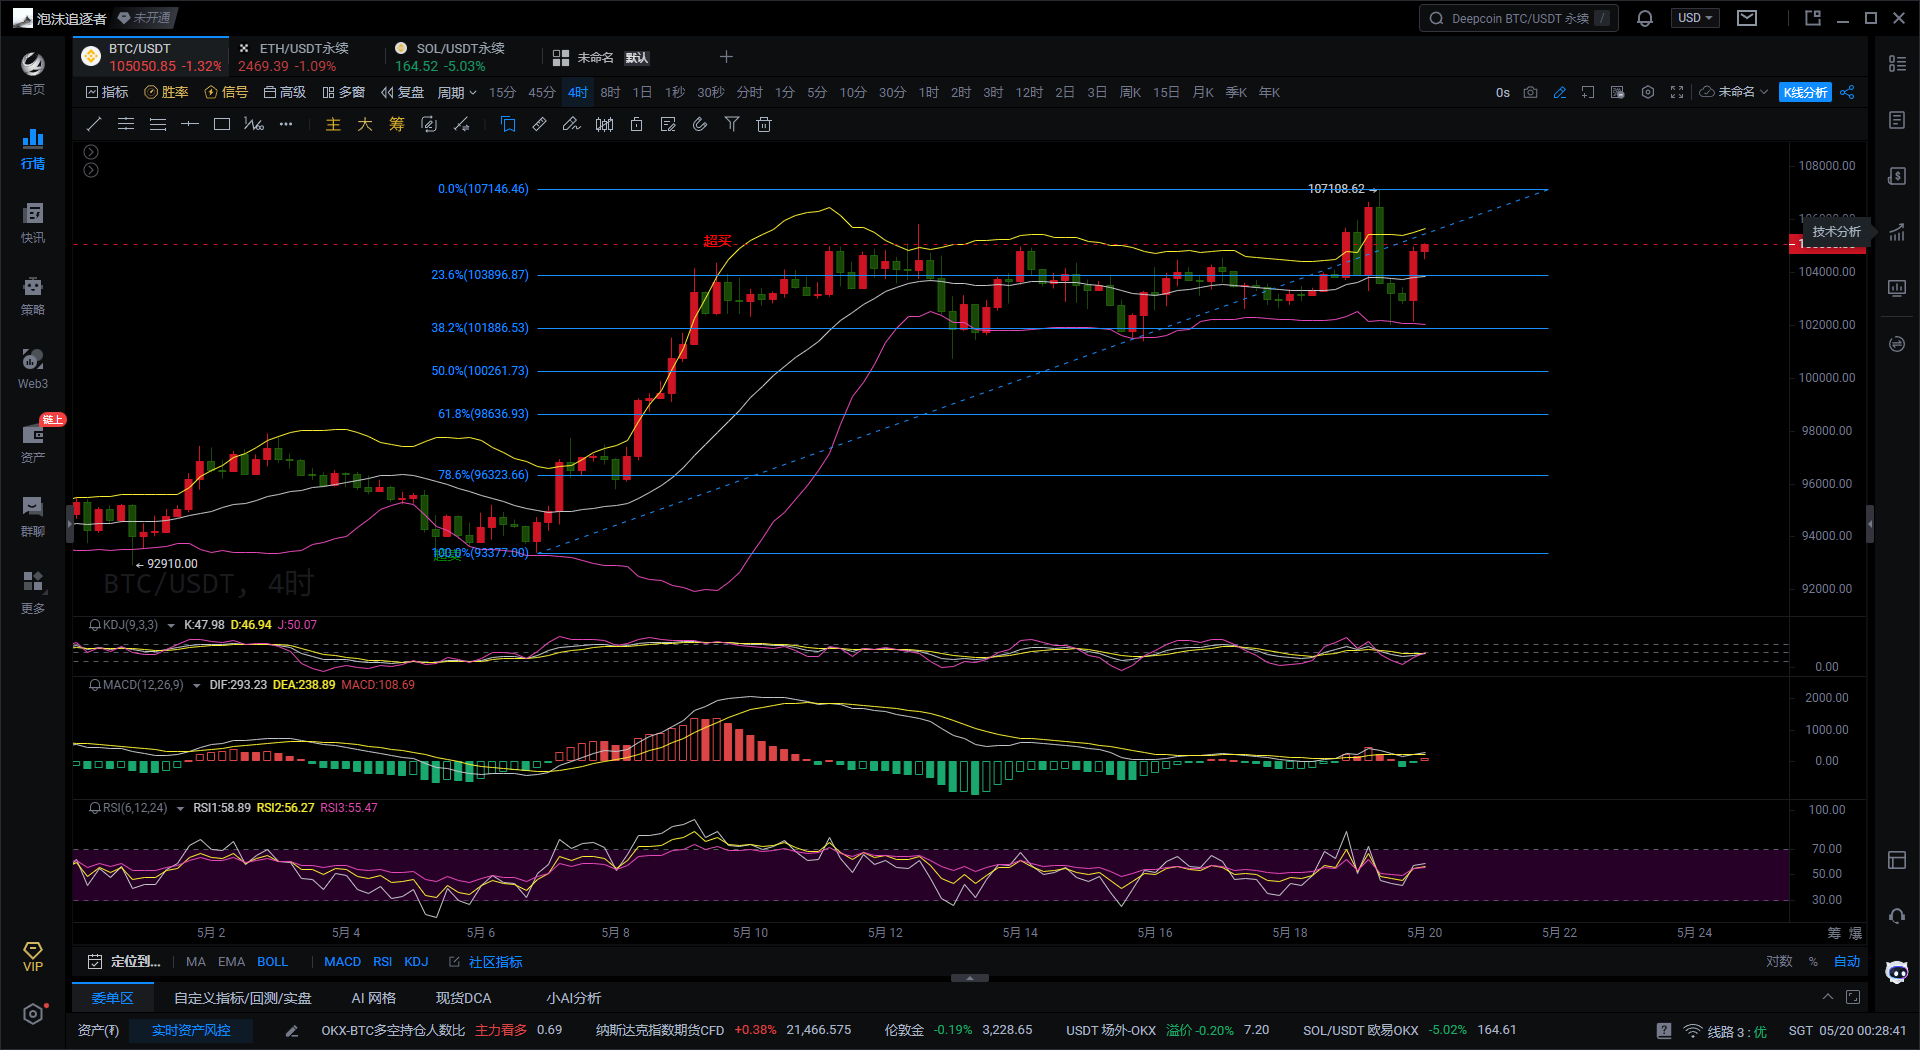
Bitcoin's price is currently fluctuating between the upper and middle bands, with the upper band starting to narrow and the lower band still moving downwards, indicating that the market's volatility is decreasing. If it can hold the middle band position, it may enter a new consolidation phase or attempt an upward breakout. The price is currently in a transitional period, with no clear directional choice yet.
From the KDJ indicator perspective, all three line values are in the middle position, having just formed a golden cross from a low position moving upwards, indicating that it has neither entered the overbought nor oversold zones. In the short term, there may be a rebound opportunity, but it needs to be confirmed with accompanying trading volume. Regarding the MACD indicator, both the DIF and DEA lines are below the zero axis. Although the green histogram has shortened, the bearish strength has not completely dissipated. A golden cross has not yet formed, and the overall situation remains in a weak recovery phase.
The price is currently oscillating near the Fibonacci 23.6% level (103896). If it cannot stabilize at this position, it may continue to test the 38.2% support level near 101886. Overall, market sentiment is cautious, and clearer signals are needed.
In summary, the following suggestions are provided for reference:
Buy Bitcoin near 103900 on a pullback, targeting 105000-106000, with a stop loss at 103300.
Instead of giving you a 100% accurate suggestion, I prefer to provide you with the right mindset and trend. After all, teaching someone to fish is better than giving them a fish; a suggestion may earn you a moment, but learning the mindset can earn you a lifetime! The focus is on the mindset, grasping the trend, and planning the market layout and positions. What I can do is use my practical experience to help everyone, guiding your investment decisions and management in the right direction.
Writing time: (2025-05-20, 00:30)

(Written by - Daxian Talks Coins) Disclaimer: Online publication has delays, and the above suggestions are for reference only. The author is dedicated to research and analysis in investment fields such as Bitcoin, Ethereum, altcoins, forex, and stocks, having been involved in the financial market for many years with rich practical operation experience. Investment carries risks, and caution is needed when entering the market. For more real-time market analysis, please follow the official account Daxian Talks Coins for discussion and exchange.
免责声明:本文章仅代表作者个人观点,不代表本平台的立场和观点。本文章仅供信息分享,不构成对任何人的任何投资建议。用户与作者之间的任何争议,与本平台无关。如网页中刊载的文章或图片涉及侵权,请提供相关的权利证明和身份证明发送邮件到support@aicoin.com,本平台相关工作人员将会进行核查。


