Preface
This quantitative biweekly report (from April 25 to May 12) provides a comprehensive analysis of the market trends of Bitcoin and Ethereum, utilizing indicators such as long-short ratios, contract open interest, and funding rates. The quantitative section discusses the application of the "Dense Moving Average Breakthrough Strategy" in the ETH/USDT market, covering its logical framework and signal determination mechanism. Through systematic parameter optimization and backtesting, the strategy demonstrates robust performance in trend identification and risk control, with clear execution discipline, overall outperforming a simple hold strategy for ETH, providing a practical framework for quantitative trading.
Summary
• In the past two weeks, BTC and ETH have risen in sync, with BTC increasing by approximately 34% and ETH by over 60%.
• The long-short ratio of ETH has fluctuated significantly, indicating that ETH's rise is accompanied by strong short-term trading and market speculation, with shorts not significantly retreating.
• The increase in BTC contract open interest has been relatively slow, while ETH showed a stronger rise in early May.
• The overall short positions in the contract market experienced concentrated liquidations in early May, while longs faced reverse liquidations on May 12, reflecting intensified market divergence under high leverage.
• The quantitative analysis employs the "Dense Moving Average Breakthrough Strategy," achieving a return rate of up to 127% under optimal parameter selection.
Market Overview
1. Analysis of Price Volatility of Bitcoin and Ethereum
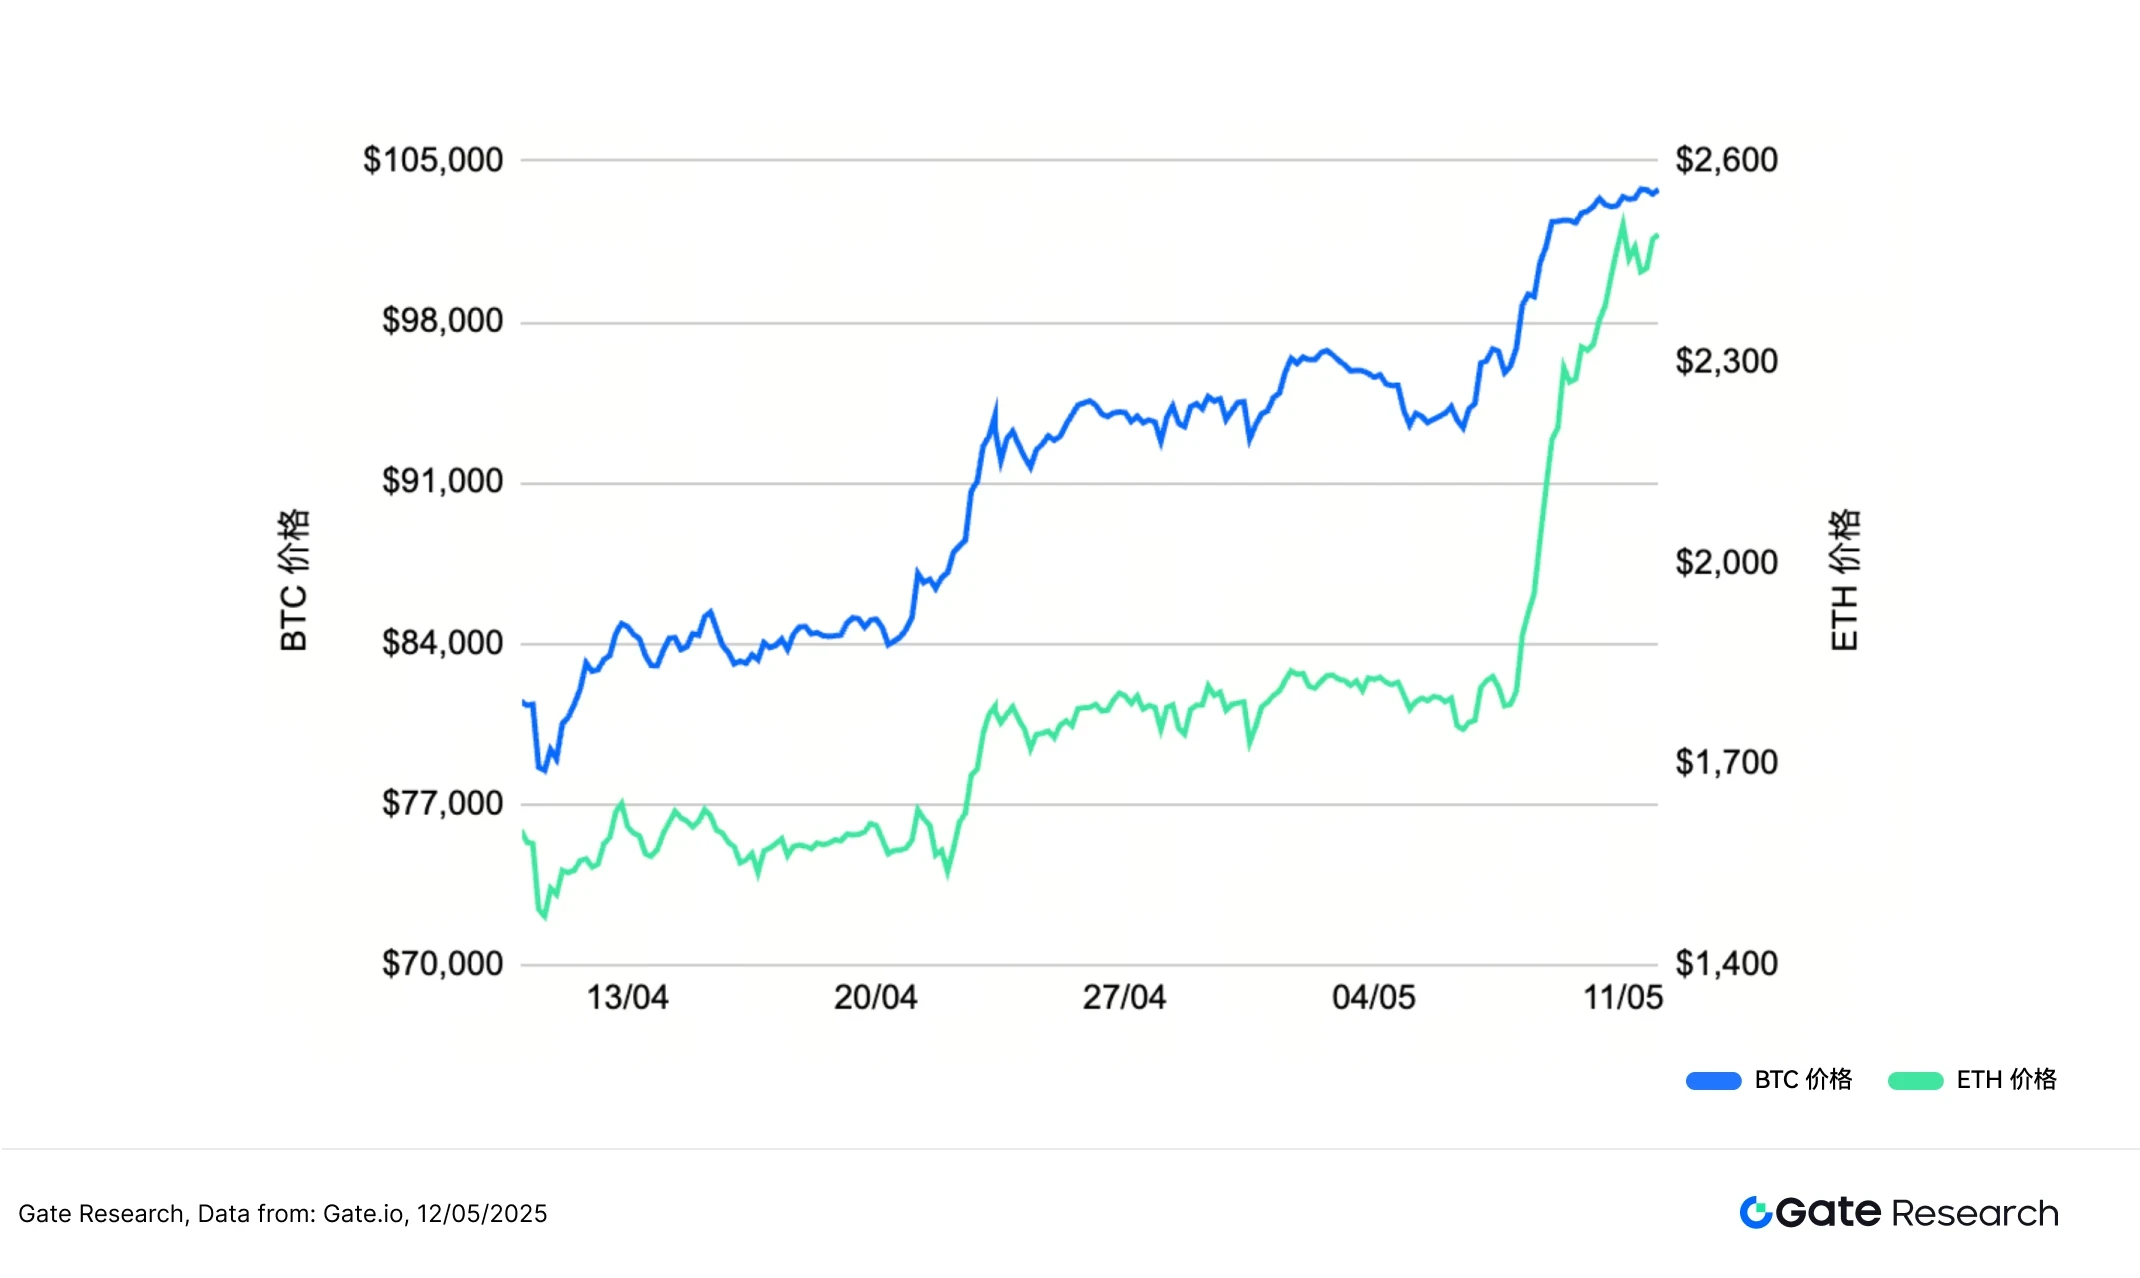
Since mid-April, BTC and ETH have shown a steady upward trend, maintaining a relatively consistent upward pace until early May. During this period, BTC rose from about 78,000 USDT to nearly 105,000 USDT, while ETH surged from around 1,600 USDT to about 2,600 USDT. It is evident that ETH's increase is significantly higher than that of BTC, demonstrating stronger price elasticity. Especially in early May, both experienced a jump, possibly due to easing tariff policies, allowing BTC to also undergo a corrective rally. BTC's price is higher with smaller fluctuations, showing a relatively stable trend; ETH, on the other hand, has a larger increase and reacts more quickly. Initially, the market lacked bullish expectations for ETH, resulting in relatively lagging performance, but entering May, with the upcoming Pectra upgrade and easing tariff policies, ETH saw a significant rebound. This round of volatility reflects the market's renewed focus on ETH's allocation value in the short term.【1】【2】
Figure 1: BTC price rises to nearly 105,000 USDT, while ETH surges to around 2,600 USDT, with more pronounced increases and reaction speed.
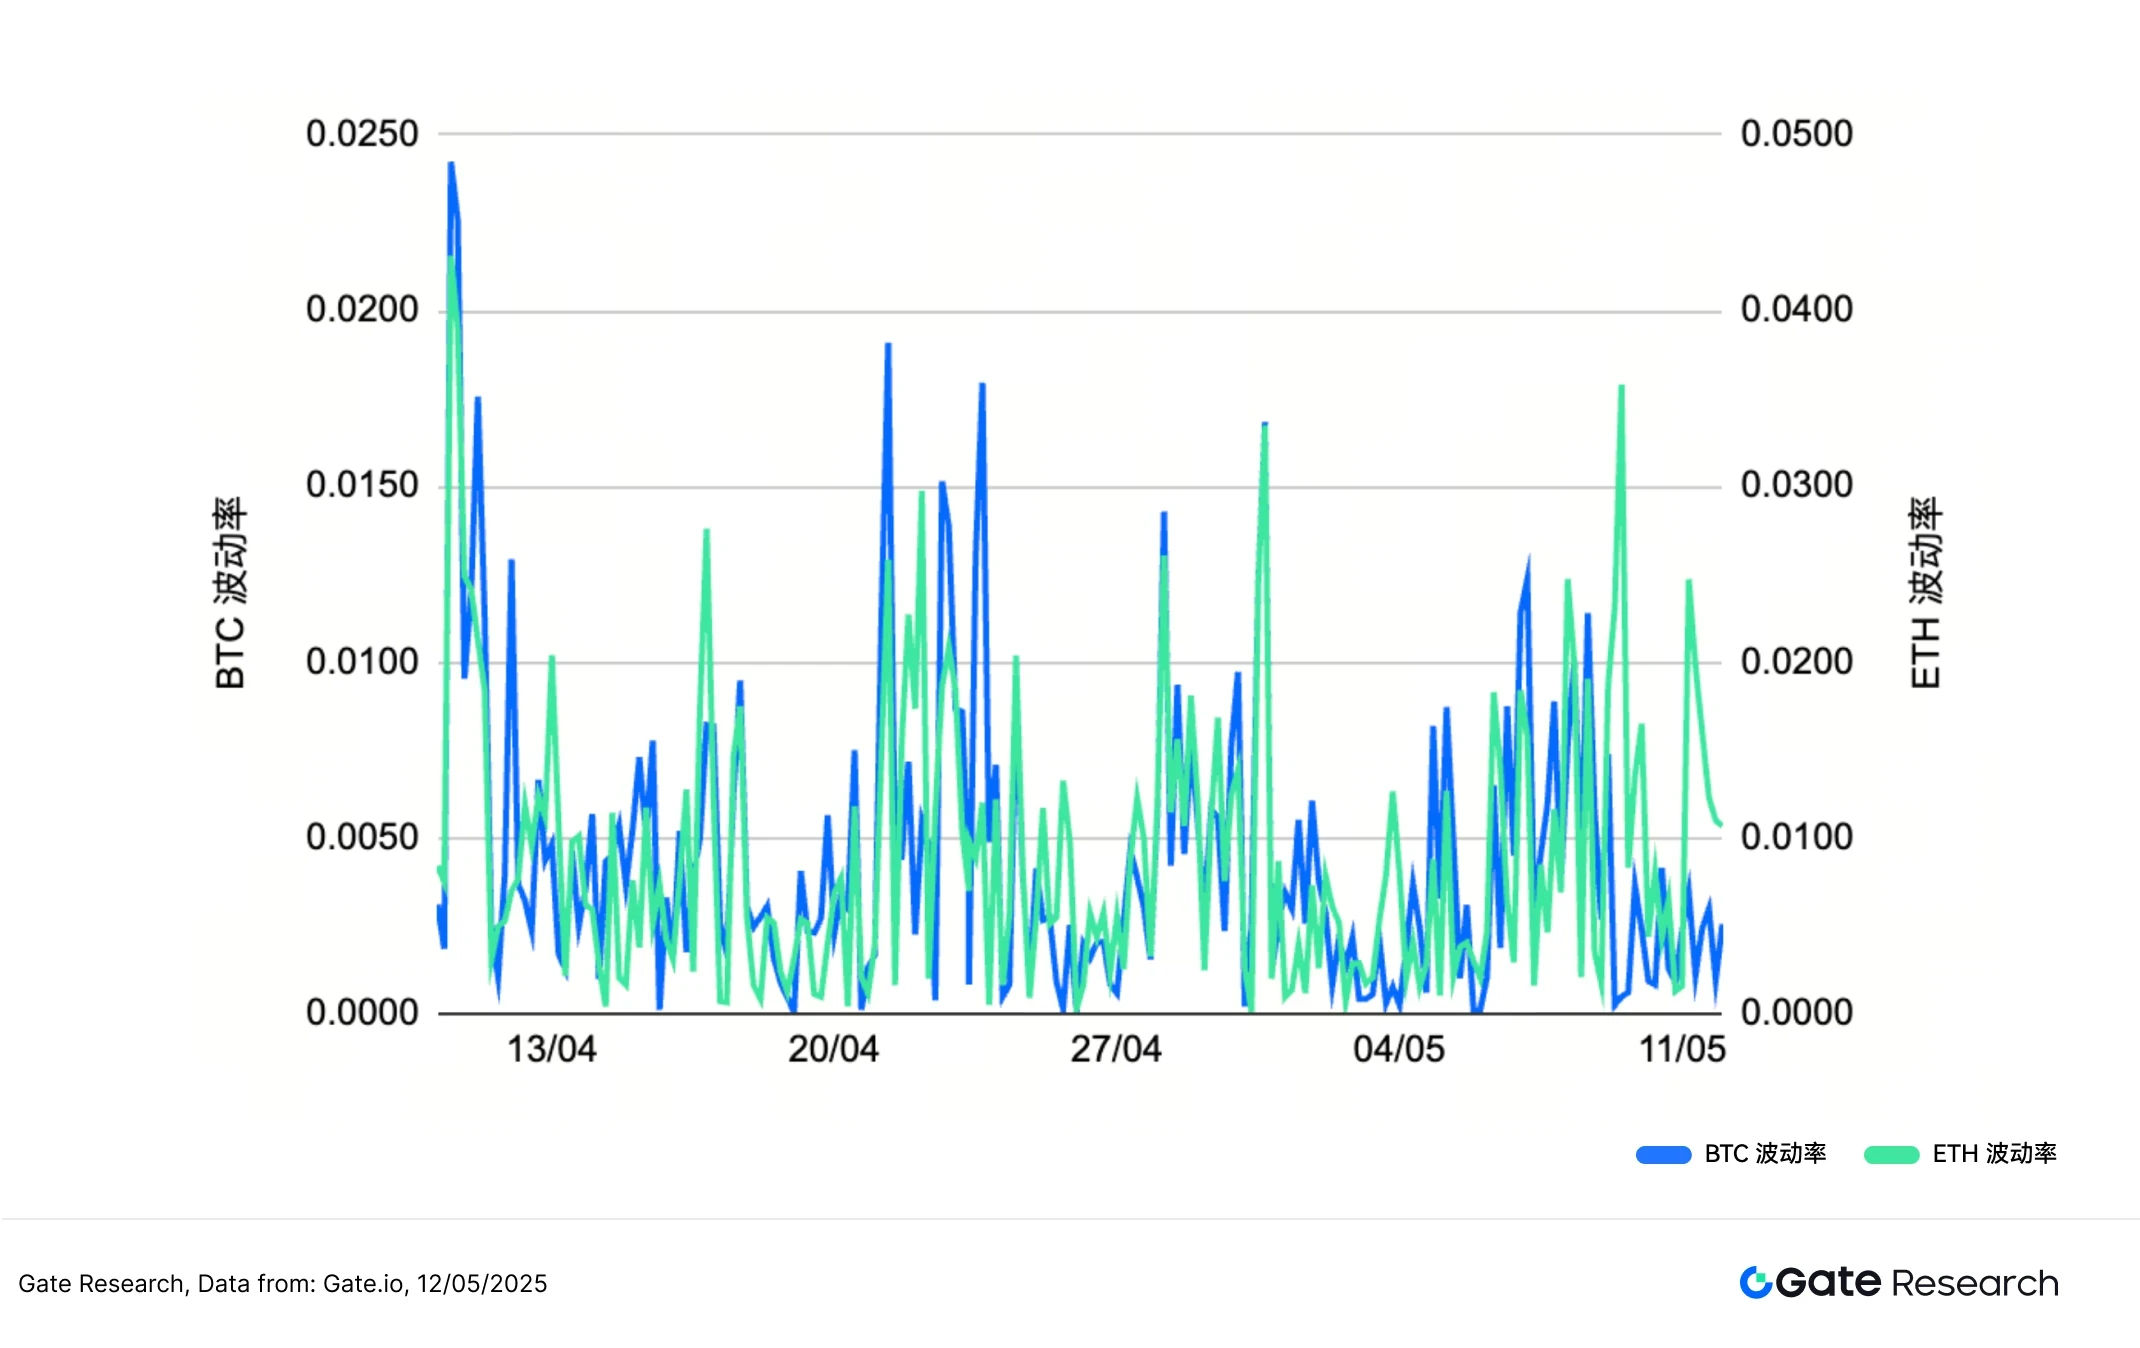
In terms of volatility, both BTC and ETH have shown significant changes in overall volatility from early April to mid-May. In mid-April, BTC's volatility frequently peaked, indicating active market sentiment and sharp price adjustments; subsequently, at the end of April and early May, overall volatility began to converge, reflecting a brief stabilization period in the market. However, before and after the price jump, ETH's volatility experienced several sharp increases, even surpassing BTC at one point, indicating stronger short-term fluctuations during its rise. Overall, BTC's volatility is relatively more even, while ETH's volatility is concentrated at several key points, especially around price breakthroughs, suggesting it is more susceptible to capital-driven influences.
Figure 2: BTC's volatility is relatively more even, while ETH's volatility shows multiple sharp increases.
Overall, ETH has demonstrated greater price increases and more concentrated volatility changes during this market phase, indicating strong price responsiveness at key moments; while BTC shows a relatively stable upward trend and a more dispersed volatility distribution, reflecting its relative stability amid market fluctuations. Although both jumped simultaneously during the price increase, their volatility characteristics and rhythms still exhibit significant differences, reflecting different market traits and dynamic structures. In the short term, it is advisable to continue monitoring BTC's capital flow and volatility changes as important indicators of market risk appetite.
2. Analysis of Long-Short Trading Size Ratio (LSR) of Bitcoin and Ethereum
The Long-Short Trading Size Ratio (LSR) is a key indicator measuring the trading volume of long and short positions in the market, typically used to assess market sentiment and trend strength. When LSR is greater than 1, it indicates that the volume of active buying (long positions) exceeds that of active selling (short positions), suggesting a market inclination towards bullish sentiment.
According to Coinglass data, in the past two weeks, both BTC and ETH prices have shown a clear upward trend, but their LSRs have exhibited varying degrees of divergence. BTC's LSR initially rose slightly at the beginning of the uptrend but overall remained around 1, even dipping below 1 around May 10, indicating that even as prices continued to rise, the volume of short trades also increased, reflecting that some investors chose to establish short positions or hedge at high levels, and the market did not form a clear one-sided bullish structure, leading to a certain level of skepticism about the rise.
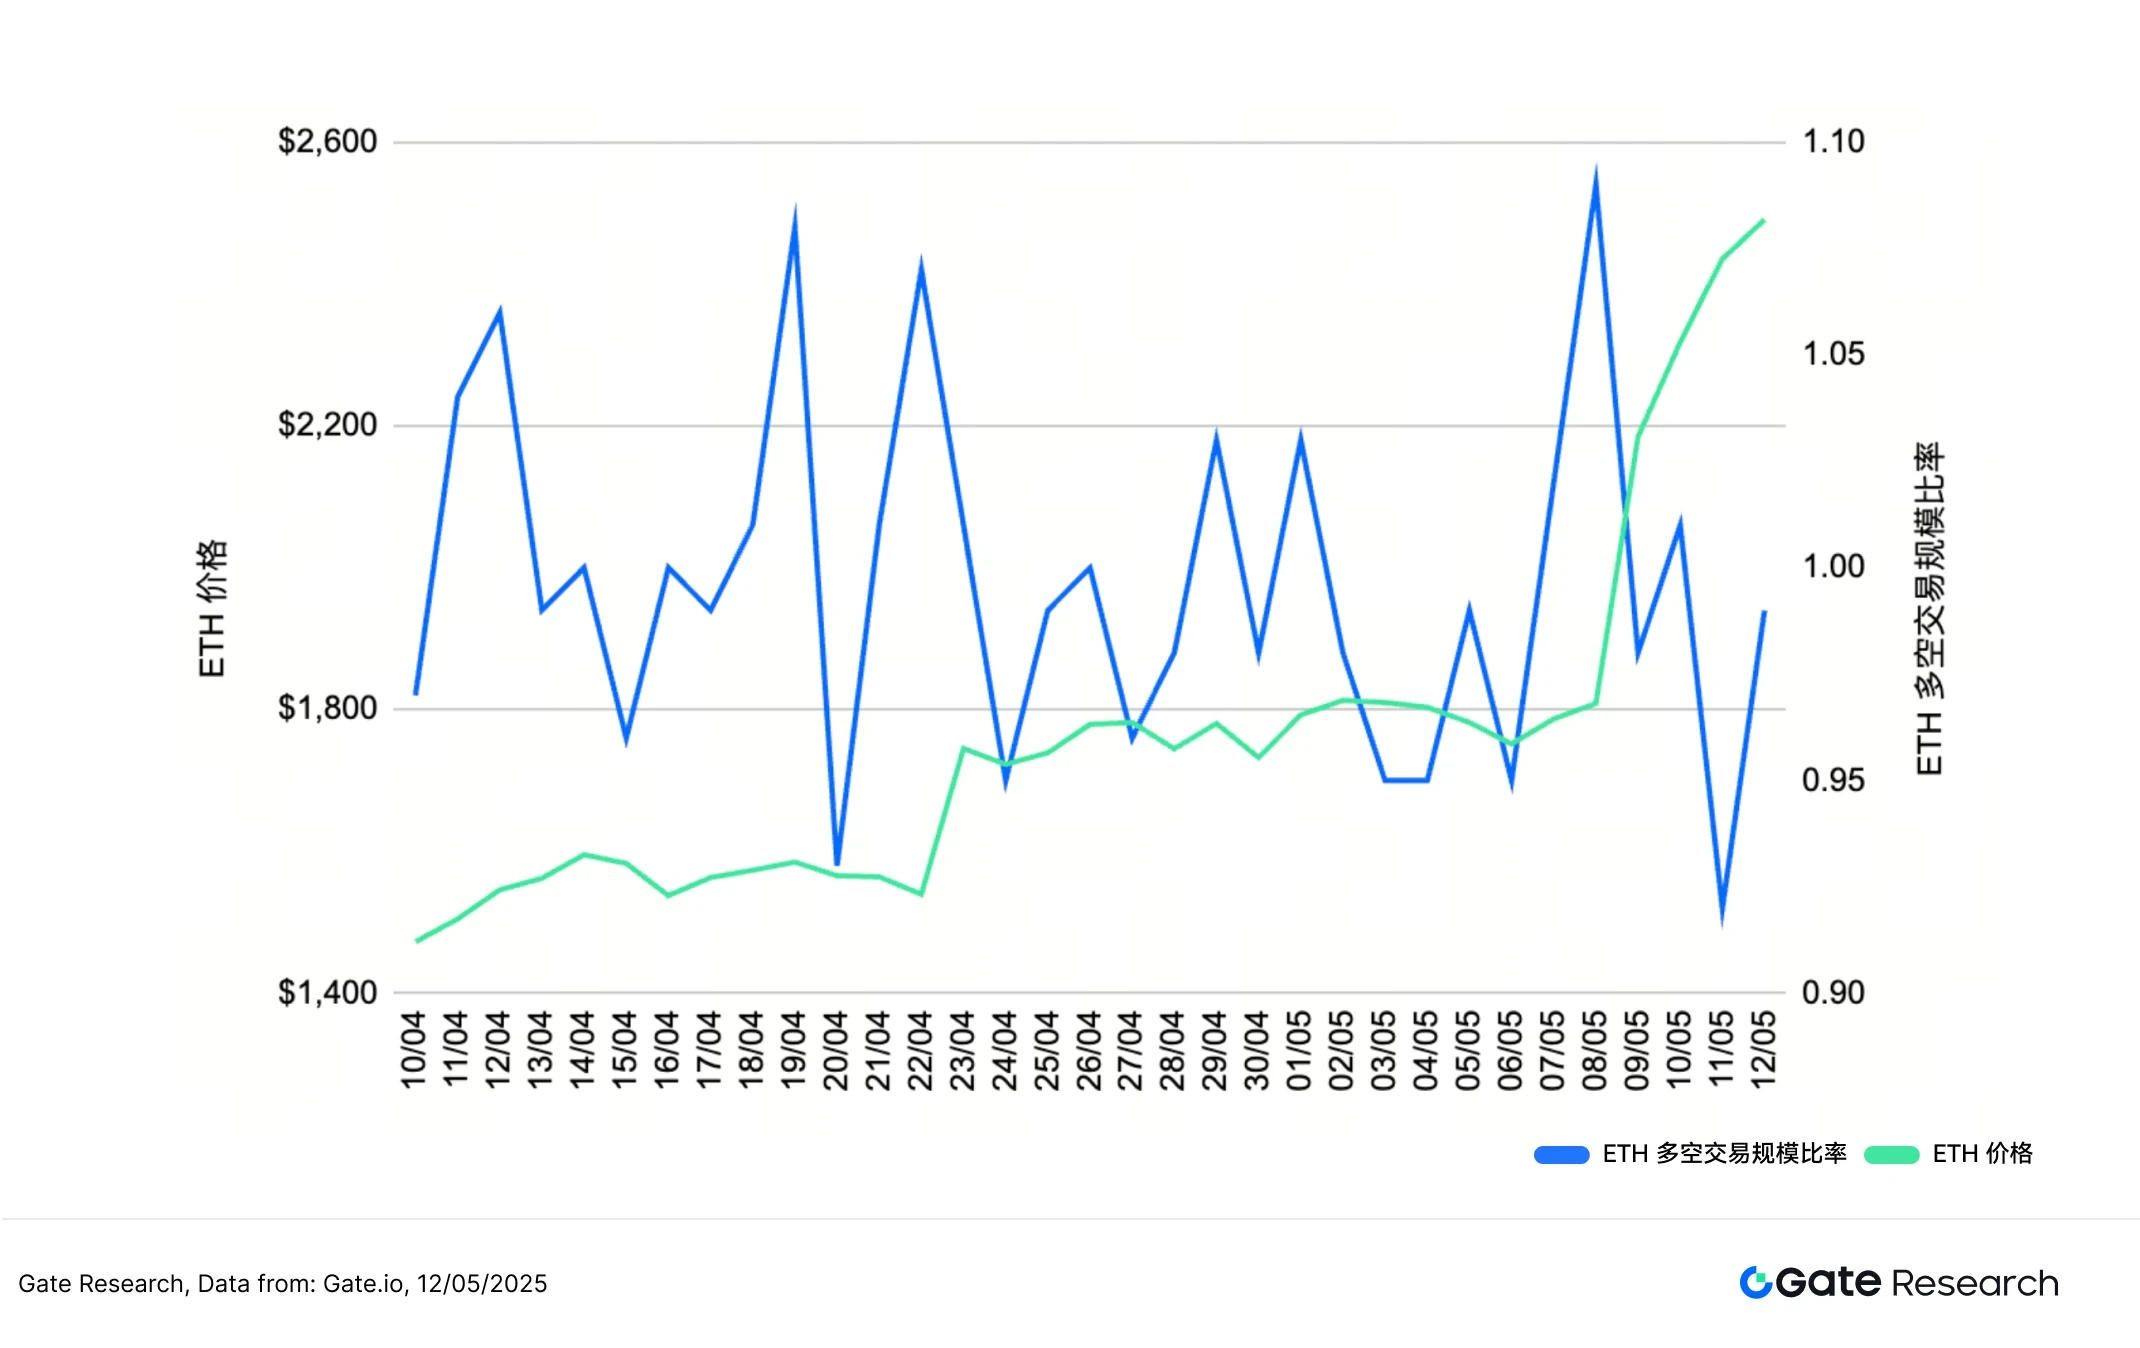
In contrast, ETH's long-short ratio has fluctuated more dramatically. During the period when the price broke through 2,000 USDT and quickly rose to 2,600 USDT, its LSR did not steadily climb but instead experienced multiple violent oscillations, with a noticeable drop around May 10. This situation indicates that ETH's rise is accompanied by strong short-term trading and market speculation, with shorts not significantly retreating, leading to a divided market sentiment.
Despite the synchronized price surge of BTC and ETH in the past two weeks, their long-short ratios did not show sustained increases, instead reflecting a general wait-and-see and hedging sentiment in the market at high levels, with investor sentiment being relatively cautious, and the structural support behind the price increase still needing further validation.【3】
Figure 3: BTC's long-short ratio shows a downward trend, indicating weakened bullish momentum at high levels.
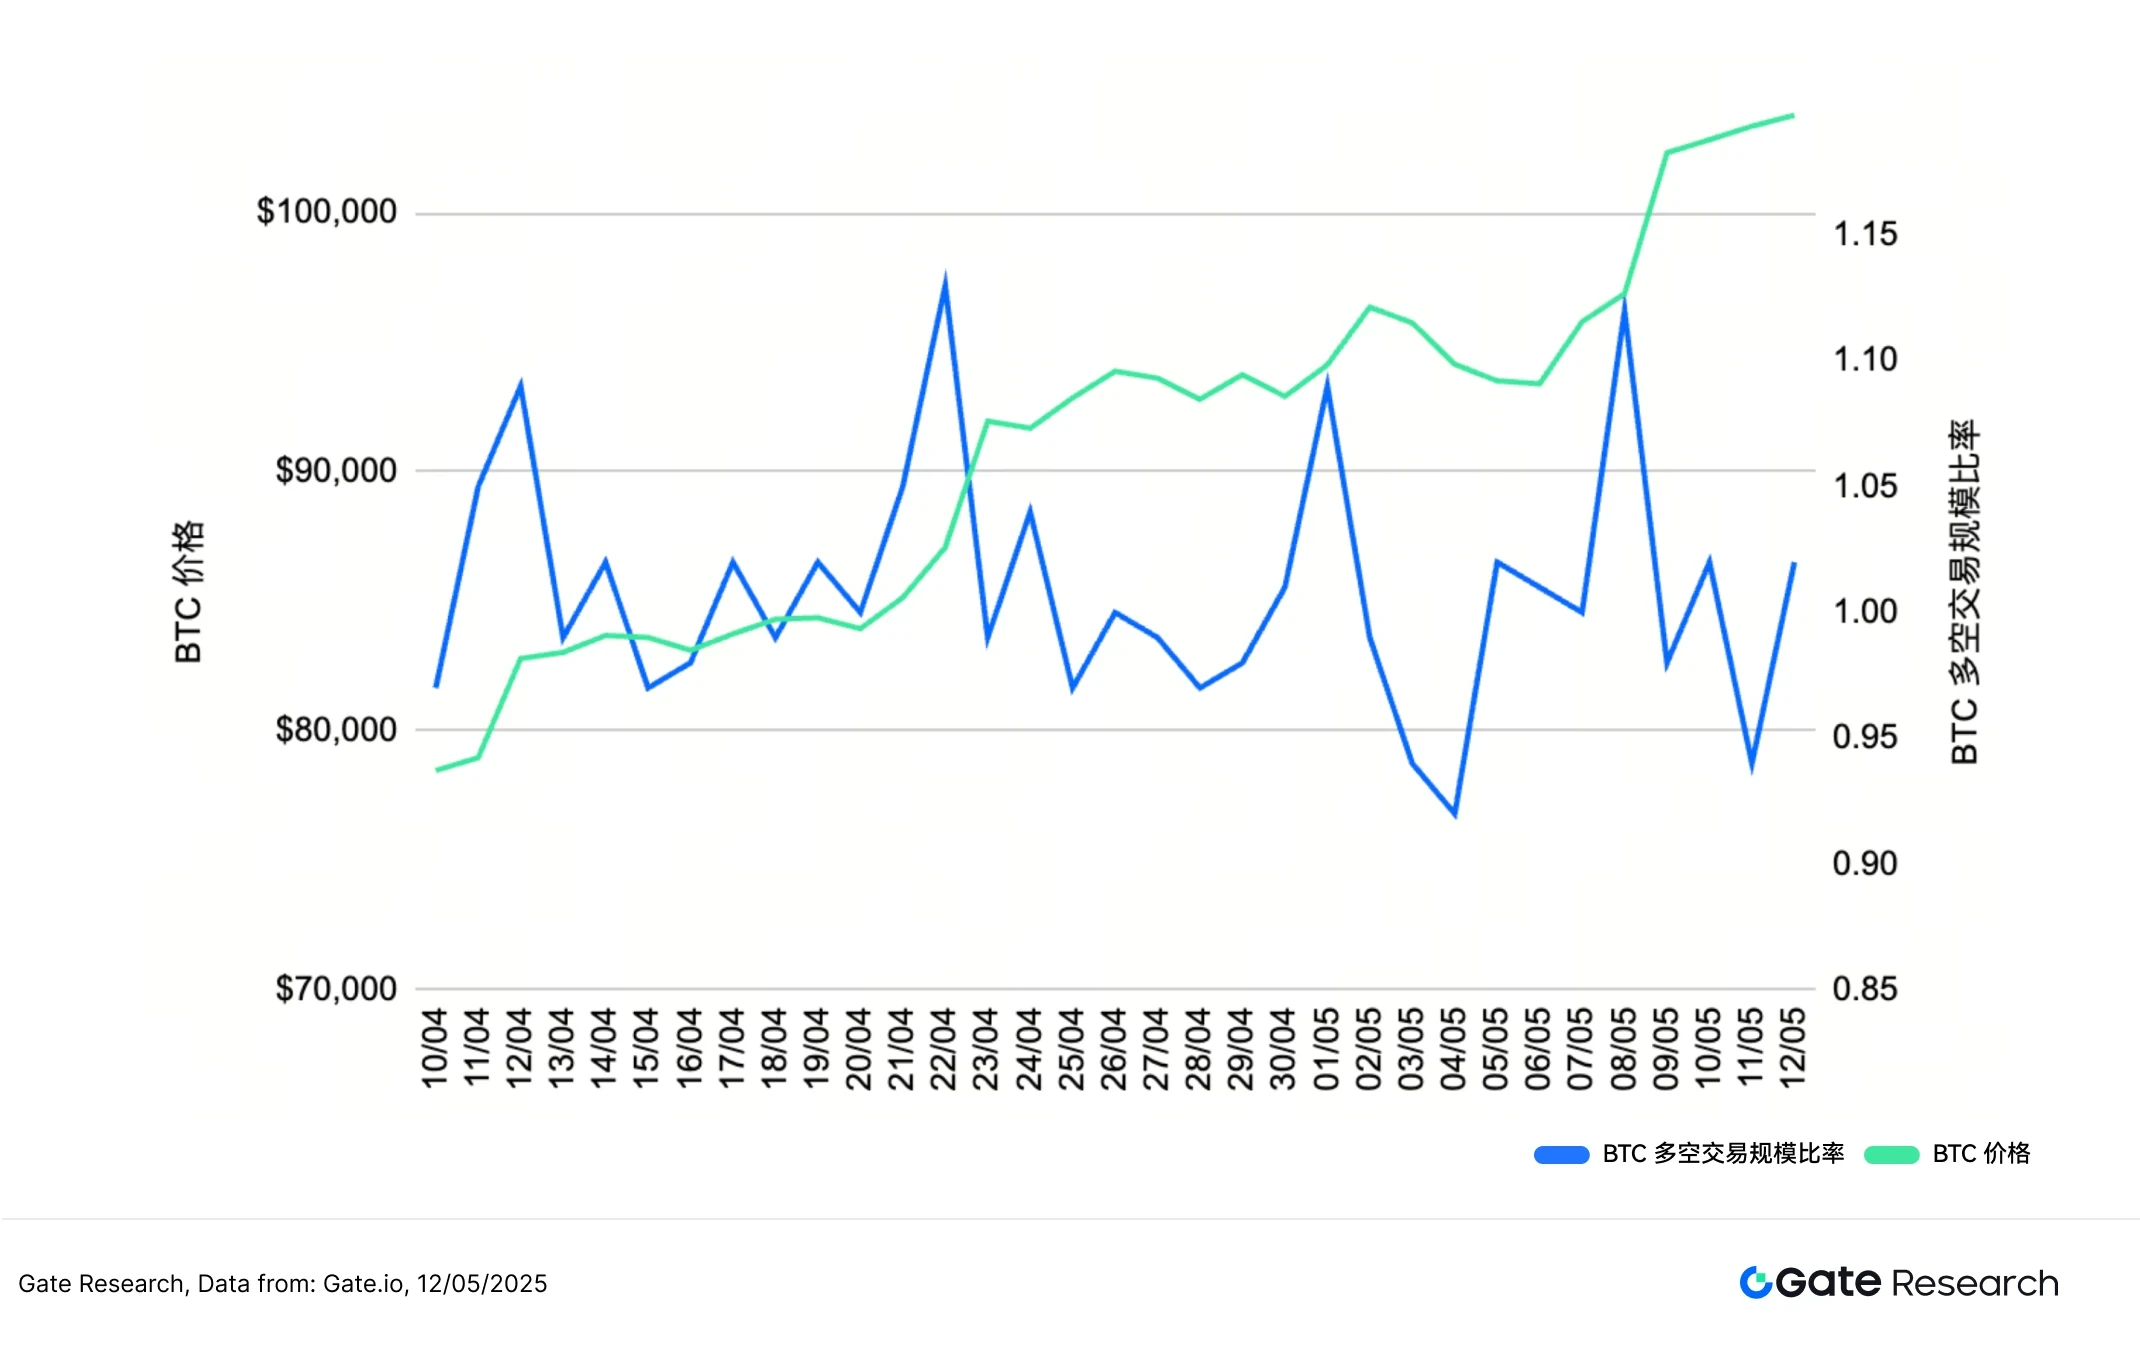
Figure 4: ETH's long-short ratio fluctuates violently, with clear market sentiment divergence.
3. Analysis of Contract Open Interest
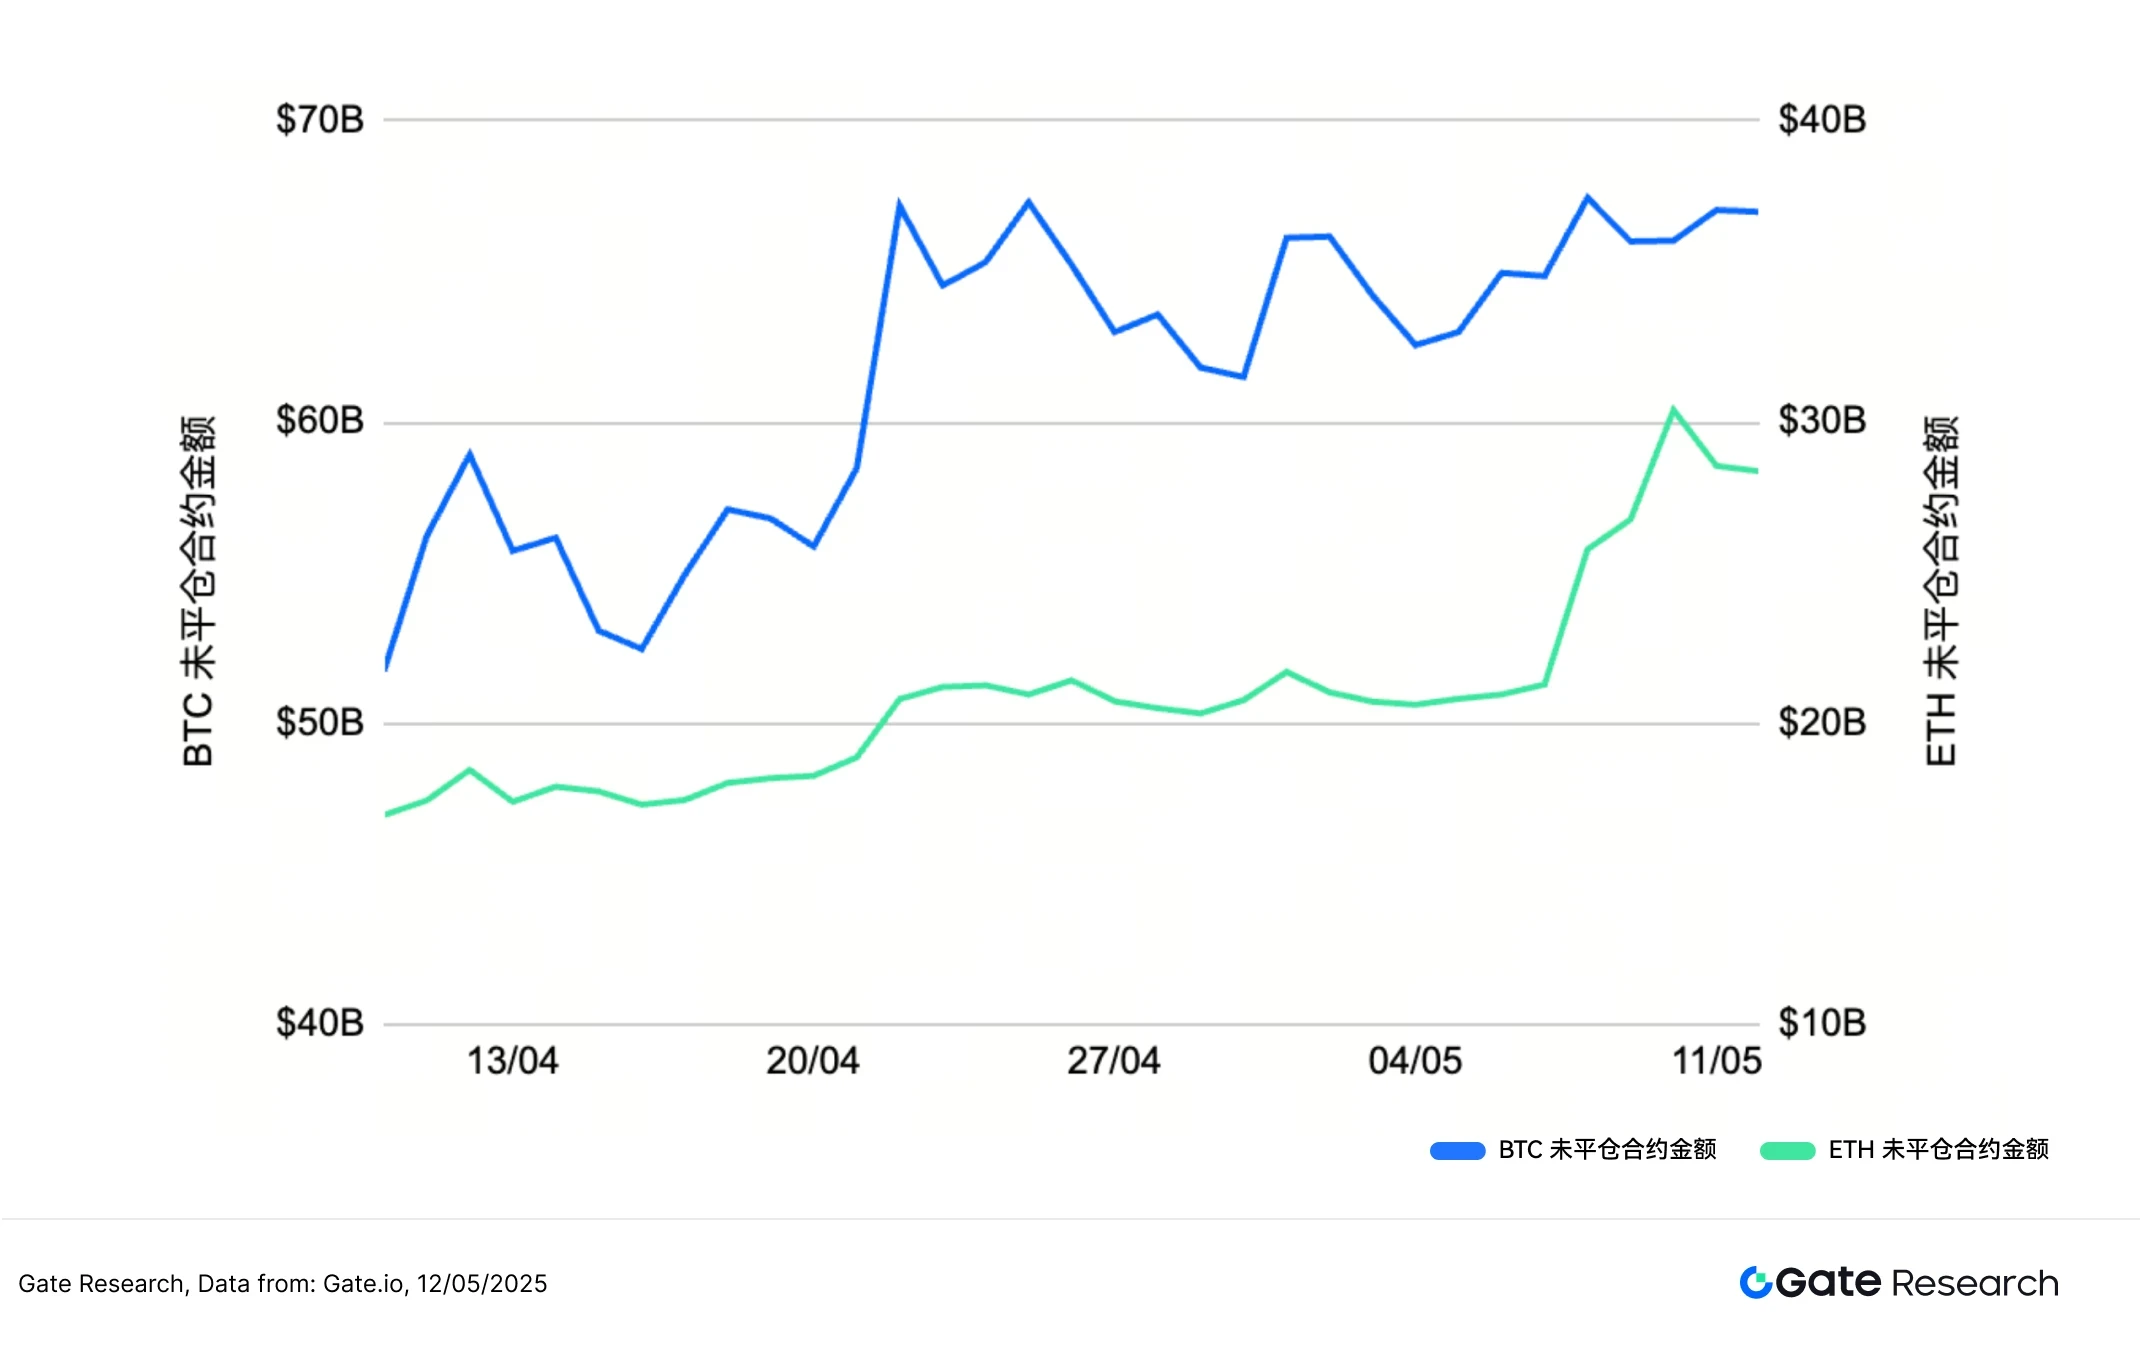
According to Coinglass data, the overall contract open interest for BTC and ETH shows an upward trend, reflecting the continued increase in market trading activity. BTC's open interest has gradually risen from about 60 billion US dollars, maintaining high levels despite some fluctuations, and stabilizing after early May. ETH's open interest has increased from about 18 billion US dollars to nearly 24 billion US dollars, showing a similar trend to BTC but relatively stable, especially with a noticeable jump in early May, indicating active capital inflow during that phase.
Overall, the synchronized growth of both contract open interest and price increases mutually corroborates the rising market participation and leverage usage. However, after the end of April, the capital inflow for BTC has stabilized, while ETH has shown a stronger rise in early May, suggesting that ETH attracted more interest in contract trading in the short term.【4】
Figure 5: BTC's contract open interest rises relatively slowly, while ETH shows a stronger increase in early May.
4. Funding Rates
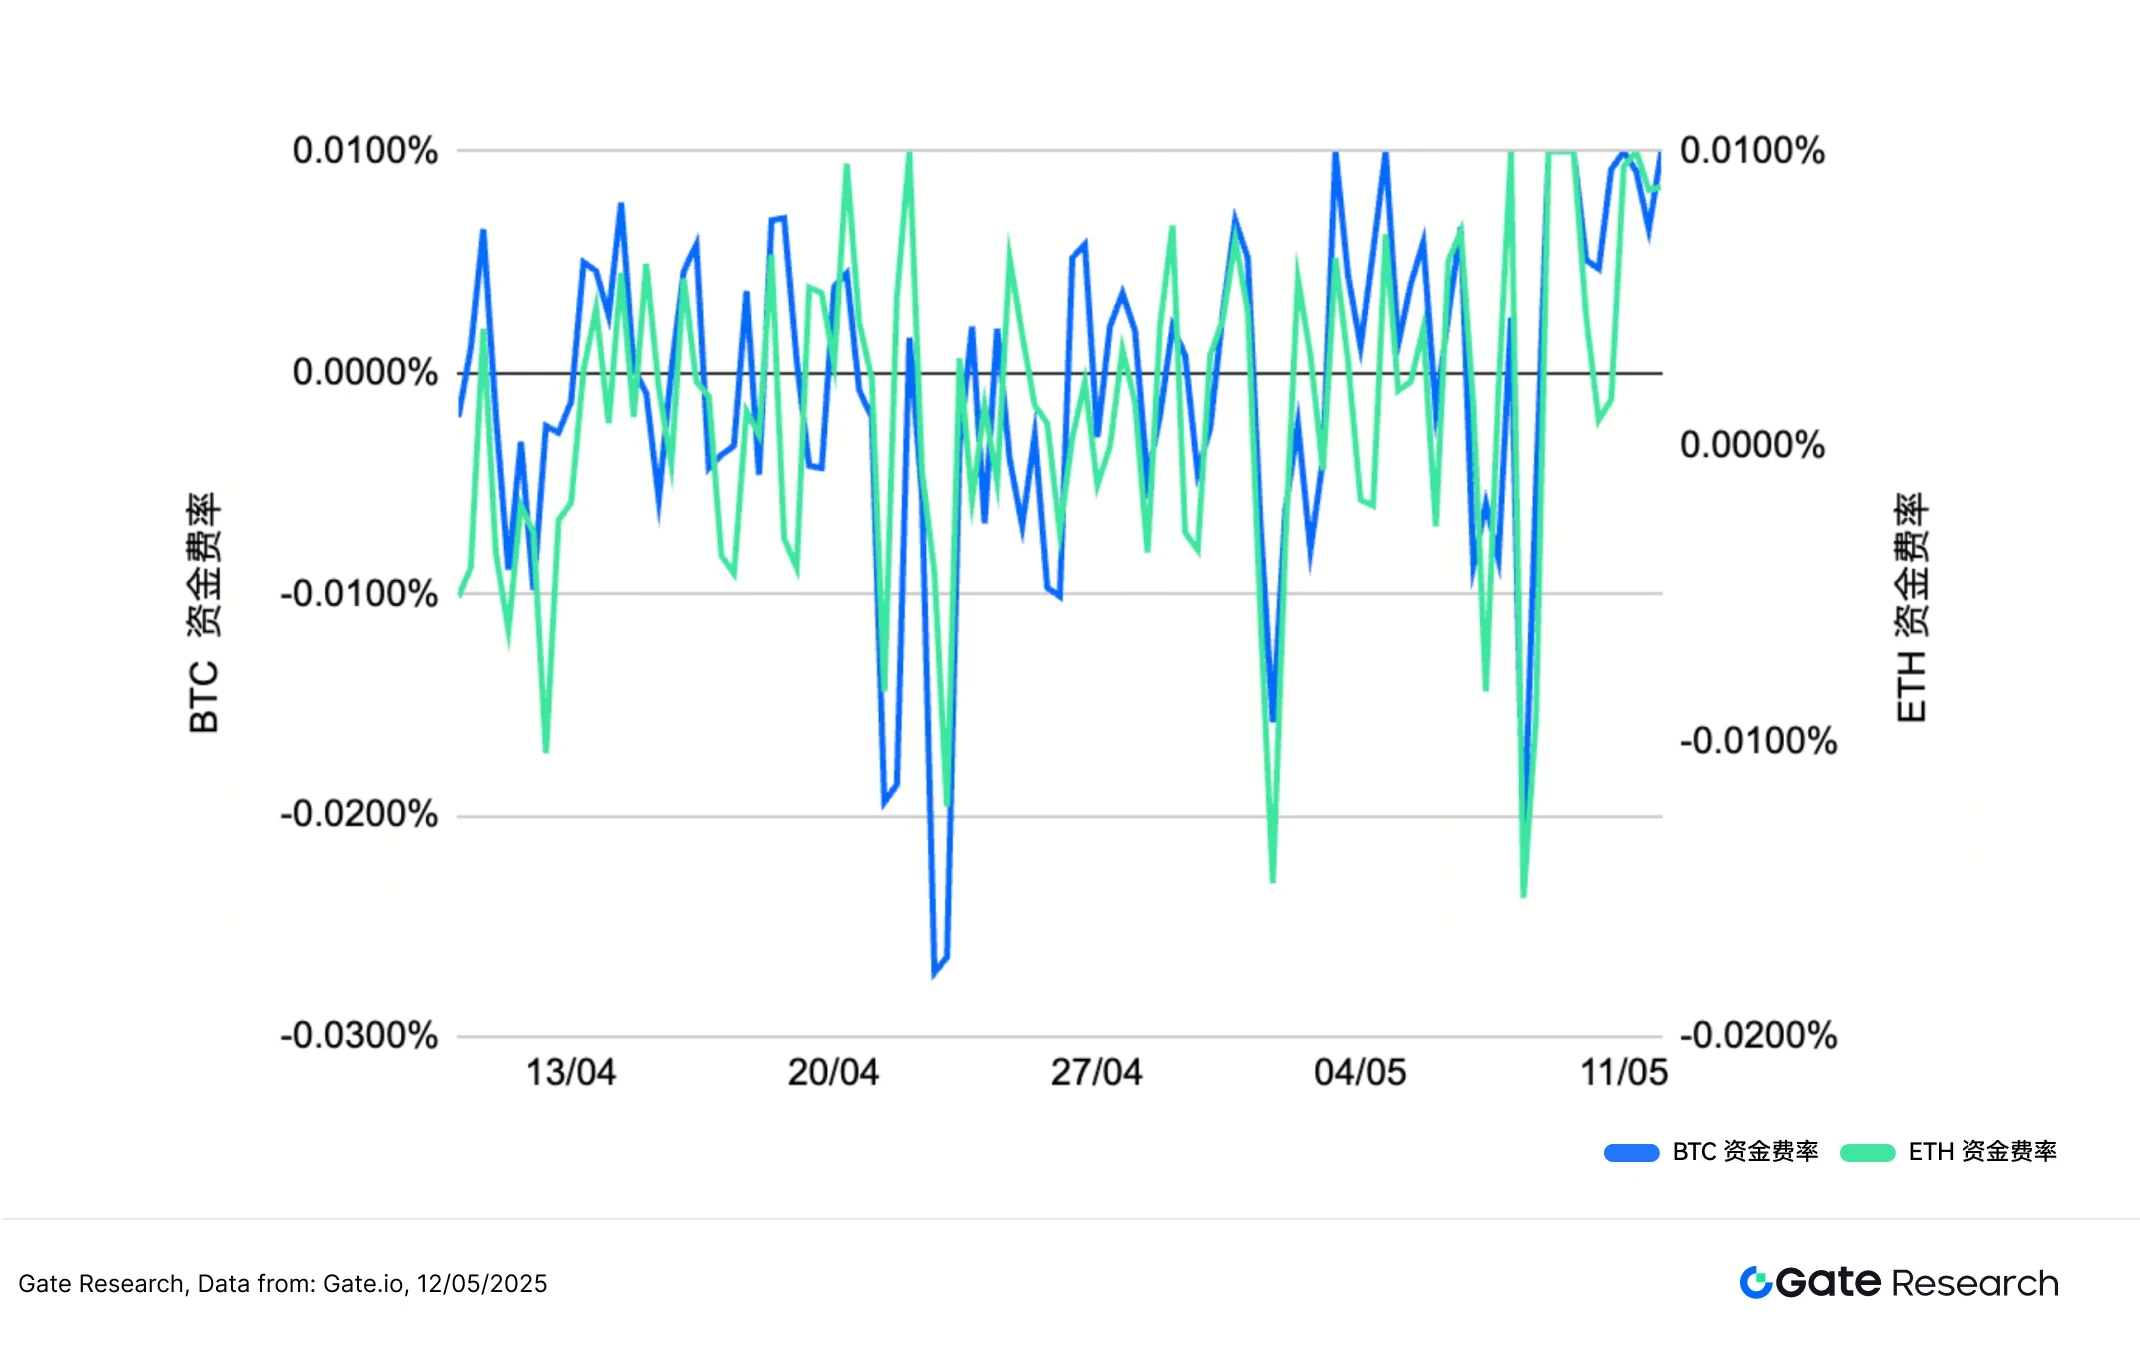
The funding rates for BTC and ETH have generally remained around 0%, showing frequent positive and negative switches, indicating a relatively balanced market between bulls and bears. In mid to late April, BTC experienced several instances of negative funding rates, particularly around April 20, when it dipped to -0.025%, indicating that shorts dominated the market at that time, or there were large-scale short hedging activities. ETH exhibited a similar trend during the same period, but with slightly smaller fluctuations, suggesting that although the market briefly shifted to bearish sentiment, it did not form sustained pressure.
With the price increase and the rise in contract open interest, both funding rates gradually turned positive, maintaining between 0% and 0.01%, reflecting a gradual bullish advantage and a market inclined towards active positions. However, overall, the funding rates did not continue to soar, indicating that while bullish sentiment for leveraged long positions has strengthened, it has not become overheated, and the market sentiment remains in a moderately optimistic phase.【5】【6】
Figure 6: The funding rates for both BTC and ETH gradually turn positive, maintaining between 0% and 0.01%, reflecting a gradual bullish advantage and a market inclined towards active positions.
5. Cryptocurrency Contract Liquidation Chart
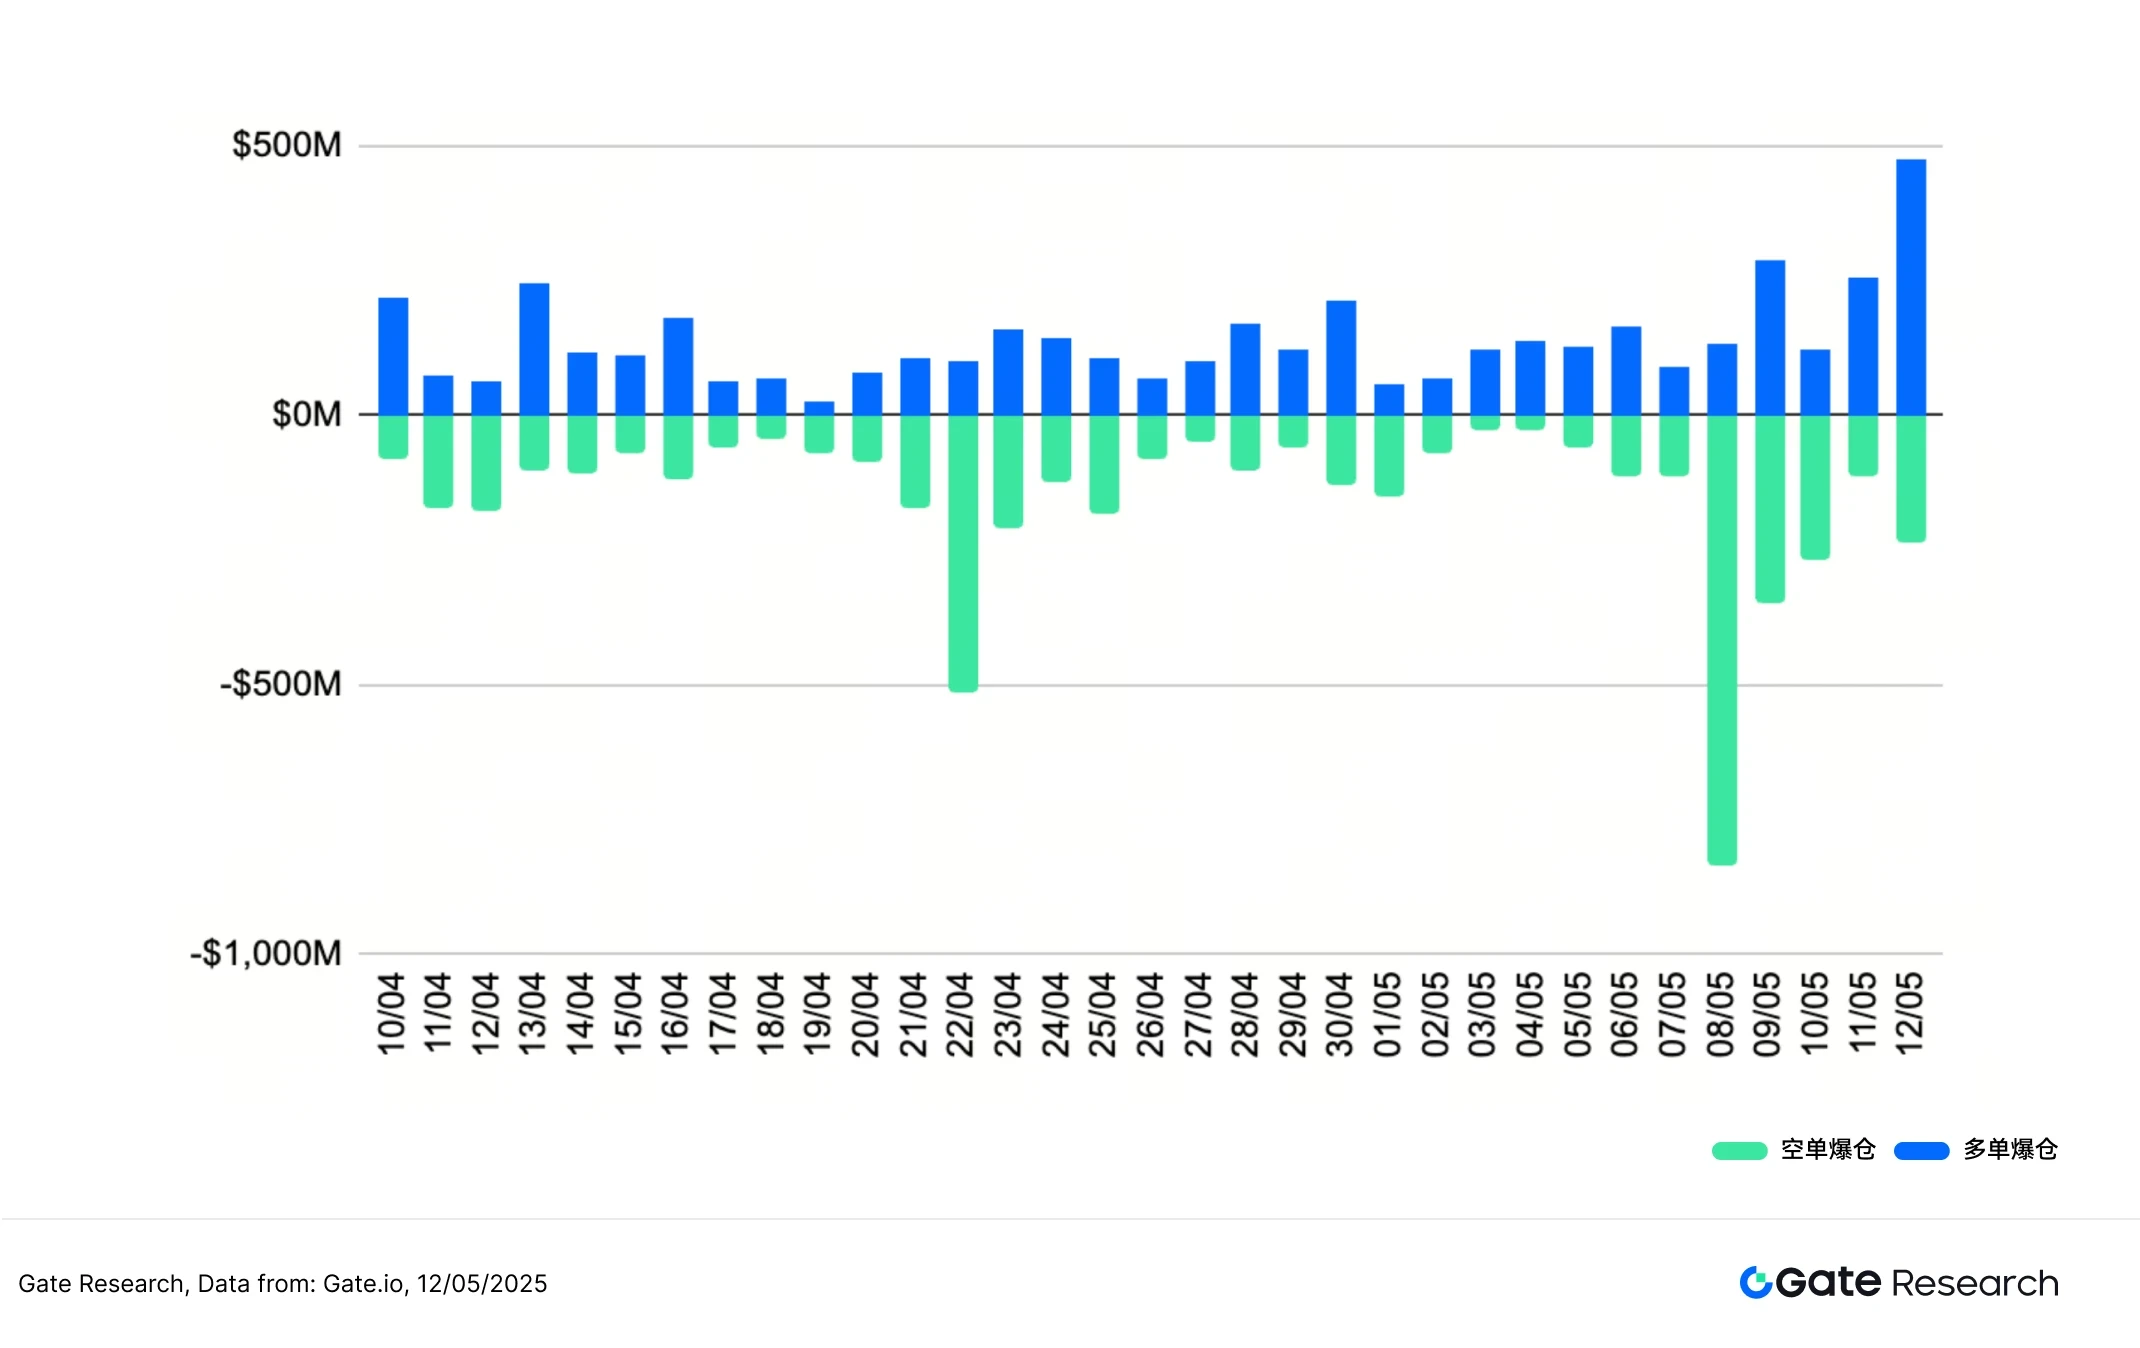
According to Coinglass data, since mid-April, the liquidation situation in the cryptocurrency market has shown an intermingled pattern of long and short liquidations, with short liquidations being particularly significant in early May. Notably, on May 8, the amount of short liquidations surged dramatically, reaching 836 million US dollars in a single day, indicating that the rapid price increase at that time led to a large number of short positions being forcibly closed.
On May 12, as market volatility intensified, the amount of long liquidations significantly increased, reaching 476 million US dollars in a single day, showing that some high-level long traders were unable to withstand the fluctuations and faced reverse liquidations. This phenomenon indicates that although the overall trend is bullish, the short-term market still experiences severe volatility, with both shorts and longs facing setbacks at critical points, and the contract market remains highly active with concentrated risks.
This trend corresponds with the previously mentioned price increases, rising contract open interest, and positive funding rates, reflecting that when the market breaks through key price levels, concentrated short liquidations occur, forming a temporary bullish advantage. However, even in a rising market, long positions at local highs may still face liquidations, especially when market volatility intensifies in mid-May, indicating that long positions also face significant risks, and the characteristics of high leverage and risk hedging in contract trading remain very evident.【7】
Figure 7: On May 8, the amount of short liquidations surged dramatically, reaching 836 million US dollars in a single day.
Quantitative Analysis - Dense Moving Average Breakthrough Strategy
(Disclaimer: All predictions in this article are based on historical data and market trends, and are for reference only. They should not be considered as investment advice or guarantees of future market trends. Investors should fully consider risks and make cautious decisions when engaging in related investments.)
1. Strategy Overview
The "Dense Moving Average Breakthrough Strategy" is a momentum strategy that combines technical trend judgment. The strategy identifies potential directional volatility in the market by observing the convergence of multiple short to medium-term moving averages (such as 5-day, 10-day, 20-day, etc.) over a specific period. When multiple moving averages trend in unison and converge, it typically indicates that the market is in a consolidation phase, waiting for a breakout. If the price clearly breaks upward through the moving average area, it is considered a bullish signal; conversely, if the price breaks downward through the moving average band, it is seen as a bearish signal.
To enhance the strategy's practicality and risk control effectiveness, this strategy also incorporates a fixed ratio for take-profit and stop-loss mechanisms, ensuring timely entry and exit when trends emerge, balancing reward and risk control. The overall strategy is suitable for capturing medium to short-term trend movements and possesses a certain level of discipline and operability.
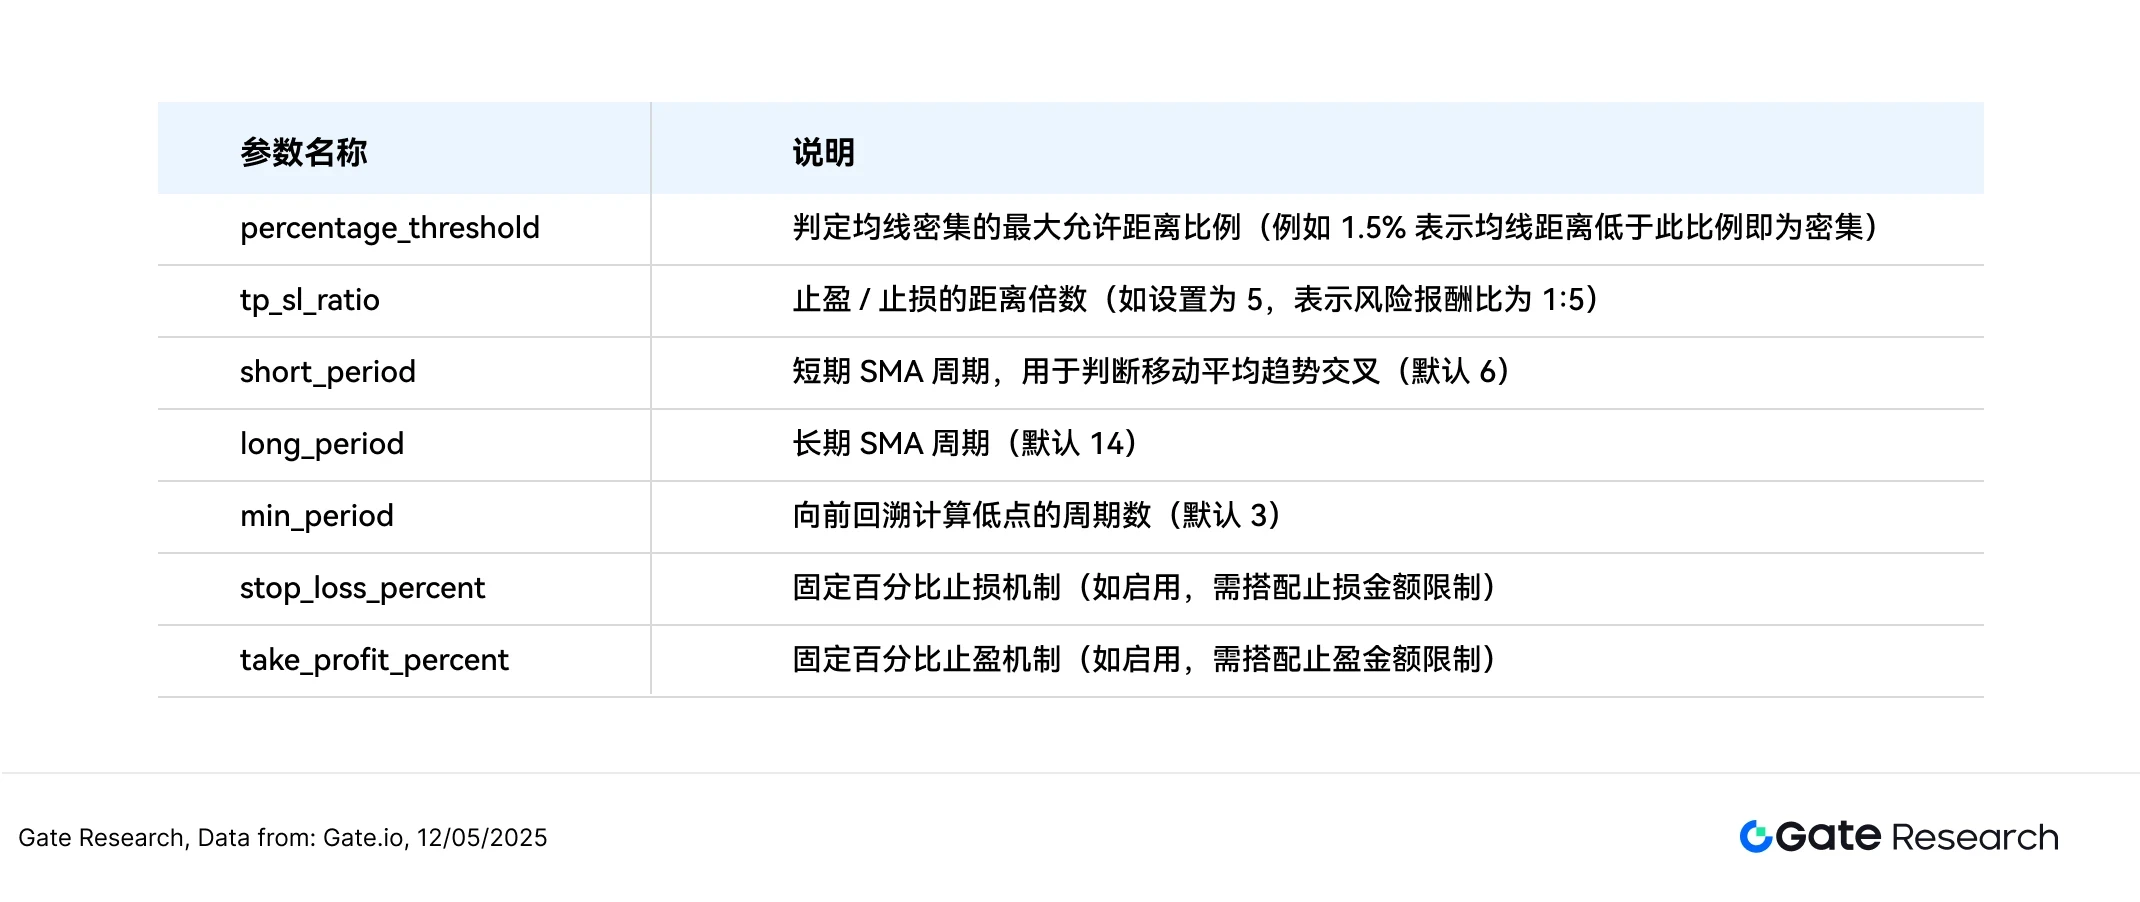
2. Core Parameter Settings
3. Strategy Logic and Operation Mechanism
Entry Conditions
• Moving Average Convergence Judgment: Calculate the maximum and minimum value differences of six moving averages (SMA20, SMA60, SMA120, EMA20, EMA60, EMA120) (referred to as moving average distance). When the distance is below a set threshold (e.g., 1.5% of the price), it is considered dense moving averages.
The threshold is a critical value, indicating the minimum or maximum value that an effect can produce.
• Price Breakthrough Judgment:
○ When the current price crosses above the highest value of the six moving averages, it is considered a bullish breakout signal, triggering a buy operation.
○ When the current price falls below the lowest value of the six moving averages, it is considered a bearish breakout signal, triggering a sell operation.
Exit Conditions: Dynamic Take-Profit and Stop-Loss Mechanism
• Long Position Exit:
○ If the price falls below the lowest moving average at the time of opening, it triggers a stop-loss;
○ Or if the price rises beyond the "distance between the opening price and the lowest moving average × profit-loss ratio," it triggers a take-profit.
• Short Position Exit:
○ If the price rises above the highest moving average at the time of opening, it triggers a stop-loss;
○ Or if the price falls beyond the "distance between the opening price and the highest moving average × profit-loss ratio," it triggers a take-profit.
Practical Example Chart
• Trading Signal Trigger
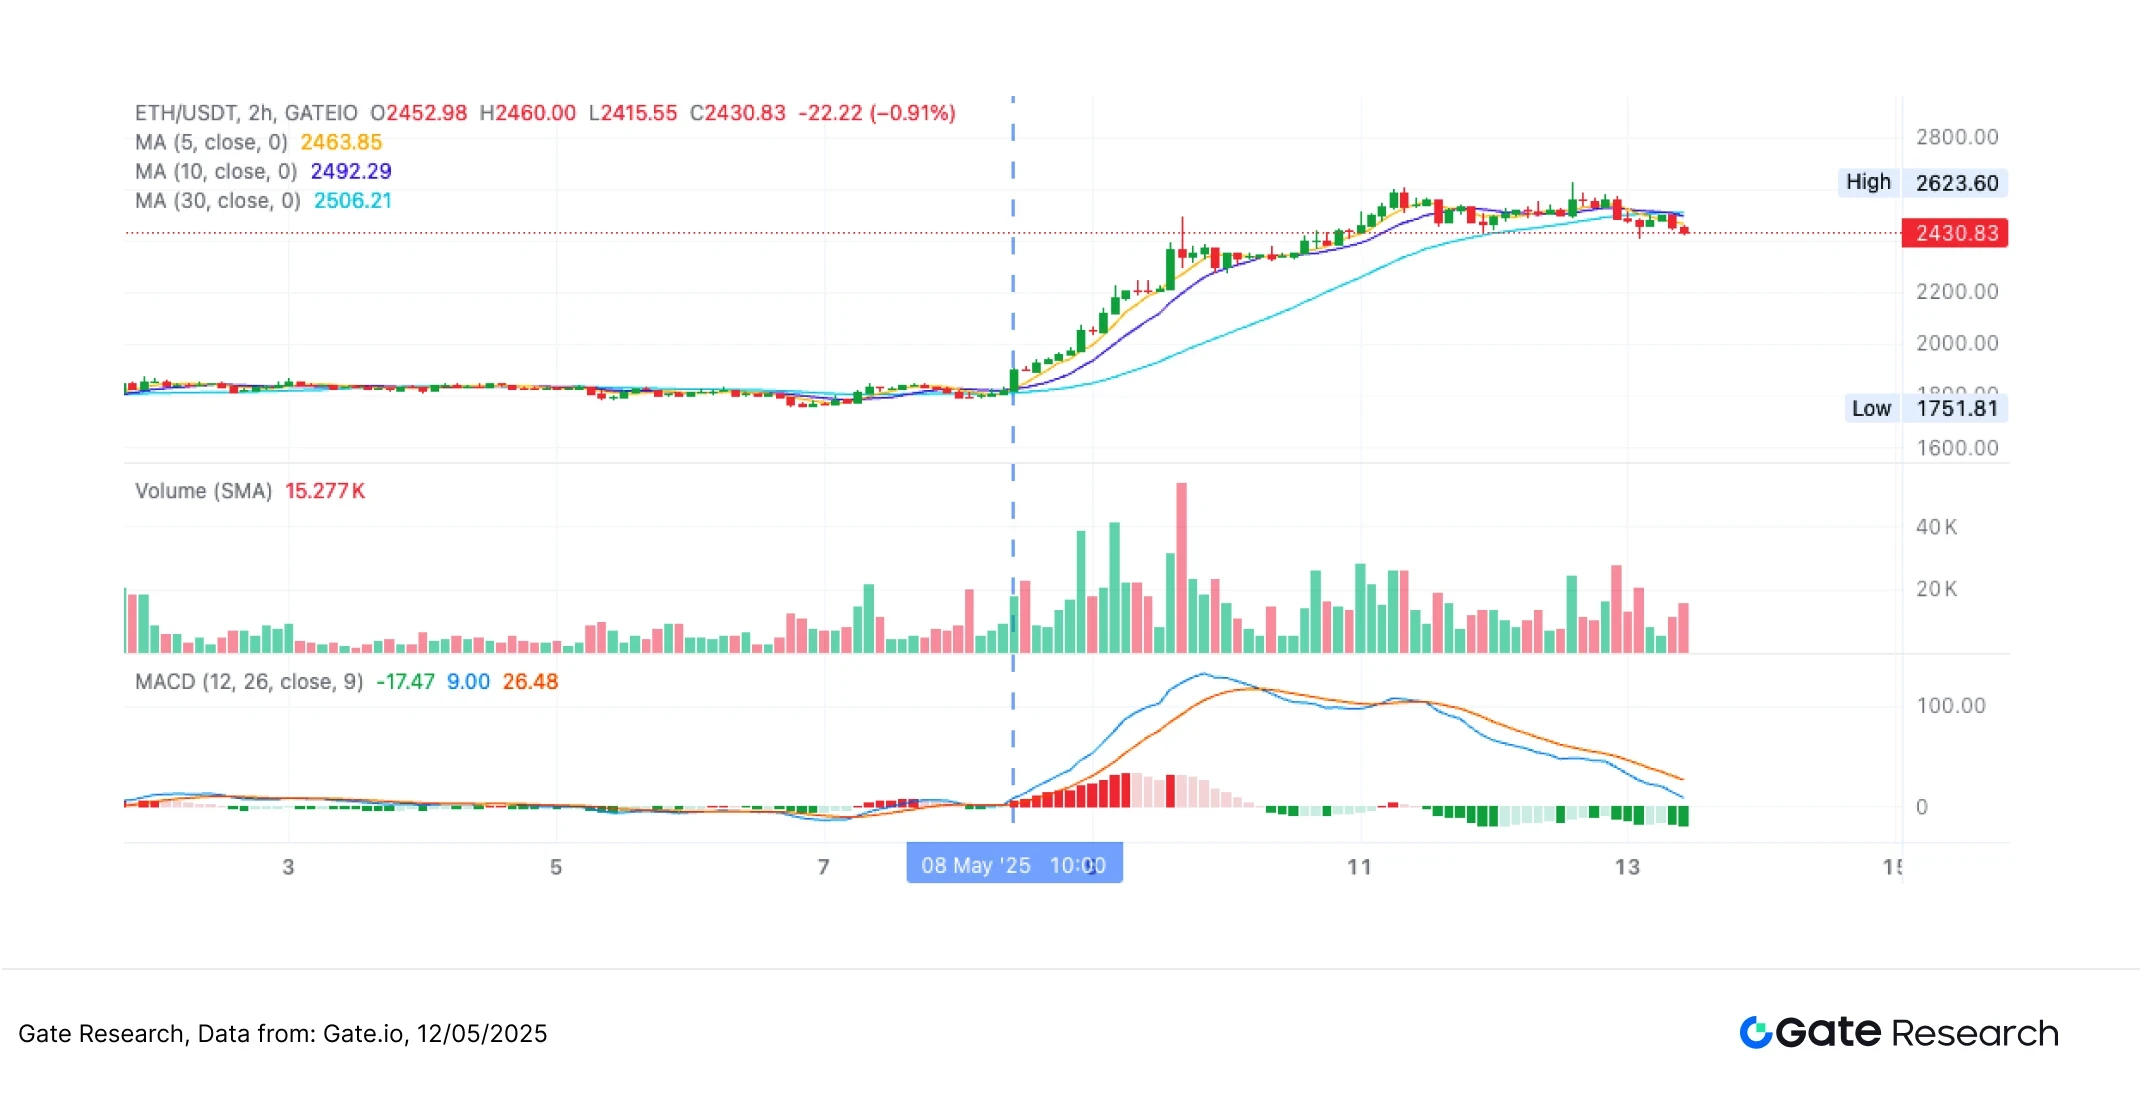
The following chart shows the ETH/USDT 2-hour candlestick chart when the strategy last triggered an entry on May 8, 2025. It can be seen that the price broke upward after the six moving averages were densely packed, meeting the entry conditions set by the strategy, and the system executed a buy operation at the breakout price, successfully capturing the starting point of the subsequent upward trend.
Figure 8: Actual entry position diagram when the strategy conditions were triggered for ETH/USDT (May 8, 2025)
• Trading Actions and Results
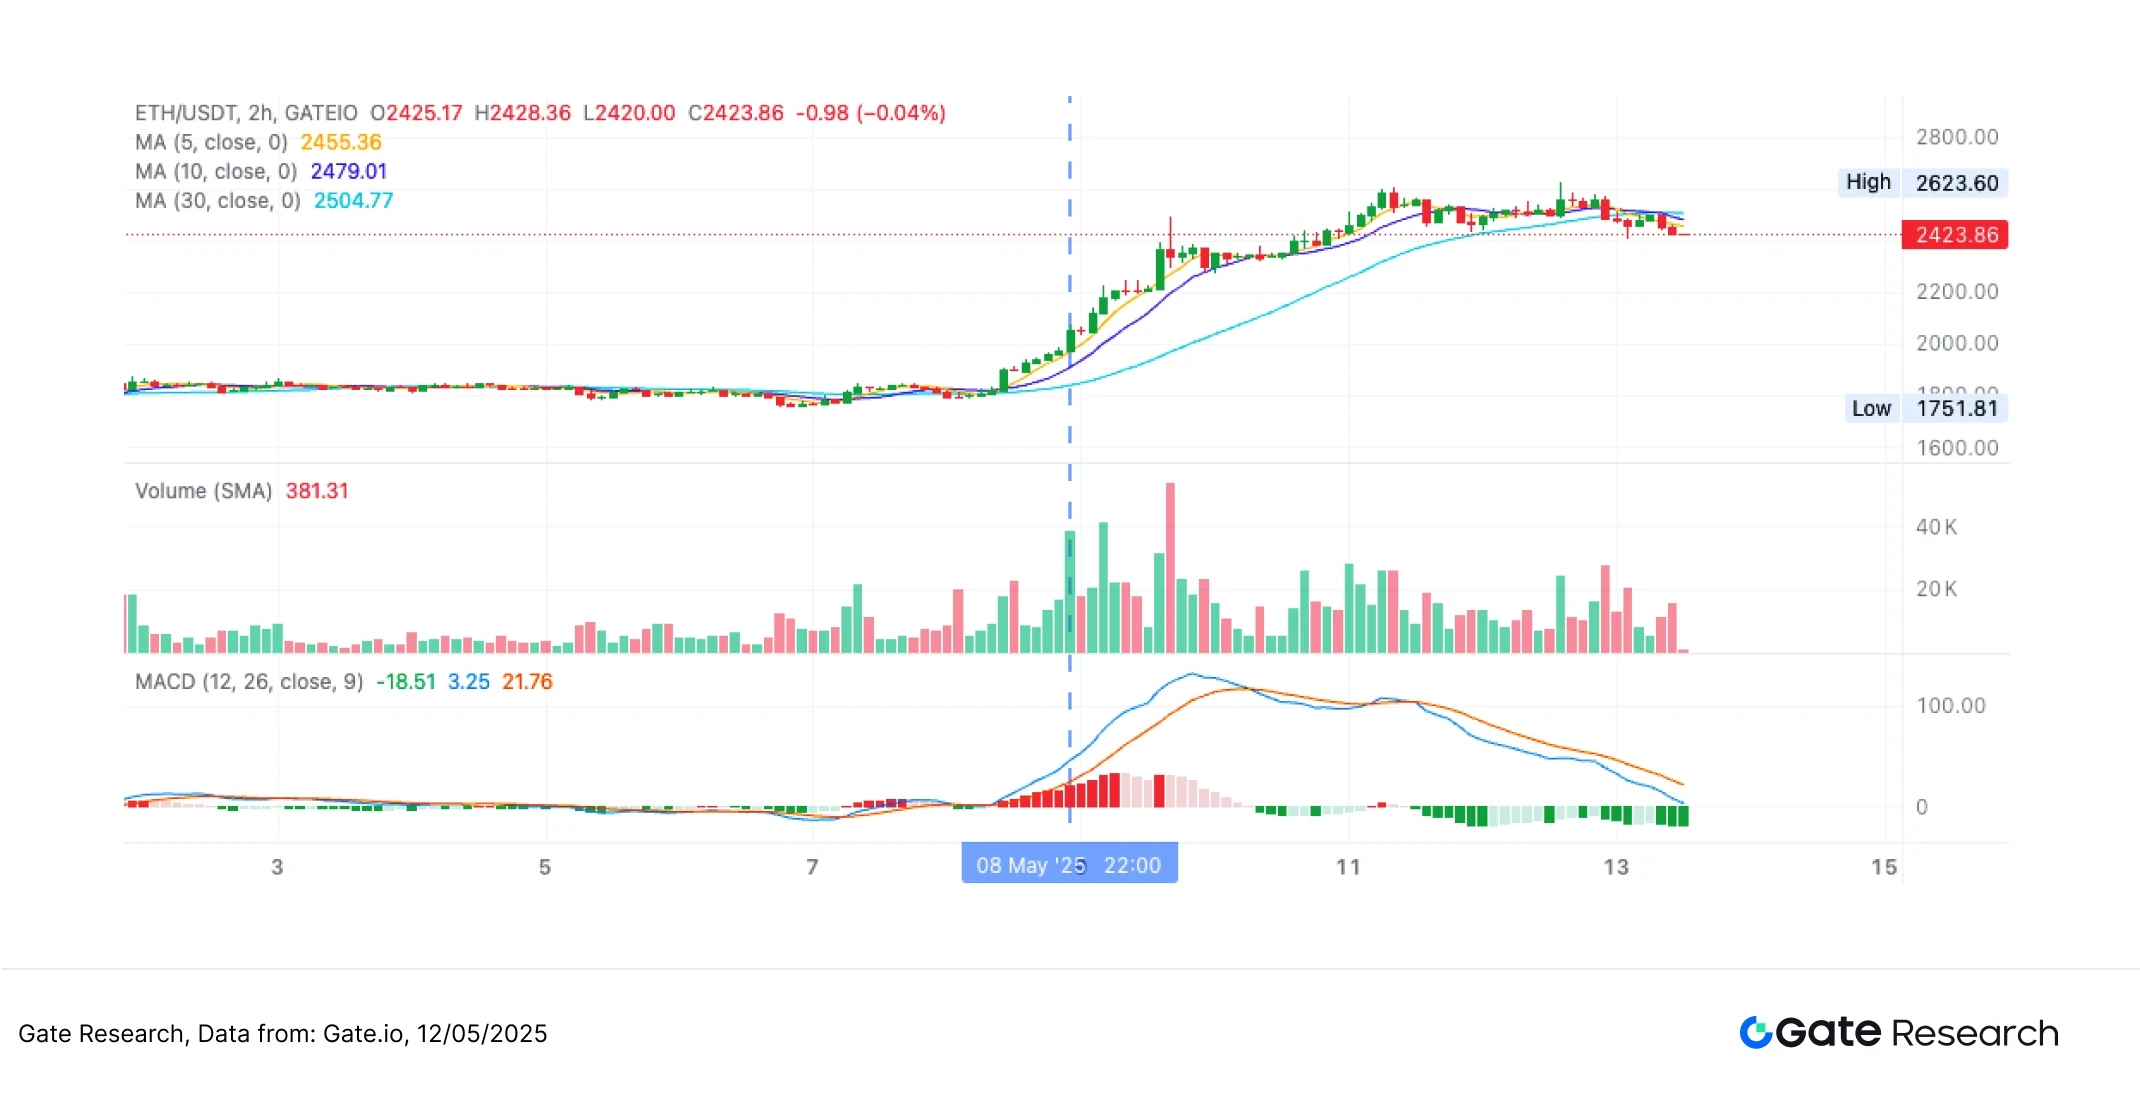
The system automatically exits based on the dynamic take-profit mechanism upon reaching the preset profit-loss ratio, effectively locking in major segment profits. Although there was still upward potential not captured afterward, the overall operation adhered to the strategy's discipline, demonstrating good risk control and execution stability. If combined with a trailing stop or trend-following mechanism, it may further extend profit potential in a strong trend.
Figure 9: Exit position diagram for ETH/USDT strategy (May 8, 2025)
Through the above practical example, we visually present the entry logic and dynamic take-profit mechanism of the strategy when the moving averages are dense and the price breakthrough conditions are triggered. The strategy captures the trend initiation point precisely through the interaction between price and moving average structure, and automatically exits during subsequent fluctuations, locking in the main profit range while controlling risk. This case not only validates the strategy's practicality and execution discipline but also reflects its stability and risk control ability in real markets, laying the foundation for future parameter optimization and strategy summarization.
4. Practical Application Example
Parameter Backtesting Settings
To find the best parameter combinations, we conducted a systematic grid search within the following ranges:
• tpslratio: 3 to 14 (step size of 1)
• threshold: 1 to 19.9 (step size of 0.1)
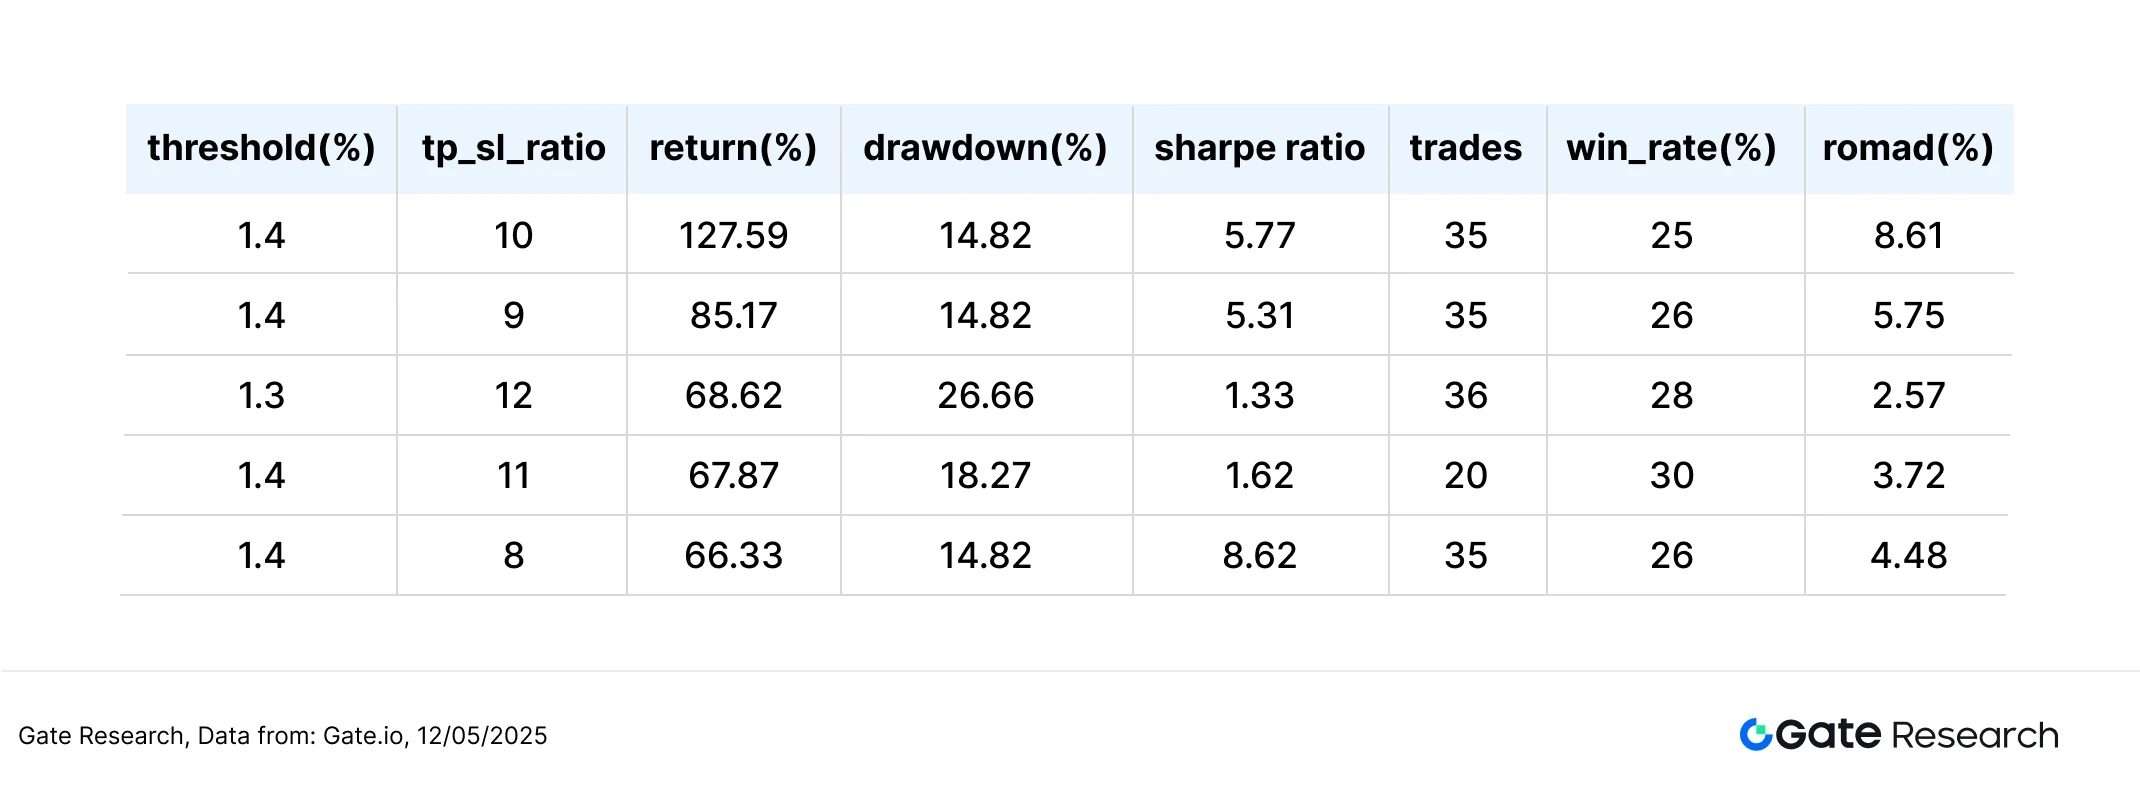
Taking ETH/USDT as an example, in the backtesting data of the past year using 2-hour candlesticks, the system tested a total of 23,826 parameter combinations and selected the five groups with the best cumulative return performance. Evaluation criteria include annualized return rate, Sharpe ratio, maximum drawdown, and ROMAD (return to maximum drawdown ratio), used to comprehensively assess strategy performance.
Figure 10: Comparison table of the five optimal strategy performances
Strategy Logic Explanation
When the system detects that the distance between the six moving averages converges to within 1.4%, and the price breaks upward through the upper edge of the moving averages, it triggers a buy signal. This structure aims to capture the moment when the price is about to initiate a breakout, entering at the current price and using the highest moving average at the breakout as a reference for dynamic take-profit, enhancing reward control capability.
The settings used in this strategy are as follows:
• percentage_threshold = 1.4 (maximum distance limit of the six moving averages)
• tpslratio = 10 (dynamic take-profit amplitude setting)
• shortperiod = 6, longperiod = 14 (moving average observation period)
Performance and Result Analysis
The backtesting period is from May 1, 2024, to May 12, 2025. This parameter set performed excellently during this period, achieving an annualized return rate of 127.59%, with a maximum drawdown of less than 15%, and a ROMAD of 8.61%, indicating that the strategy not only has stable capital appreciation capability but also effectively compresses downside risk.
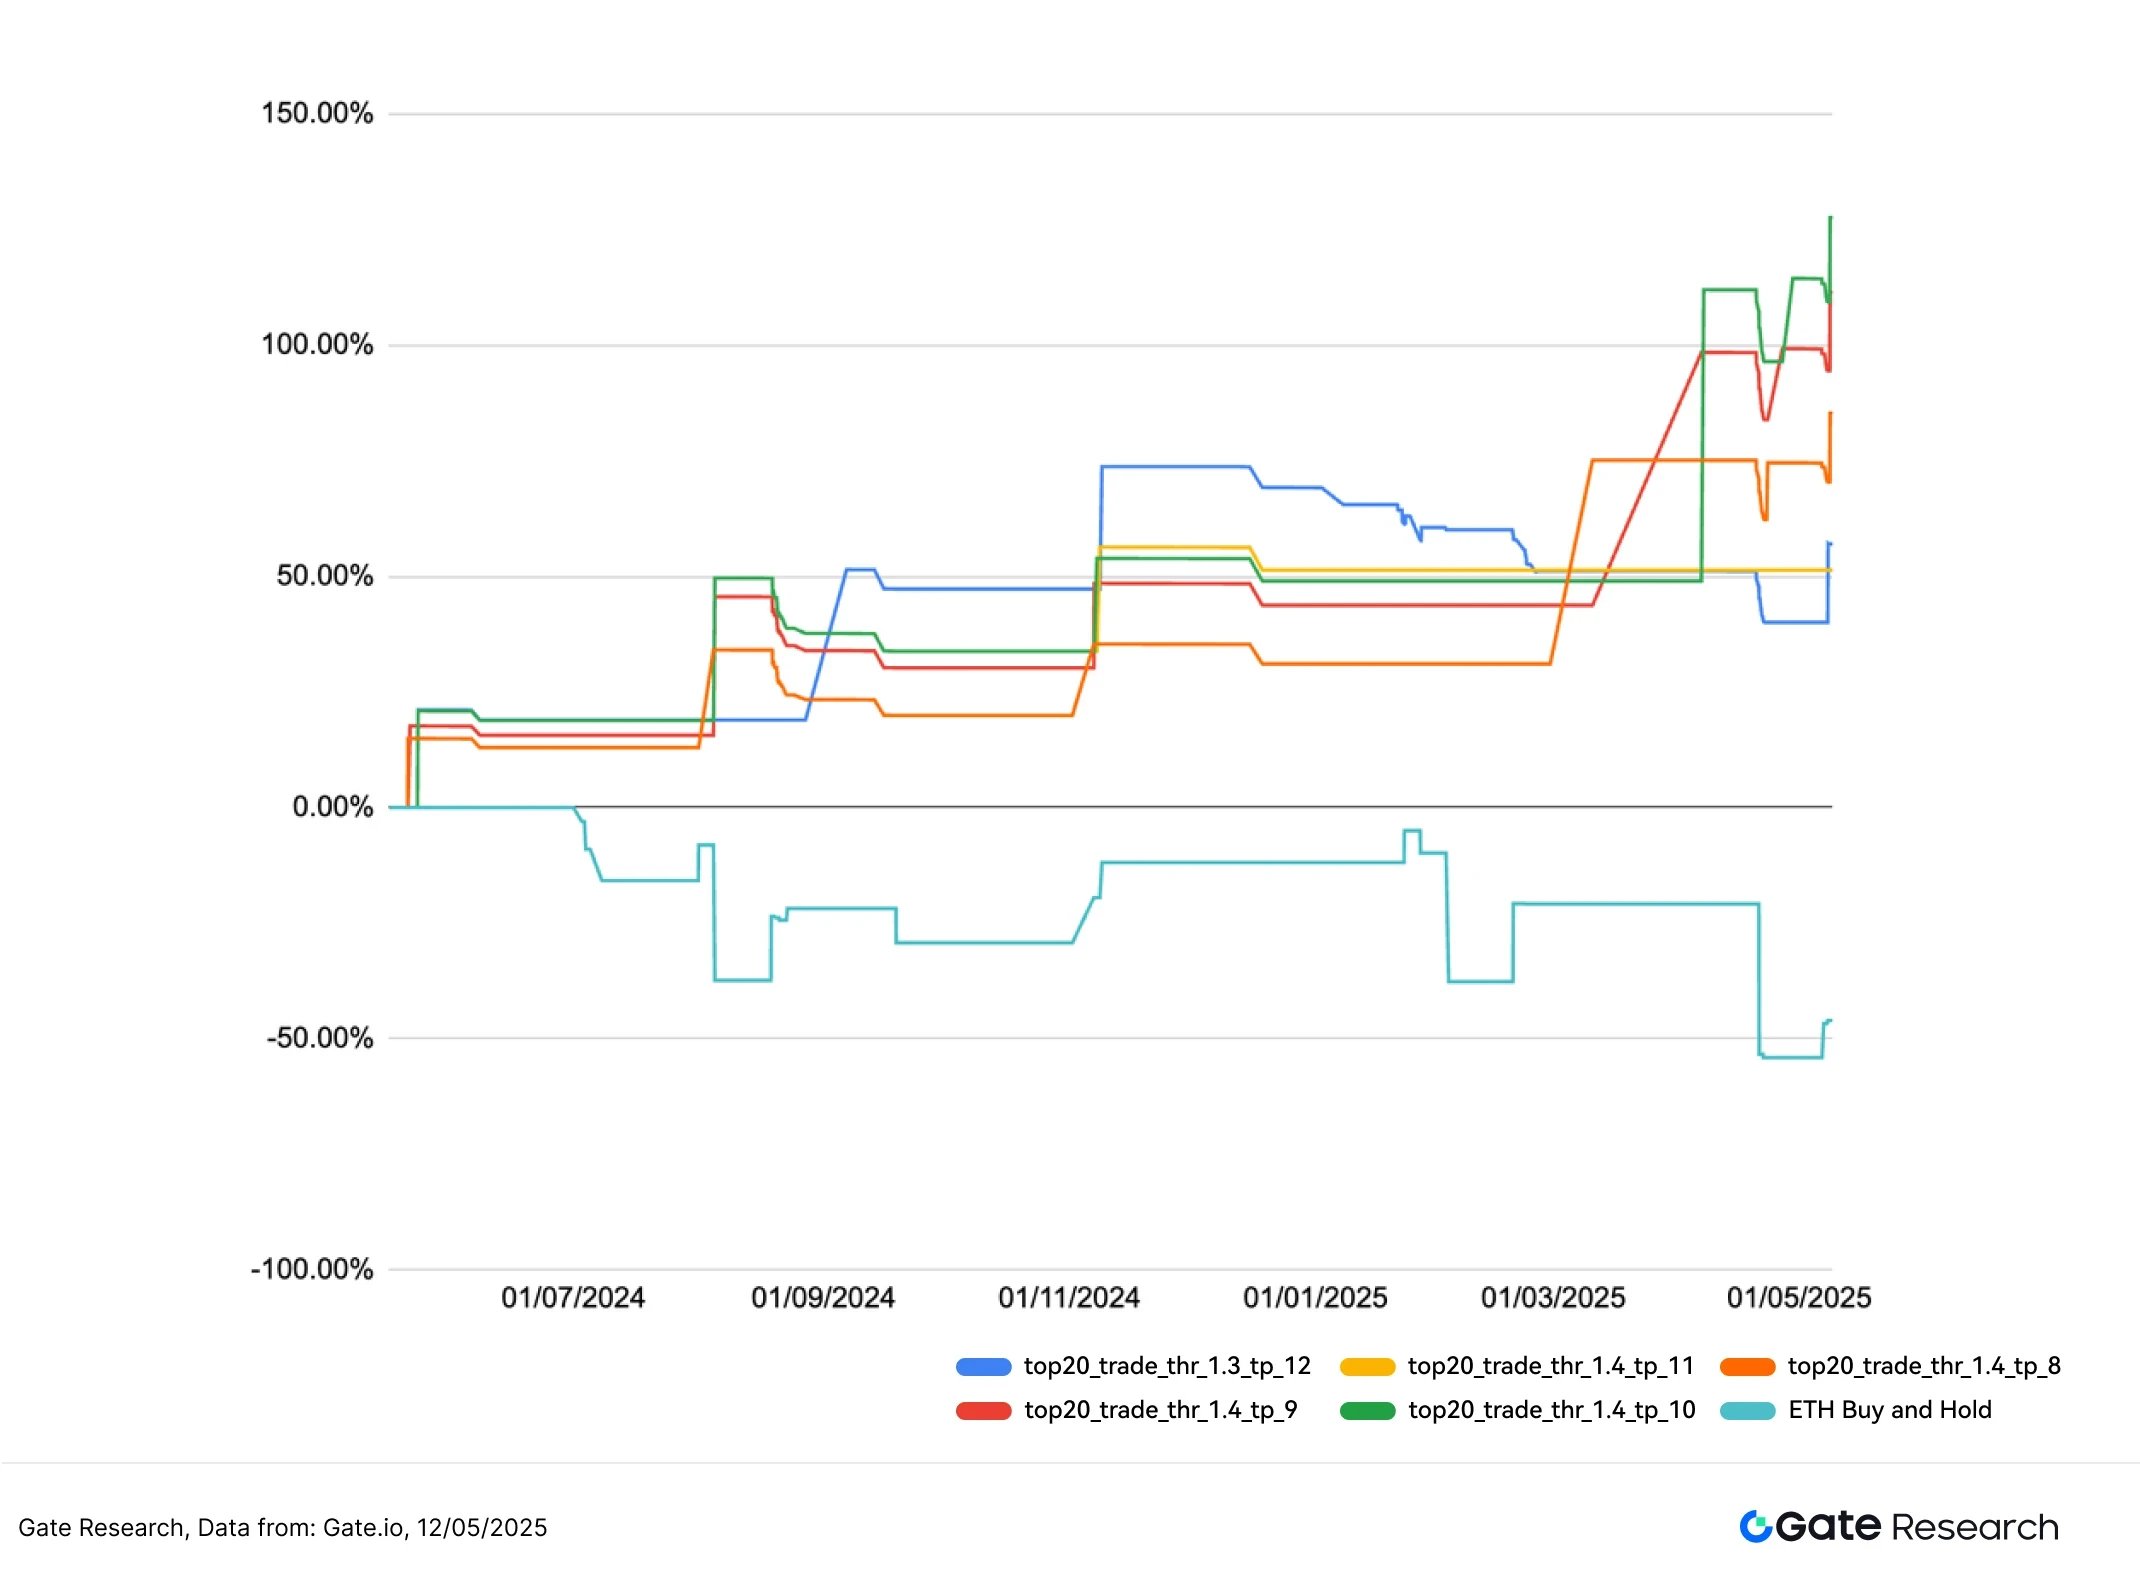
As shown in the figure, the strategy significantly outperformed the ETH Buy and Hold strategy (-46.05%) over the past year, especially during periods of increased market volatility or trend reversals, demonstrating good take-profit and re-entry mechanisms, with drawdown control clearly superior to passive holding.
We also conducted a horizontal comparison of the five best-performing parameter sets, which currently achieve the best balance between returns and stability, possessing strong practical application value. In the future, further integration of dynamic threshold adjustment mechanisms or the addition of volume and volatility filtering logic may enhance adaptability in volatile markets and expand to multi-currency and multi-period strategy deployments.
Figure 11: Comparison of cumulative return rates over the past year between the five optimal parameter strategies and ETH holding strategy
5. Trading Strategy Summary
The "Dense Moving Average Breakthrough Strategy" is a trend-based momentum strategy designed based on the dynamic aggregation state of multiple short to medium-term moving averages. By detecting moving average convergence and price breakout behaviors, it captures key turning points before market initiation. This strategy integrates price structure judgment and dynamic take-profit mechanisms, effectively participating in medium to short-term trend segments while controlling drawdowns.
In this backtest, we used ETH/USDT as the target, employing 2-hour candlestick data for systematic grid parameter optimization, covering 23,826 parameter combinations. The backtesting period was from May 1, 2024, to May 12, 2025, ultimately selecting the five parameter sets with the best performance in terms of returns and risk control, and analyzing their performance based on annualized return rate, maximum drawdown, Sharpe ratio, and ROMAD. The best strategy combination was: percentagethreshold = 1.4, tpsl_ratio = 10, achieving an annualized return rate of 127.59%, with maximum drawdown controlled below 15%, and ROMAD reaching 8.61%, significantly outperforming the ETH Buy and Hold benchmark (which was -46.05% during the same period).
From the parameter distribution observation, the best performance is concentrated in the low threshold values and medium-high tpslratio ranges, indicating that detecting dense moving average structures in the early stages of market brewing and moderately relaxing take-profit space helps capture complete trend movements. Conversely, when the threshold is set too high or the take-profit ratio is too low, the strategy is more prone to frequent entries and exits and premature exits, which can lower overall return rates.
In summary, this strategy demonstrates extremely high return and risk control efficiency within the mid-term volatility structure of ETH, with stable strategy logic and parameter adaptability, possessing high practical potential. Based on the parameter distribution characteristics observed in this backtest, combinations with thresholds between 1.3 and 1.5 and tpslratios between 9 and 11 exhibit more stable performance in terms of returns and risk control across various performance indicators, also reflecting the strategy's strong ability to capture momentum at the beginning of trends and extend segment profits. Additionally, integrating volume filtering and volatility filtering mechanisms is expected to further enhance the strategy's adaptability and robustness under different market conditions, expanding its deployment potential across markets.
Summary
From April 25 to May 12, the cryptocurrency market exhibited a structural characteristic of "strong price upward movement, yet cautious sentiment." BTC and ETH rose in sync, with ETH showing a larger increase and more volatility. The long-short ratio and funding rates did not show significant bullish bias, indicating limited market enthusiasm for chasing prices. Contract open interest continued to rise, with shorts experiencing concentrated liquidations in early May, followed by longs facing reverse liquidations on May 12, reflecting intensified market divergence under high leverage. Overall, while prices strengthened, market sentiment and capital momentum have not formed a consensus, making risk control and timing crucial for operations.
Quantitative analysis employs the "Dense Moving Average Breakthrough Strategy" for systematic parameter optimization and performance evaluation. In the 2-hour level data of ETH/USDT, the strategy achieved an annualized return rate of 127.59%, significantly outperforming the -46.05% of the ETH Buy and Hold strategy during the same period. This strategy demonstrates good trend-following ability and drawdown control through momentum structure and trend filtering. However, in actual operations, it may still be affected by market fluctuations, extreme conditions, or signal failures. It is recommended to combine other quantitative factors and risk control mechanisms to enhance the strategy's stability and adaptability, and to make rational judgments and respond cautiously.
References:
Gate.io, https://www.gate.io/trade/BTC_USDT
Gate.io, https://www.gate.io/trade/ETH_USDT
Coinglass, https://www.coinglass.com/LongShortRatio
Coinglass, https://www.coinglass.com/BitcoinOpenInterest?utm_source=chatgpt.com
Gate.io, https://www.gate.io/futuresmarketinfo/BTCUSD/capitalrate_history
Gate.io, https://www.gate.io/futures/introduction/funding-rate-history?from=USDT-M&contract=ETH_USDT
Coinglass, https://www.coinglass.com/pro/futures/Liquidations
Glassnode, https://studio.glassnode.com/charts/ba1ec93d-85f4-41fe-5606-798a2f30013a?s=1679144783&u=1742303183
Gate Research Institute is a comprehensive blockchain and cryptocurrency research platform that provides readers with in-depth content, including technical analysis, hot insights, market reviews, industry research, trend forecasts, and macroeconomic policy analysis.
Disclaimer
Investing in the cryptocurrency market involves high risks. Users are advised to conduct independent research and fully understand the nature of the assets and products they are purchasing before making any investment decisions. Gate.io is not responsible for any losses or damages resulting from such investment decisions.
免责声明:本文章仅代表作者个人观点,不代表本平台的立场和观点。本文章仅供信息分享,不构成对任何人的任何投资建议。用户与作者之间的任何争议,与本平台无关。如网页中刊载的文章或图片涉及侵权,请提供相关的权利证明和身份证明发送邮件到support@aicoin.com,本平台相关工作人员将会进行核查。


