First, let's take a look at Bitcoin. After experiencing a downward spike yesterday, it has once again received this upward movement today.
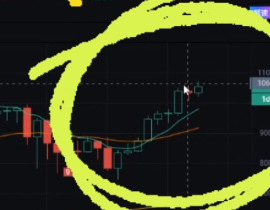
From yesterday's downward spike, we can see that the daily level has formed this upward spiral line.
From this ascending spiral line, it can be observed that as long as the first trend is not broken, the future trend will still mainly focus on low buying.
The points we need to pay attention to above are, the first point is the integer level of 108,000-110,000. This is viewed from the daily level perspective. If this level breaks through the historical high, we will look at the first high point generated after the first wave of upward movement for reference.
Looking down, the integer level of 100,500-100,000 has currently formed a relatively strong support.
As long as the larger trend is not broken, we will still focus on low buying. If it breaks below the 100,000 integer level, we can choose to observe in the short term. Analyze before deciding to enter the market.
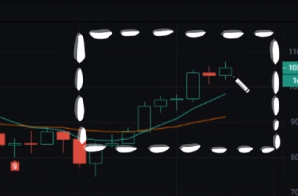
From the 4-hour level, we can see that yesterday also experienced this kind of up-and-down market, more like a wide-range oscillation washout. Currently, this place has formed a small V reversal on the 4-hour chart, and the price has returned above 105,000. Next, we will look at the situation after it consolidates around 105,000. From the daily level, it still tends to break upward.
Next, the priority is to break through the previous high point of 107,000, and then we can look at the area of 108,000-109,000.
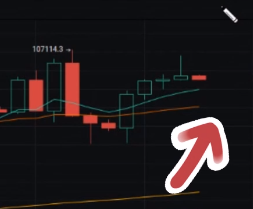
Looking below, we can see that the previous 4-hour level formed a box oscillation. After breaking through yesterday, it made a deep pullback and then surged back above this box. We will continue to observe the situation after it consolidates at this upper edge.
For the upper edge of the box oscillation, we should first pay attention to the support situation in the range of 103,000-104,000, and secondly, the support situation in the range of 102,000-100,700.
Overall, Ethereum's upward trend remains unchanged. After the previous consolidation, it surged, consolidated again, and then surged again.
This wave is more like an adjustment after an upward movement. Currently, the trend is above the trend line. If today’s candlestick closes above this level,
then we will continue to look for buying opportunities after a pullback. The upper targets we have set are 2,800, 2,860, and 2,930.
Looking down, there are some good support levels at 2,500, 2,450, 2,400, and 2,300. Currently, these points below are relatively good levels to consider entering after a pullback.
For more strategies, you can follow the public account: KK Strategy

免责声明:本文章仅代表作者个人观点,不代表本平台的立场和观点。本文章仅供信息分享,不构成对任何人的任何投资建议。用户与作者之间的任何争议,与本平台无关。如网页中刊载的文章或图片涉及侵权,请提供相关的权利证明和身份证明发送邮件到support@aicoin.com,本平台相关工作人员将会进行核查。


