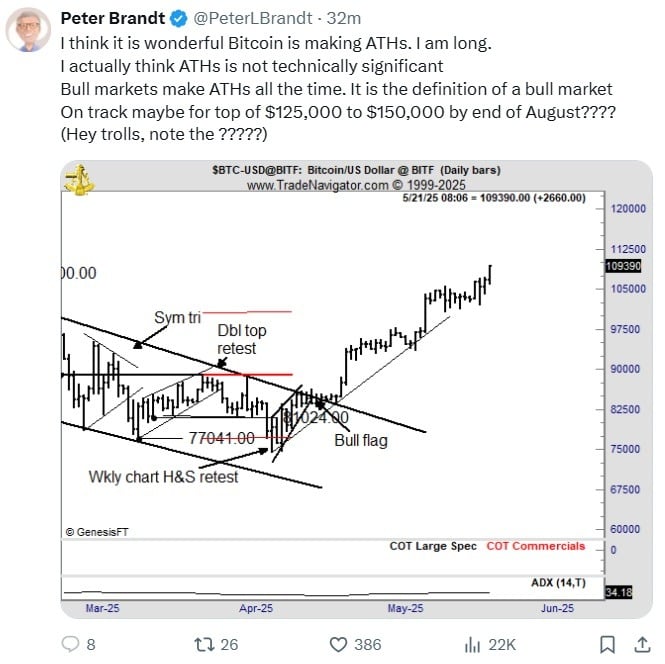
Veteran trader Peter Brandt offered a technical perspective on bitcoin’s recent price surge on May 21, following the cryptocurrency’s breakout to a new all-time high (ATH). Using a detailed chart analysis, Brandt shared his interpretation of the bullish momentum on social media platform X, highlighting that the new peak, while noteworthy, is not necessarily a decisive technical event on its own. Instead, he emphasized the presence of established bullish continuation patterns that support the ongoing uptrend.

His BTC/USD chart features several key technical formations. Among these are a symmetrical triangle (sym tri), a double top retest, a head-and-shoulders retest visible from the weekly chart, and a breakout from a well-defined bull flag pattern. The $77,041 and $81,024 levels marked significant price floors during consolidation phases. A successful retest of these zones helped confirm the broader bullish structure before bitcoin resumed its strong upward trajectory, ultimately breaking past resistance and establishing new highs above $109K.
In addition to the current momentum, Brandt pointed to the possibility of further gains, suggesting a potential range between $125K and $150K by late summer. The veteran trader wrote:
On track maybe for top of $125,000 to $150,000 by end of August????
However, he clarified with, “Hey trolls, note the ?????,” indicating the projection was speculative and not a definitive forecast. While price targets are uncertain and sensitive to market volatility, current technical indicators suggest strength in the upward trend. Though skeptics question the rally’s durability, proponents point to bitcoin’s pattern of achieving new highs during bull cycles. Brandt’s chart formations offer a framework for analyzing potential price movements as the market approaches the third quarter.
免责声明:本文章仅代表作者个人观点,不代表本平台的立场和观点。本文章仅供信息分享,不构成对任何人的任何投资建议。用户与作者之间的任何争议,与本平台无关。如网页中刊载的文章或图片涉及侵权,请提供相关的权利证明和身份证明发送邮件到support@aicoin.com,本平台相关工作人员将会进行核查。


