Today is May 23rd, Friday. Let's take a look at today's market trends. From the daily chart perspective, the current closing price has little reference significance. We are currently feeling uncertain about the direction. The same applies to the 12-hour chart, but from the current 6-hour position, there is a temporary top at 111,950.
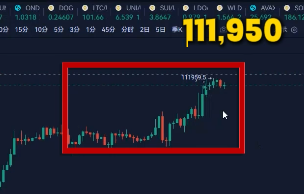
The 6-hour top divergence is also starting to correct, and the 4-hour chart is clearer with a high position short already established. Currently, both the 4-hour and 3-hour charts are at high positions, so this position can only be described as having a space for oscillating downwards.
Overall, it is a high-level oscillation. If the 110,300 level does not break down, then it will oscillate here before pulling higher, until it eventually breaks below 110,300, which would then create a story for the downside.
For now, just pay attention to this top oscillation range.
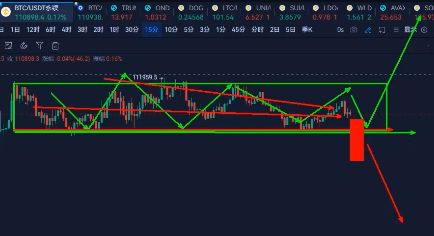
Currently, after the peak of Bitcoin, a brand new top structure has emerged from the 4-hour chart, with a temporary dark cloud cover appearing.
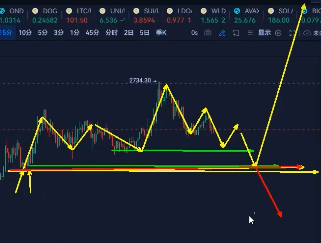
Ethereum still primarily favors low longs. As long as it does not break down, it will still maintain a bullish stance.
If 2,600 breaks down, it will be similar to Bitcoin's 110,300, which would then create space for the downside.
Therefore, the overall direction and points are very clear. If you are unsure about your own points, you can follow the public account: KK Strategy.

免责声明:本文章仅代表作者个人观点,不代表本平台的立场和观点。本文章仅供信息分享,不构成对任何人的任何投资建议。用户与作者之间的任何争议,与本平台无关。如网页中刊载的文章或图片涉及侵权,请提供相关的权利证明和身份证明发送邮件到support@aicoin.com,本平台相关工作人员将会进行核查。


