Pionex: Bitcoin Latest Market Analysis on May 24
Article Published on 2025.5.24 ---- 0:10
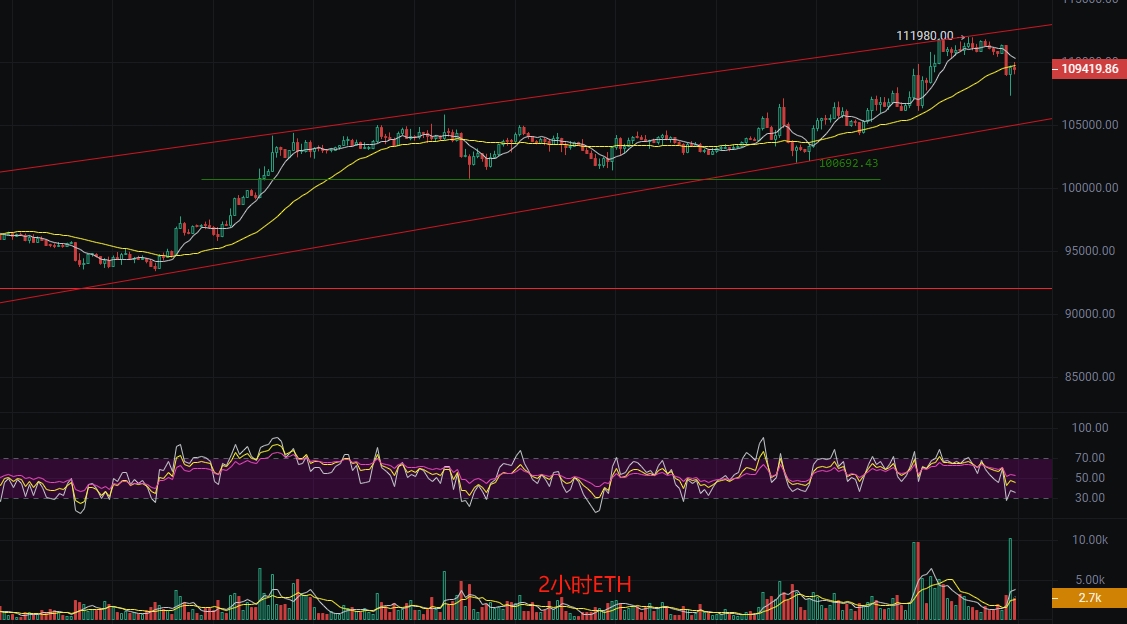
The current price of Bitcoin is 110,000. I am temporarily not looking at long-term indicators. From a short-term analysis perspective, I would like to provide some references. First, the market has pulled back from a high position, and the key resistance level of 112,000 may face pressure for a short-term trend correction. Due to the MA7 crossing below the MA30 and the MACD showing insufficient momentum, I believe the main force will continue to test support levels. Therefore, I suggest that investors remain cautious during this phase. The market price may continue to test the support level around 100,000 in the short term. Additionally, the K-line spinning top pattern has appeared recently, and the dark cloud cover at a high position indicates a possible decline. The doji at the main turning point suggests a trend reversal or consolidation. Thus, I judge that the main force will either consolidate at a high level or adjust downwards. Therefore, the short-term strategy should focus on short positions at resistance levels, with long positions as a supplement.
Today's Reference Points:
- Long Entry Point: 105,500, Stop Loss: 104,500, Target: 109,000
- Short Entry Point: 110,500, Stop Loss: 111,000, Target: 107,000
Ethereum Latest Market Analysis
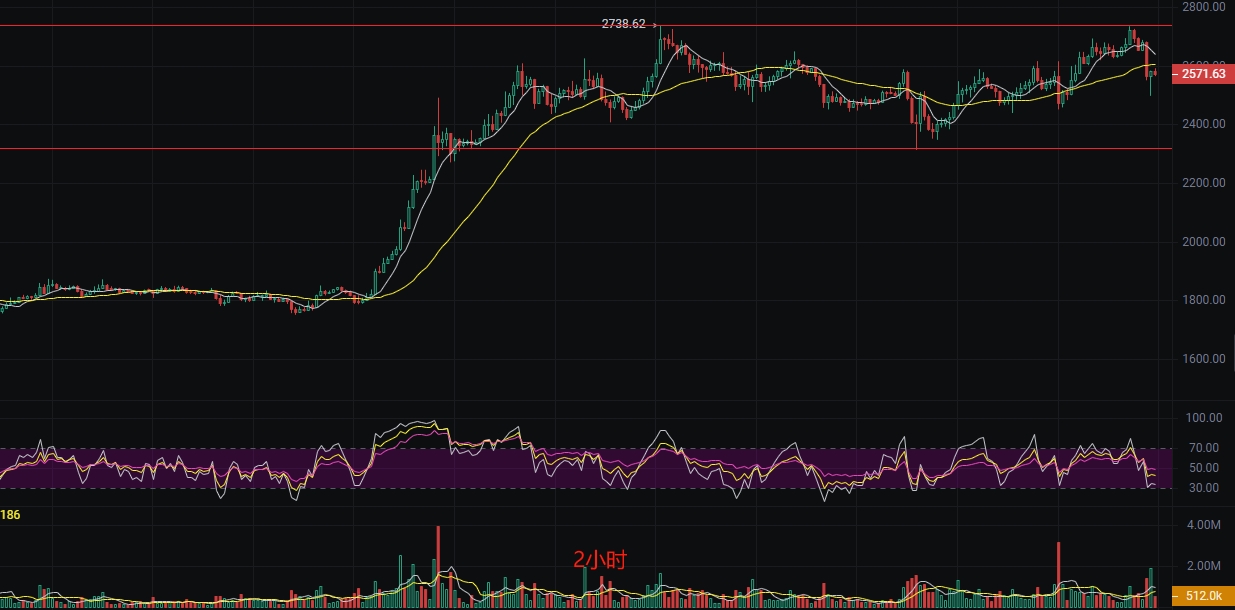
Before publication, the current price of Ethereum is 2,570. I have noticed that the various moving averages are beginning to converge in the short term, and the MACD shows a death cross trend. Therefore, I suggest that the market currently lacks clear upward momentum in the short term. I recommend that crypto friends pay attention to the MA30; if it breaks down, consider reducing positions or adjusting strategies to avoid potential risks. From a technical perspective, the K-line patterns of spinning tops, dark cloud cover, and doji have appeared near key high points, which may indicate a trend reversal or continuation of consolidation. The likelihood of a bearish continuation is increasing; if the pullback does not break the resistance level, consider opening short positions, and temporarily wait to see if there is a need to open long positions after another bottom test.
Short-term Strategy Reference:
- Long Entry Point: 2,500, Stop Loss: 2,450, Target: 2,650
- Short Entry Point: 2,650, Stop Loss: 2,700, Target: 2,500
The above is a brief analysis by me regarding the current market situation for investors' reference. Over the past ten years, I have continuously explored and experienced hundreds of different digital assets. Throughout this process, I have witnessed the brilliance of bull markets and the gloom of bear markets, accumulating countless valuable experiences and profound lessons along the way. As a female trader striving in this challenging field, I feel a responsibility to share my insights and experiences, hoping to help others with dreams find their place in this unpredictable market and embark on their own successful journey.

The content of this article is time-sensitive and for reference only; risks are borne by the reader.
免责声明:本文章仅代表作者个人观点,不代表本平台的立场和观点。本文章仅供信息分享,不构成对任何人的任何投资建议。用户与作者之间的任何争议,与本平台无关。如网页中刊载的文章或图片涉及侵权,请提供相关的权利证明和身份证明发送邮件到support@aicoin.com,本平台相关工作人员将会进行核查。


