Life often leaves people speechless. When we laugh, it doesn't necessarily mean we're happy; it might be a form of helplessness. When we cry, it doesn't necessarily mean we're sad; it might be a form of release. After walking a certain path, we always want to see a view; sometimes we may cry because we've already integrated it into our lives. When we sing a song, we often fall silent because it's hard to let go. In the storms of life, remain calm at heart!
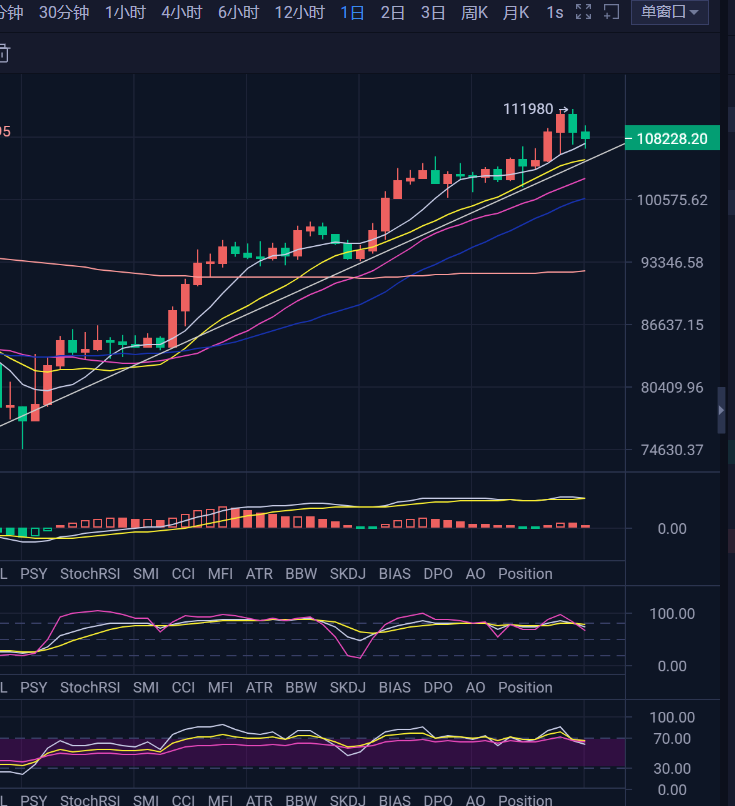
Good weekend everyone! Unknowingly, Bitcoin has approached a high point of 120,000. Yesterday, the market experienced a short-term pullback and fell below 110,000 following Old Trump's statement about increasing tariffs on the EU by 50%. From the market structure, a trend of high-level retreat has emerged. On the daily chart, the market is still in an upward trend line. With a wave of pullback, the coin price has come close to the MA7 line. For today, we need to see whether the price ultimately closes above or below the MA7 line, which will determine the strength of the short-term market. In terms of support, the key position in the short term is around the support line of 105,000. This position is firstly the trend line of this round of upward movement, and secondly, it is also near the defense line for large market players. If it breaks below this, it will exacerbate panic selling in the market. If it goes further down, we need to watch 102,000. According to liquidity flow, the bullish liquidity is mainly concentrated below 102,000. If the bears exert pressure, it will provide an opportunity to clear the bullish liquidity below. Regarding technical indicators, the MACD still needs to be mentioned for its continuous top divergence situation, which has been noted before. However, the final market performance under this top divergence has seen continuous rises. Now, the continuous top divergence is very obvious, which is a hidden danger; we fear a sudden large bearish wave at any time. Other indicators are also operating at a high level, indicating that there is indeed a demand for a pullback, and only a bearish opportunity can emerge.
Currently, the four-hour chart is in a bearish cycle with some small volume increase. The moving averages have formed a death cross. After yesterday's decline, the target for the rebound has not shown bullish strength. At this moment, the market is leaning towards weakness. This weekend, after yesterday's drop, we are looking for low long opportunities at new lows, while also seeking short opportunities during the rebound. This weekend, both long and short positions can be taken!
In terms of operations, consider a short long position when first touching around 106,000. On the upside, around 109,500, you can participate in shorting. Relatively speaking, the short layout can be considered for the medium term, combined with short longs to maximize profits.
Currently, Ethereum's trend is leaning towards some fluctuations. Pay attention to support levels at 2343/2285/2215, with pressure tentatively set at 2660/2680/2700/2720. A key point for the second coin is 2403. Before testing 2403, after breaking last night's new low of 2496, there is still a need to test 2465. There is a demand for fluctuations, and the first touch can be used as a reference point to look for short long opportunities.
【The above analysis and strategies are for reference only. Please bear the risk yourself. The article is subject to review and publication, and market changes in real-time may lead to information lag. Specific operations should follow real-time strategies. Feel free to contact and discuss the market!】

免责声明:本文章仅代表作者个人观点,不代表本平台的立场和观点。本文章仅供信息分享,不构成对任何人的任何投资建议。用户与作者之间的任何争议,与本平台无关。如网页中刊载的文章或图片涉及侵权,请提供相关的权利证明和身份证明发送邮件到support@aicoin.com,本平台相关工作人员将会进行核查。


