
The auction results for the 20-year U.S. Treasury bonds were poor, with the highest winning bid rate reaching 5.047%, about 1.2 basis points higher than the pre-issue rate, marking the largest tail spread in the past six months. The bid-to-cover ratio for Japan's 20-year government bonds was only 2.5 times, significantly lower than last month's 2.96 times, reaching the lowest level since 2012.
The cooling of U.S. and Japanese bonds indicates increased difficulty for government financing, necessitating higher yields to attract investors, which will lead to rising government financing costs. The cooling of these bonds may also cause panic among investors. Concerns about market prospects have led investors to sell off assets, further exacerbating market instability.
Bitcoin
The weekly chart shows a seven-week consecutive rise, with the weekly line first touching the upper Bollinger Band and then retreating below 110,000. If the rebound cannot break through 110,000 and the previous high, there may be a need to pull back to the middle Bollinger Band at 94-95K. In the past two years, every rapid surge has lasted 7-8 weeks, so caution is advised, especially since this is based on the completion of a 0.886 retracement in the U.S. market.
Bitcoin
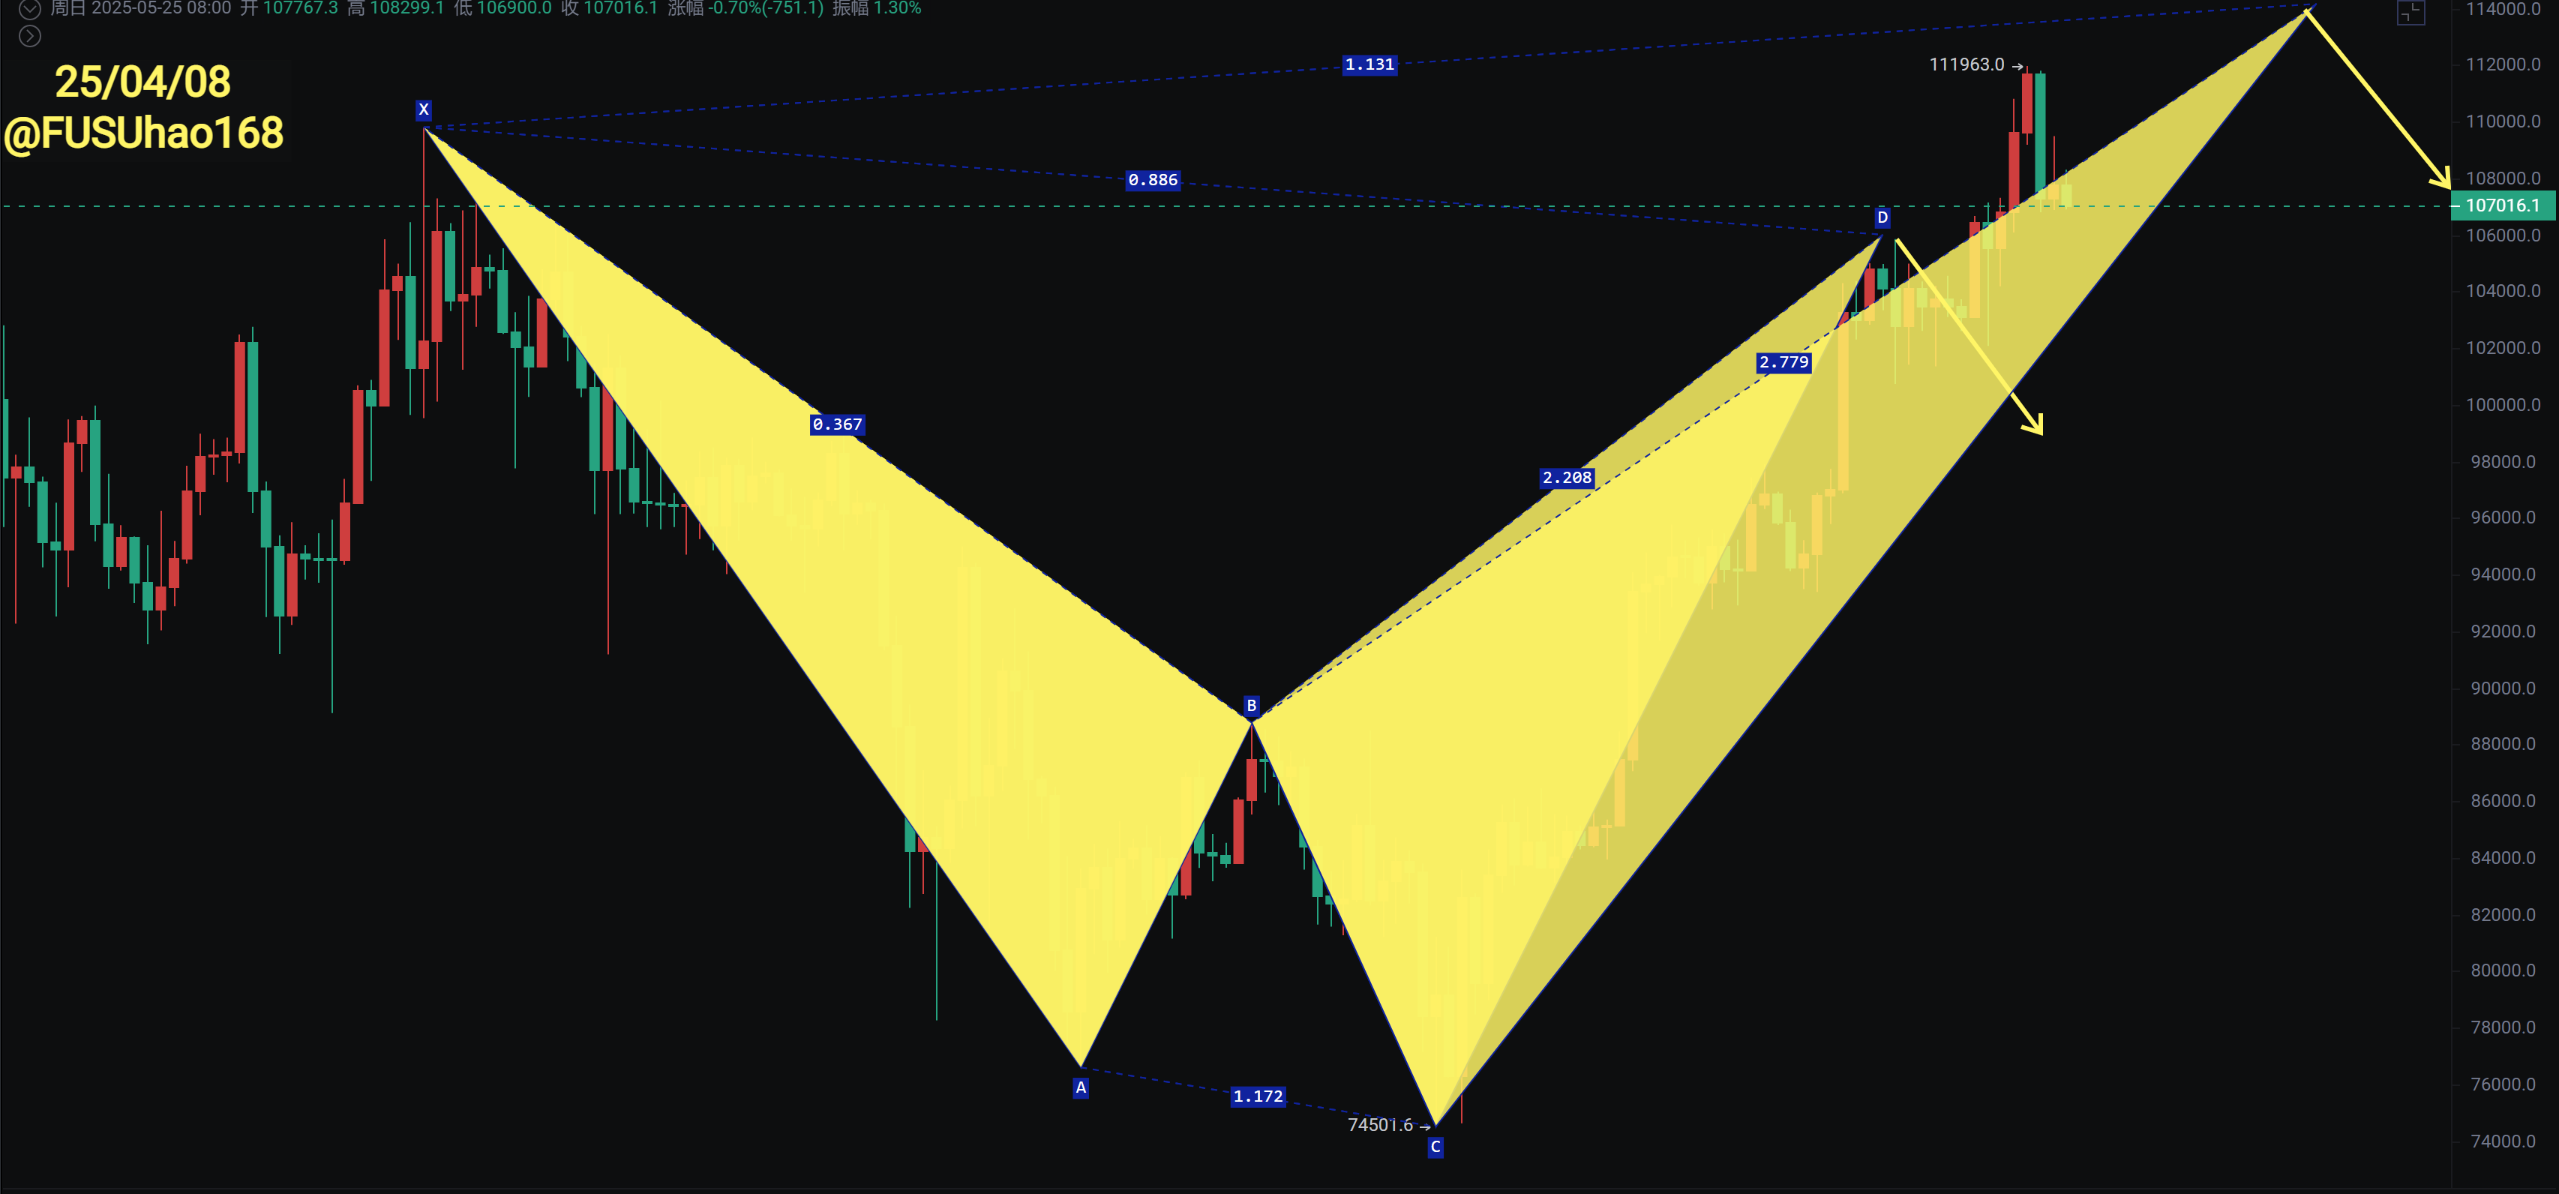
The daily chart shows a completed shark pattern with a 0.886 retracement under 1.13, currently facing resistance and pulling back. The price is now below 110,000, and if the rebound cannot continue to make new highs, the probability of a pullback is high. There is a serious top divergence; previously, the shark pattern near 0.886 was also noted, but the price continued to make new highs, currently showing a false breakout.
The 4-hour chart has broken below 110,000 and the rebound has not regained that level, but the daily upward trend line has not been completely broken. Therefore, a short-term rebound is still expected to pull back. The current test is at the support level of 106,000, with the first target at 100,000 and the second target at 94,000-96,000 for two rounds of increased positions.
Support: 94,000—96,000—100,000
Resistance: 110,000—112,000
Ethereum
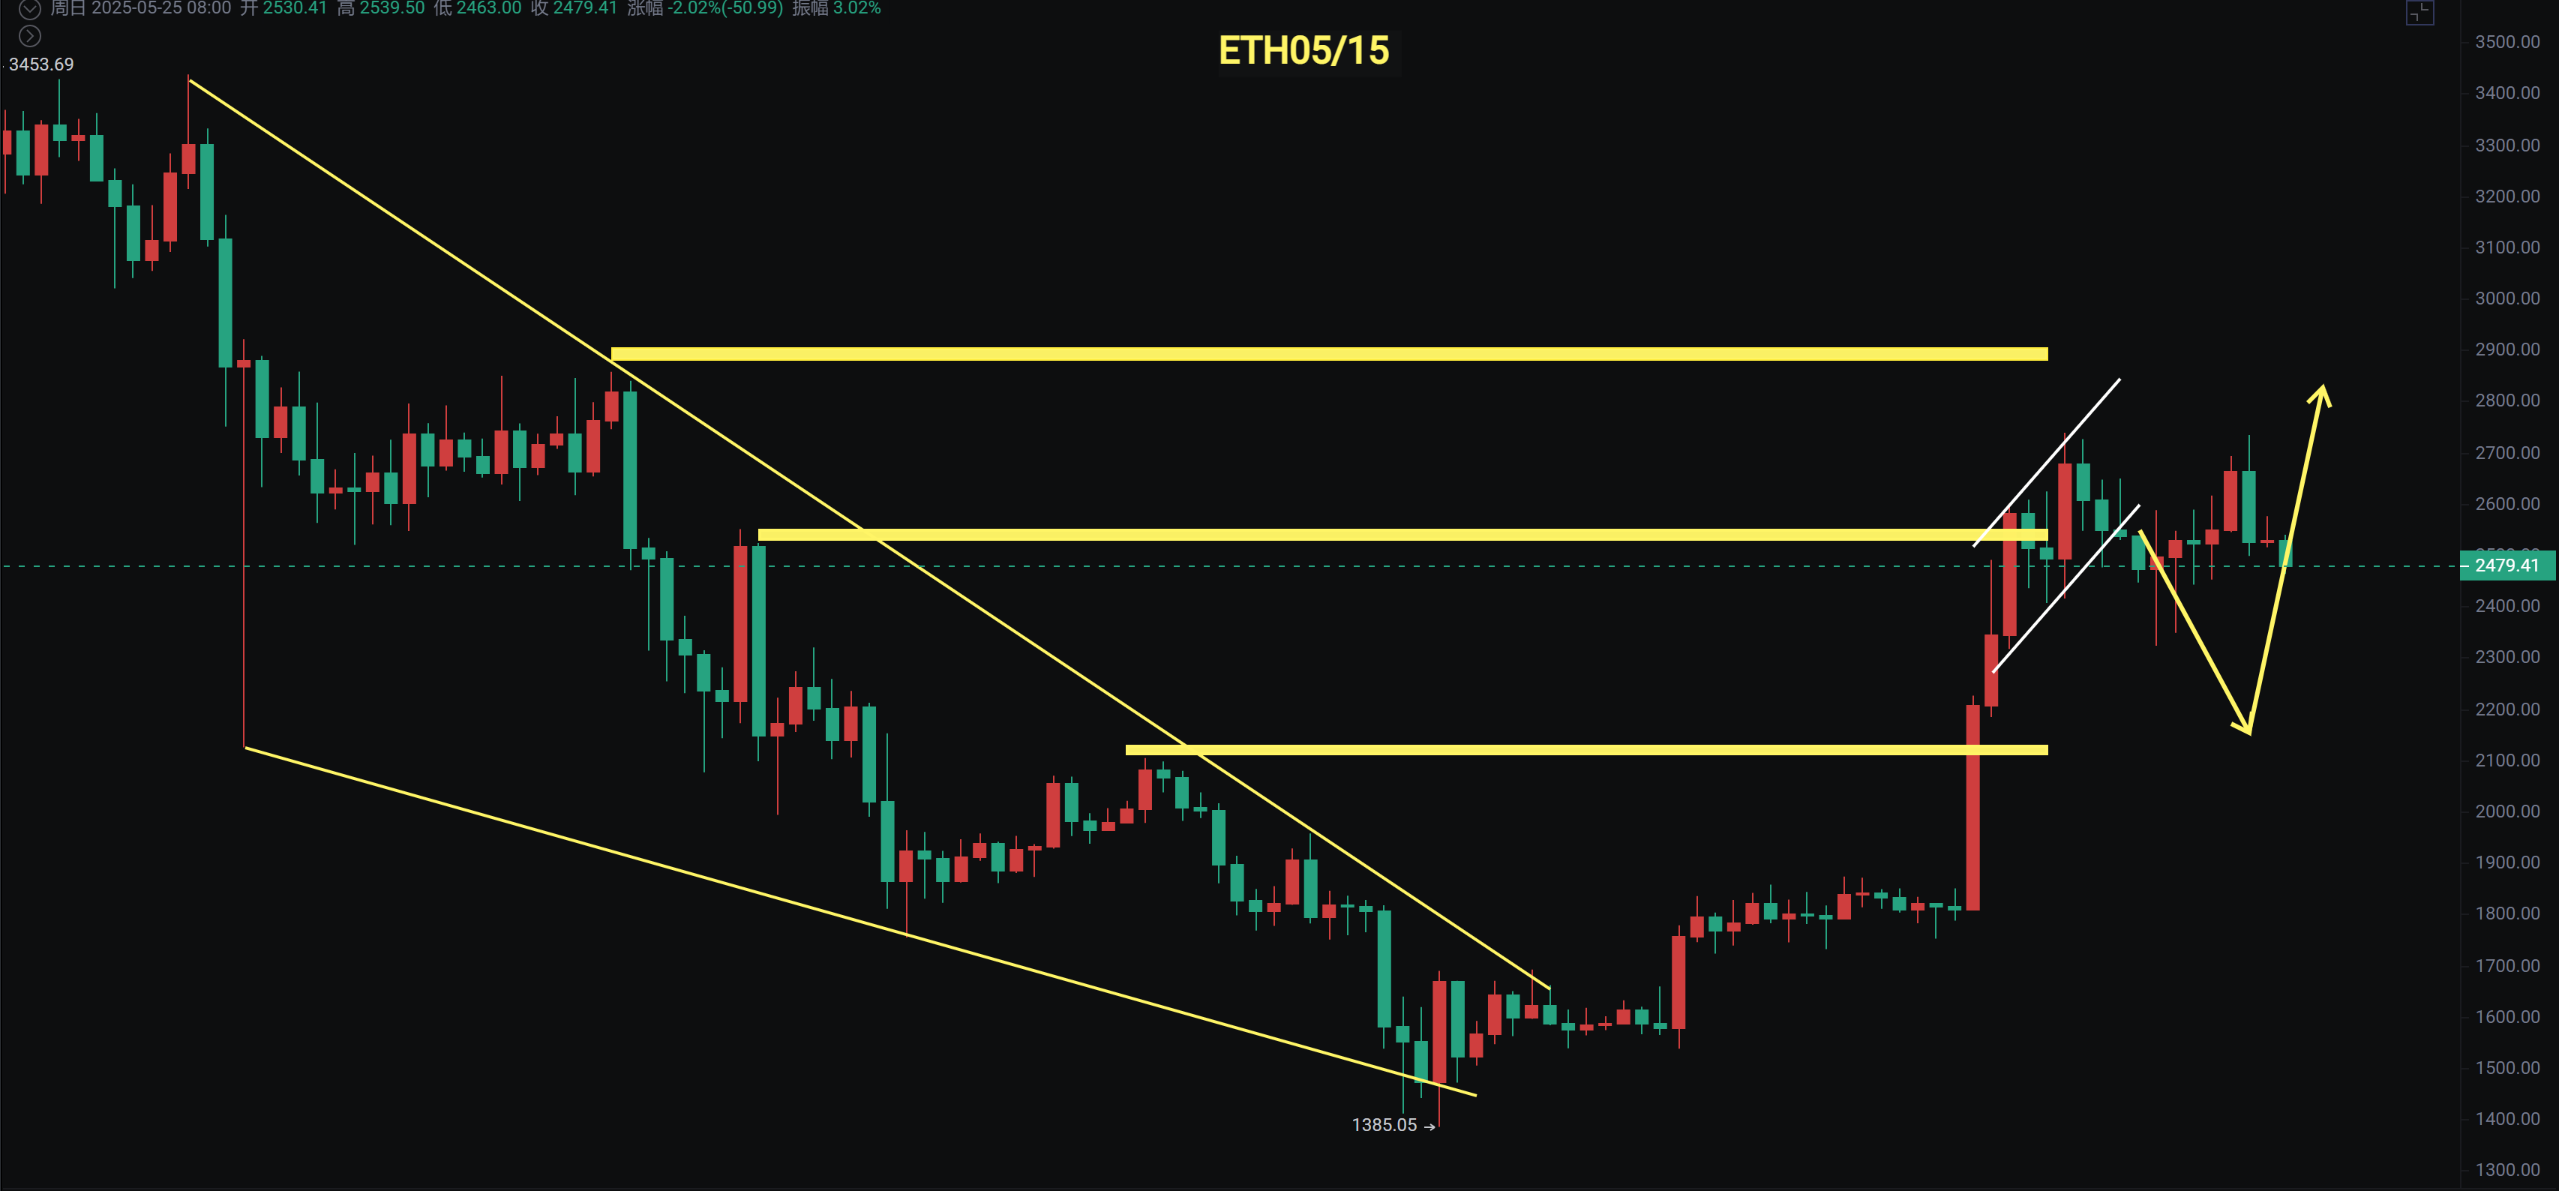
Ethereum has dropped near 2738 after a second test, with the daily line forming an engulfing pattern and breaking the upward trend. The first support is around 2300, with Fibonacci support at 0.382 and 0.5 being 2000-2200. It is recommended to buy in batches as it drops, with the first target at 2300 and the second target at 2100, ideally with a spike.
Support: 2100—2200—2300
Resistance: 2738—2856—3200
If you like my views, please like, comment, and share. Let's navigate through the bull and bear markets together!!!
This article is time-sensitive and for reference only, updated in real-time.
Focusing on K-line technical research, sharing global investment opportunities. Public account: BTC Trading Master Fusu

免责声明:本文章仅代表作者个人观点,不代表本平台的立场和观点。本文章仅供信息分享,不构成对任何人的任何投资建议。用户与作者之间的任何争议,与本平台无关。如网页中刊载的文章或图片涉及侵权,请提供相关的权利证明和身份证明发送邮件到support@aicoin.com,本平台相关工作人员将会进行核查。


